WHY OCEAN PLASTIC DOES NOT ADD UP
Oceans
Far more plastic is estimated to enter the sea than floats at its surface, and no budget is closed. A 2025 study estimates about 27 Mt of nanoplastic in the North Atlantic mixed layer alone, an extrapolation from one cruise that we grade C.
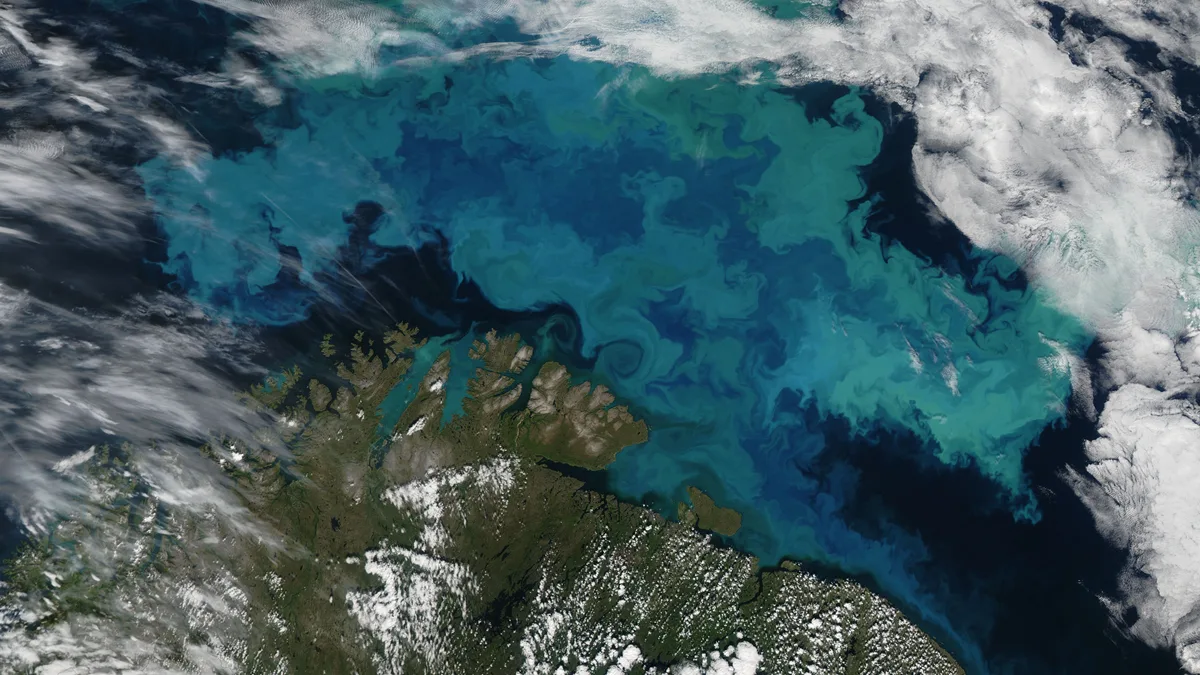
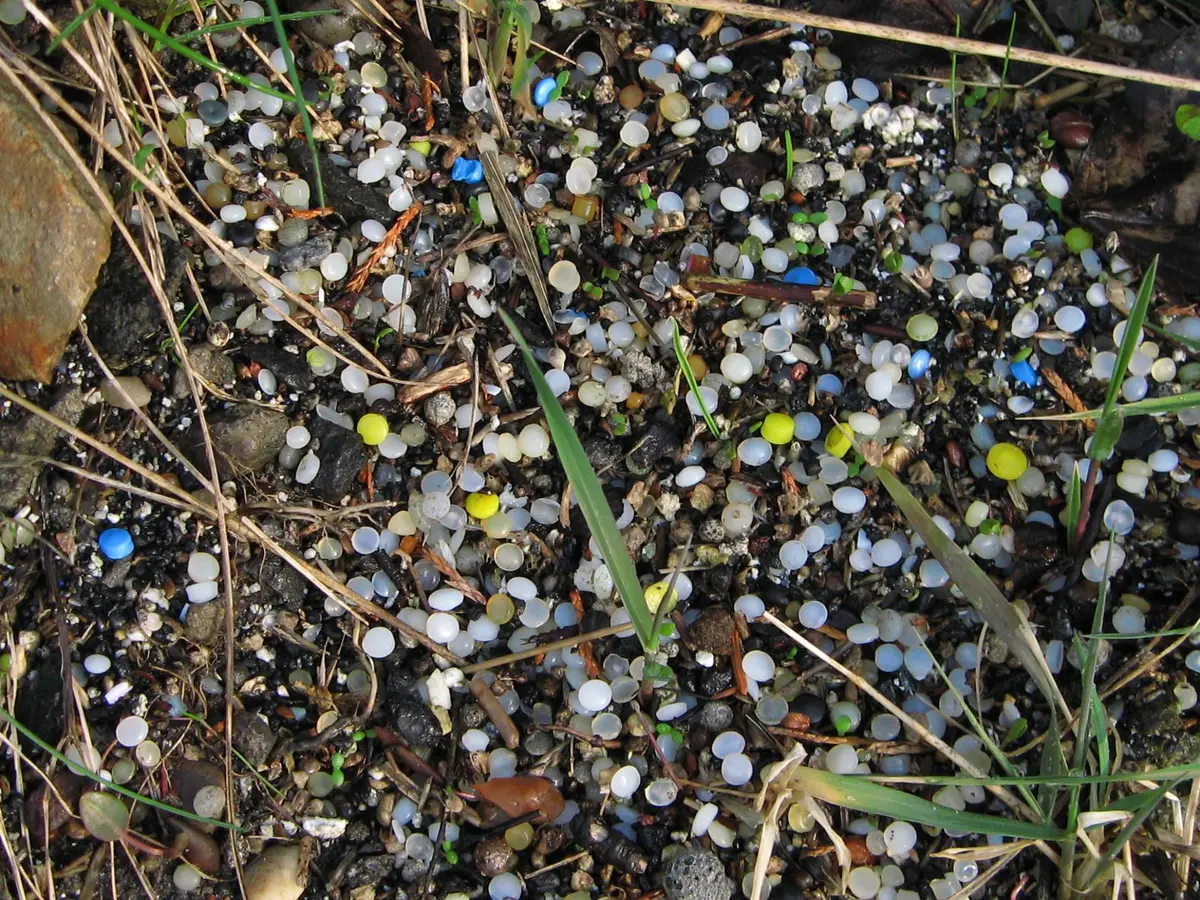
For years the ocean's plastic did not add up. One model put plastic waste entering the sea from coastal land at 4.8–12.7 million metric tons (Mt) in 20101. Net and visual surveys suggested only about 270,000 metric tons afloat2. Several explanations compete, and none closes the budget. Plastic sinks, settles on the seafloor and freezes into ice; rivers hold much of it back; newer models put the input far lower; and nets miss small particles. In 2025 a Dutch team estimated about 27 Mt of nanoplastic in the North Atlantic mixed layer alone, an extrapolation from one cruise (level C)3.
≈27 Mt
nanoplastic in the mixed layer of the temperate to subtropical North Atlantic
estimate, not measurement; PET, PS and PVC below 1 µm; 12 stations sampled in November 2020; mass extrapolated from the nine open-ocean stations over the November climatological mixed layer between 8.5° N and 55° N; TD-PTR-MS3
single cruise and single lab; the authors report concentrations as a lower limit; PE not detected, PP in one sample that the authors excluded as possible contamination
CLimited82–358 trillion
plastic particles floating at the ocean surface in 2019
model estimate from 11,777 net samples, 1979–2019, nearly 95% with 320–350 µm mesh, so smaller particles are not counted; mean 171 trillion4
single model; its mass of 1.1–4.9 Mt (mean 2.3 Mt) is converted from counts at a fixed 0.0136 g per particle, not weighed
CLimited≈3.2 Mt
initially buoyant plastic in the whole ocean, coasts included, in 2020
estimate, not measurement; 95% interval 3.0–3.4 Mt; sizes 0.1–1,600 mm; PE, PP and PS only; model fitted to about 22,000 observations5
more than 95% of this mass is in items larger than 25 mm; a different inventory from the OECD stock below
CLimited≈30 Mt and ≈109 Mt
plastic accumulated in the ocean and in rivers by 2019
estimates, not measurements; OECD Global Plastics Outlook 2022 model of mismanaged and littered waste leaking to water since 1951, built around large items; not a count of particles by size6
one model; not to be added to or subtracted from the 3.2 Mt buoyant-plastic estimate
CLimited4.8–12.7 Mt
plastic waste entering the ocean from coastal land in 2010, one model
estimate, not measurement; 192 coastal countries; Jambeck et al. 20151,6,5
separate estimates, not one range: the OECD model gives 1.7 Mt reaching the ocean in 2019, and Kaandorp et al. 2023 about 0.5 Mt of initially buoyant plastic in 2020
CLimitedMost ocean plastic arrives through rivers and coasts
Estimates of how much plastic reaches the sea differ by more than an order of magnitude, partly because they count different things. Jambeck and colleagues estimated that 4.8–12.7 Mt of plastic waste from 192 coastal countries entered the ocean in 2010 (level C)1. Meijer and colleagues modeled river emissions at 0.8–2.7 Mt per year, 80% of it from more than 1,000 rivers, many of them small and urban (level C)7.
The OECD estimated that 6.1 Mt leaked into rivers, lakes and seas in 2019, of which 1.7 Mt reached the ocean6. It attributes its lower values to its assumptions: about a third of mismanaged waste burned in open pits, about 44% buried in dumpsites, and years of retention in rivers. How much plastic of all kinds enters the sea is disputed, and different base years and definitions limit comparison (level D)6.
Kaandorp and colleagues fitted a model to about 22,000 surface, beach and deep-sea observations. It puts the 2020 input of initially buoyant plastic at about 0.5 Mt, with rivers adding only 57,000–69,000 t (level C)5. It leaves out polyvinyl chloride (PVC) and polyethylene terephthalate (PET), which it cites as 35–40% of the mass entering the sea5. This is a separate quantity, not the low end of one range.
Stocks are no more certain. The OECD model estimates about 30 Mt in seas and oceans and 109 Mt in rivers by 2019 (level C)6. It follows leaked waste since 1951, is built around large items and does not sort particles by size. Kaandorp's 3.2 Mt of buoyant plastic is a different inventory; the two must not be added or subtracted5.
Plastic held in rivers is retained upstream, not stored in the sea: rivers act as reservoirs as well as conduits8.
Plastic sinks, drifts on currents and freezes into ice
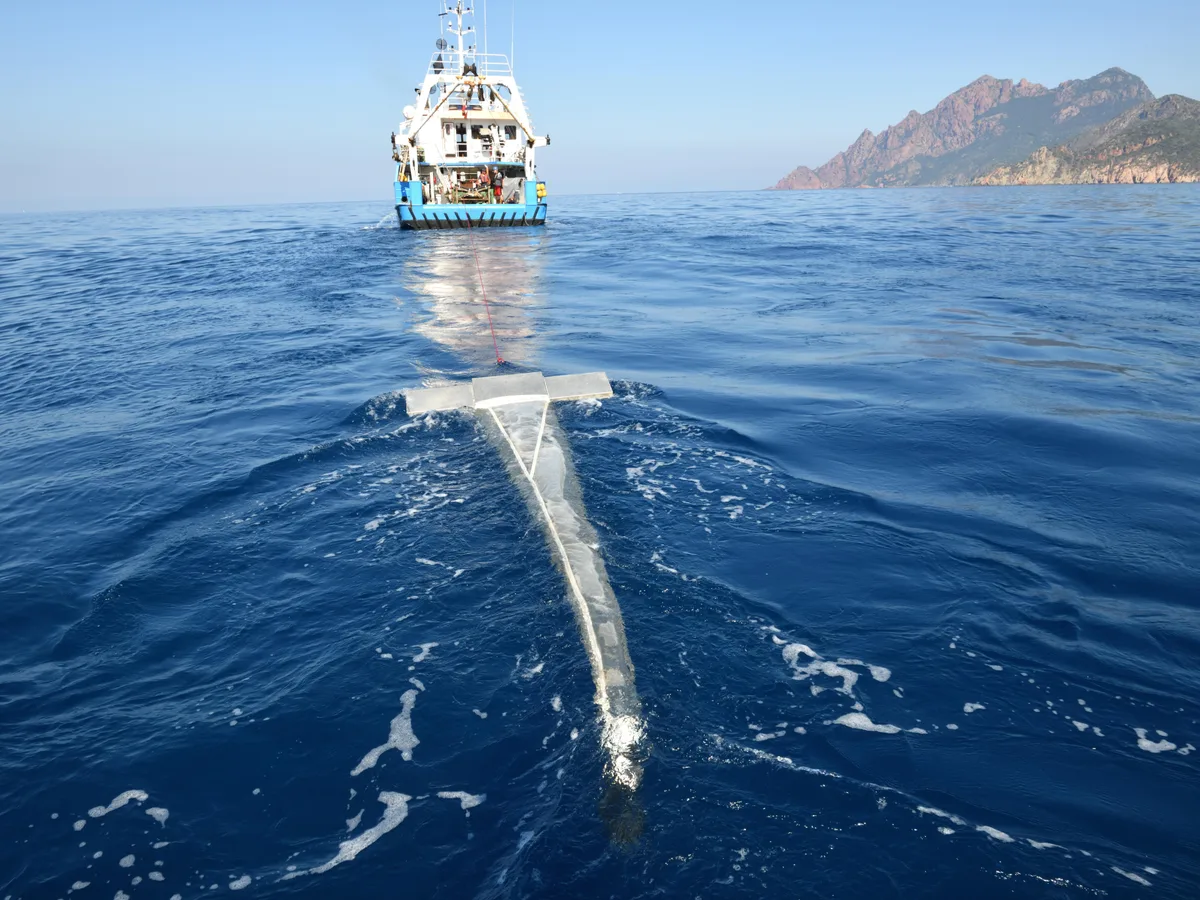
Surface surveys see only part of the stock. Most use neuston or manta nets with a mesh of about 0.33 mm, so smaller particles pass through (level P)2,4.
From net tows and visual surveys made in 2007–2013, Eriksen and colleagues estimated at least 5.25 trillion floating particles weighing 268,940 t2. Their 2023 update put the 2019 total at 82–358 trillion particles (an estimate, level C)4. Its mass of 1.1–4.9 Mt (mean 2.3 Mt) was not weighed. The authors multiplied counts by a fixed 0.0136 g per particle from earlier literature, a simple conversion they acknowledge (level C)4.
Count and mass tell different stories. In the Great Pacific Garbage Patch, Lebreton and colleagues estimated 79,000 t (45,000–129,000 t) of plastic floating over 1.6 million km². Microplastics made up 94% of the 1.8 trillion pieces but only 8% of the mass, and fishing nets at least 46% (level C)9. Several of the authors are linked to The Ocean Cleanup (level P)9.
Below the surface, a synthesis of 1,885 depth profiles collected from 2014 to 2024 found microplastic abundances from 0.0001 to 10,000 particles per cubic meter10. Particles of 1–100 µm were spread more evenly with depth than larger ones (level B)10.
On the deep seafloor, bottom currents concentrate particles. In the northern Tyrrhenian Sea, Kane and colleagues found up to 190 pieces per 50 g of sediment, the highest count then reported for any seafloor setting (level C)11. From 51 samples in the Great Australian Bight, Barrett and colleagues extrapolated about 14 Mt of microplastic in the top 9 cm of the world's seafloor (level C)12.
Arctic sea-ice cores from Fram Strait and the central Arctic held up to about 12,000 particles per liter of melted ice. Two thirds fell in the smallest class detected, 11 µm (level C)13. One Antarctic sea-ice core averaged 52.3 ng/mL of polyethylene (PE), polypropylene (PP) and PET nanoplastics, measured with the mass-spectrometry method used in the North Atlantic study below (level C)14.
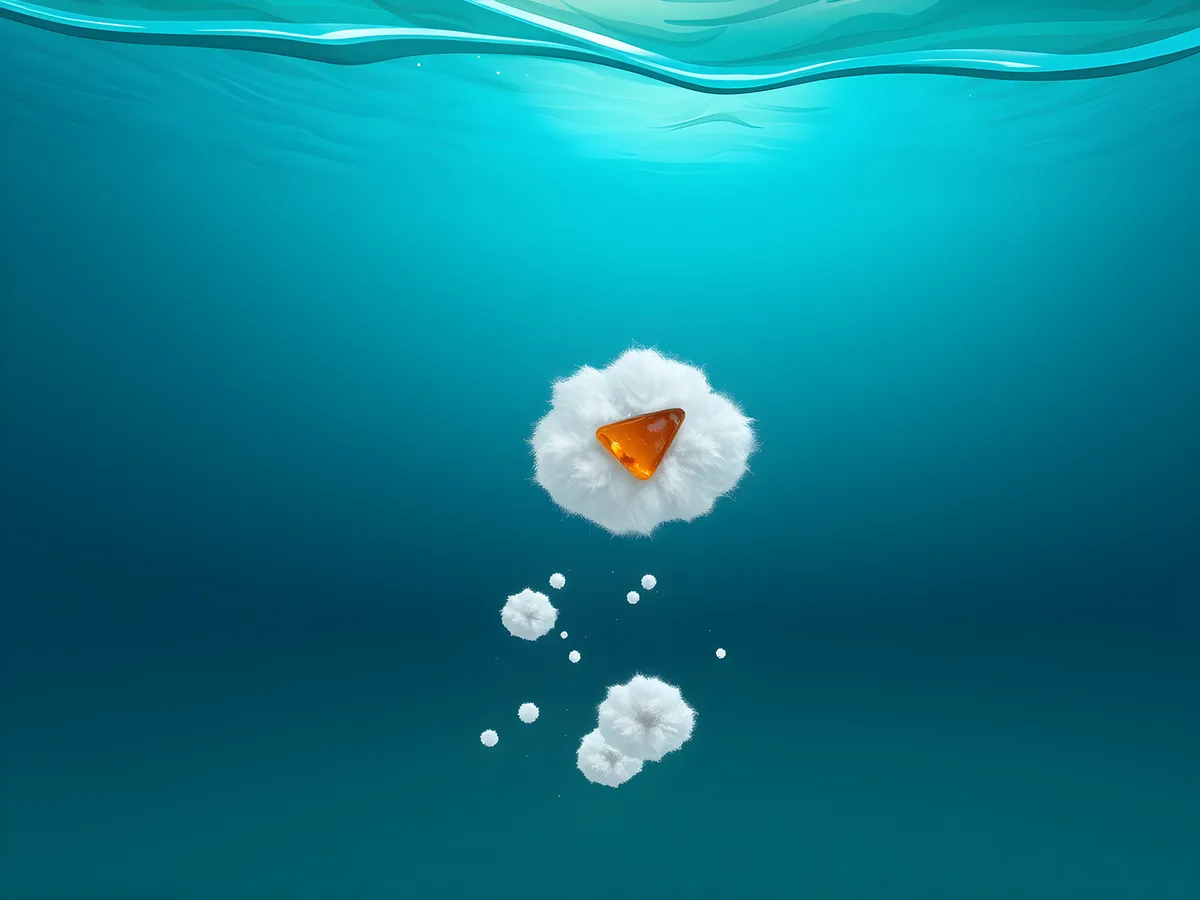 Illustration
Nanoplastics may outweigh larger plastic in the North Atlantic
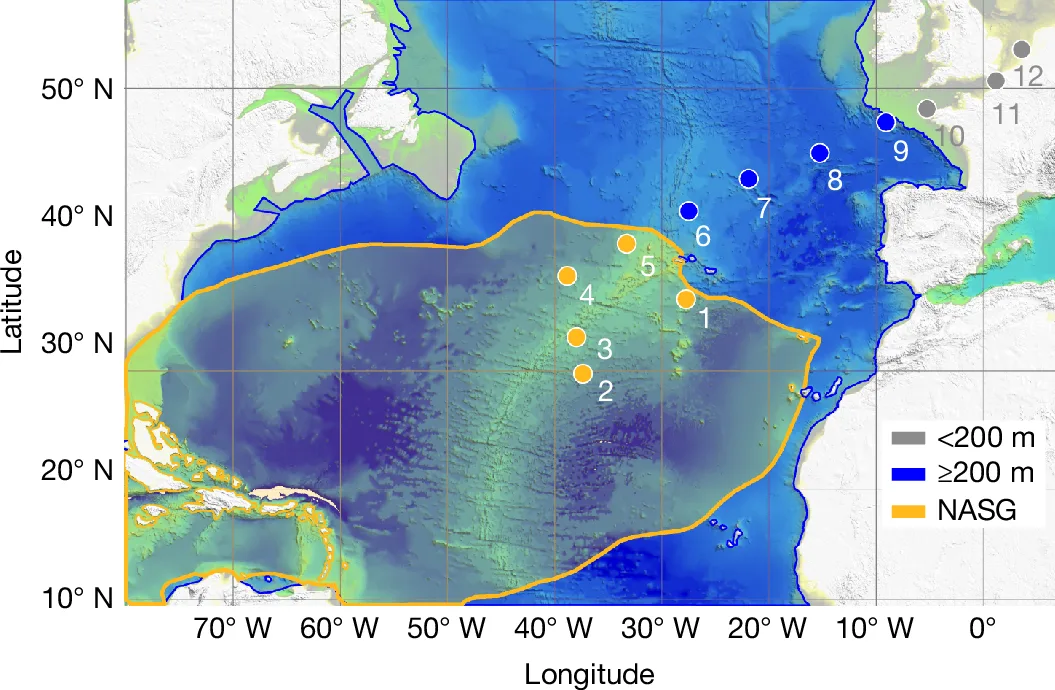
Nanoplastics, below 1 µm, pass through any net. Ter Halle and colleagues first identified them in North Atlantic gyre water in 2017, without a mass15. In November 2020, ten Hietbrink, Materić and colleagues sampled 12 stations from the subtropical gyre to the European shelf3.
All were sampled at 10 m. The nine open-ocean stations were also sampled at 1,000 m and 30 m above the seafloor, and the three shelf stations 5–10 m above the seafloor. They analyzed the water passing 1 µm filters by thermal-desorption proton-transfer-reaction mass spectrometry (TD-PTR-MS).
PET, polystyrene (PS) and PVC appeared at every station in the mixed layer, averaging 18.1 mg/m³ across all 12 and 25.0 mg/m³ at the three shelf stations near Europe. At the nine open-ocean stations the mixed layer averaged 15.1–16.7 mg/m³, against 10.9 mg/m³ at 1,000 m and 5.5 mg/m³ near the bottom, mostly PET there (level C)3. PE was not detected. PP appeared in one mixed-layer sample (station 8); the authors excluded it as possible contamination3.
The authors scaled the open-ocean values to the November mixed layer between 8.5° N and 55° N. That gives 15.20 Mt inside the gyre and 11.73 Mt outside it, about 27 Mt in all (an estimate, level C)3. By polymer that is 11.95 Mt PET, 6.52 Mt PS and 8.47 Mt PVC (our sums of the paper's regional values, level P).
The paper sets this against 0.36 Mt of larger buoyant plastic in the same water, modeled by Kaandorp and colleagues. Dividing 26.93 Mt by 0.36 Mt gives about 75 (our ratio, level P)3,5, but the two cover different polymers and sizes, and one is a lower-limit extrapolation. The authors suggest weathering may have altered PE and PP beyond recognition, or that they fell below detection3. The result covers one basin, one season and one depth per layer.
Estimate
The 27 Mt figure is an extrapolation, not a measured total (level C). If the paper's six standard errors (three polymers in two regions) are independent, they combine to about ±2.8 Mt (our calculation in quadrature, level P); the paper itself gives no combined error, and this covers only the statistical part. Nine open-ocean stations stand for about 1.7 million cubic kilometers of water (our sum of the paper's volumes, level P).
The authors call their concentrations semiquantitative and a lower limit, because not all plastic is converted into detectable ions. From a PS spike test that recovered about 7%, they infer that actual PS concentrations might be 14 times higher. That is their interpretation, not a correction factor: recovery for PET and PVC was not tested, lab blanks averaged 0.90 mg/m³, and the team screened for false positives from organic matter. Confirmation would need an independent laboratory, a second method such as pyrolysis GC/MS, other seasons and other ocean basins.
Nanoplastics in the North Atlantic, November 2020: concentration by depth and estimated mass by polymer
Data table
| label | value | unit | panel | se | gyre | outside_gyre |
|---|---|---|---|---|---|---|
| mixed layer, 10 m, all 12 stations (includes 3 shelf stations) | 18.1 | mg/m³ | concentration | 2.1 | ||
| mixed layer, gyre stations 1–5 | 15.1 | mg/m³ | concentration | 3.3 | ||
| mixed layer, outside gyre stations 6–9 | 16.7 | mg/m³ | concentration | 3.5 | ||
| intermediate water, 1,000 m, stations 1–9 | 10.9 | mg/m³ | concentration | 1.6 | ||
| bottom water, 30 m above seafloor, stations 1–9 | 5.5 | mg/m³ | concentration | 0.6 | ||
| mixed layer, coastal shelf stations 10–12 | 25 | mg/m³ | concentration | 4.2 | ||
| PET | 11.95 | Mt | mass estimate | 6.74 ± 1.13 | 5.21 ± 0.84 | |
| PS | 6.52 | Mt | mass estimate | 4.10 ± 1.46 | 2.42 ± 1.09 | |
| PVC | 8.47 | Mt | mass estimate | 4.37 ± 1.28 | 4.10 ± 0.96 | |
| modeled larger buoyant plastic, same mixed layer (Kaandorp et al. 2023, cited in the paper) | 0.36 | Mt | mass estimate |
Rivers, lakes and groundwater hold plastic too
Most ocean plastic passes through fresh water first, and some stays there. Nava and colleagues sampled surface water in 38 lakes and reservoirs in 23 countries with one method and found plastic larger than 250 µm in every one (level C)16. The highest concentrations, about 5.4–11 particles per cubic meter in Lake Tahoe, Lake Maggiore and Lake Lugano, matched or exceeded those reported in subtropical ocean gyres (level C)16. The lake values are our reading of the paper's Extended Data Fig. 2 (level P).
Nanoplastic data for fresh water are thin. One 2022 study used pyrolysis GC/MS to quantify six polymers: 0.28–0.79 µg/L in surface water and 0.02–0.20 µg/L in riverbank-filtered groundwater, mostly PP and PE (level C)17. Since 1 µg/L equals 1 mg/m³, that surface range is 0.28–0.79 mg/m³, well below the North Atlantic mixed-layer mean of 18.1 mg/m³ (our conversion, level P). Different instruments, separation steps and polymers mean the ratio does not rank fresh water against the sea.
Groundwater matters because it is a drinking-water source; what reaches people is on the Human Body page. Data quality is a known weakness: of 50 freshwater and drinking-water studies reviewed in 2019, only four met all proposed quality criteria18.
Many species swallow plastic; proven harm is narrower
Encounters with plastic are documented across marine life. A 2015 review of 340 publications counted 693 species that had encountered marine debris by entanglement or ingestion; plastic made up 92% of the encounters (level B)19. A 2021 synthesis of 171,774 fish of 555 species found plastic in 386 species, 210 of them commercially fished. Where microplastics were counted, 26% of fish had ingested plastic (level B)20.
Swallowing plastic is not the same as being harmed by it. A 2016 systematic review found that 83% of 296 tested threats from marine debris were demonstrated, but 89% of the demonstrated impacts were molecular, cellular or tissue changes. Deaths and changes in communities came mainly from plastic debris larger than 1 mm, such as rope, straws and fragments (level B)21. A 2020 meta-analysis of 139 studies in water and on land found that only 17% of the concentrations used in experiments had been found in nature (level B)22.
Food-web and carbon-cycle consequences are not established. Predatory fish higher in the food web are the most likely to contain plastic20, a sign of exposure, not proof that plastic builds up along food chains. In one laboratory test, copepods given 20.6 µm polystyrene beads at 1,000 per milliliter produced fecal pellets that sank 2.25 times more slowly (level C)23. That dose is about 100,000 times the highest subsurface count in the 2025 synthesis (our comparison, level P)10.
Lanternfish feeding near the surface and releasing particles at depth are a likely route for microplastics to the seafloor20. We found no field measurement showing that plastic changes the ocean's carbon export (level E; site registry and a web search, 3 November 2026). For nanoplastics, ten Hietbrink and colleagues note that most toxicity studies use concentrations not anchored in robust environmental measurements (level C)3. Seafood and people are covered on Human Body.
Inputs, sinks and the smallest sizes remain open
The ocean plastic budget is not closed, and its input estimates are not one range. They differ in year, polymers, pathways and assumptions: 4.8–12.7 Mt of all plastic in 2010, 1.7 Mt in 2019 and about 0.5 Mt of buoyant plastic in 20201,6,5.
Kaandorp's model concludes there is no missing sink for buoyant plastic5; the North Atlantic study suggests a large nanoplastic mass that no budget included3. Both can hold: one covers buoyant pieces larger than 0.1 mm, the other dense polymers below 1 µm. Neither closes the budget for all plastic.
Methods are not standardized, so counts from different nets, filters and instruments rarely compare directly10. We found no comparable basin-scale nanoplastic mass survey of the Pacific, Indian or Southern Ocean (level E; site registry and two web searches, 3 November 2026).
Plastic already in the sea will stay. In one 2024 Earth system model, cutting pollution by more than 5% a year from 2026 stabilizes the global ocean microplastic inventory (an estimate, level C)24. No trajectory reduces it substantially by 2100, and deeper layers keep accumulating. A 2024 review projects that environmental microplastic contamination could double by 204025.
Limitation
Counts and masses in this page are never interchangeable. A trillion small particles can weigh less than one fishing net, and each survey sees only the sizes its net, filter or instrument can catch: 0.33 mm for most surface nets, 0.25 mm in the lake survey, 11 µm in the Arctic ice cores and below 1 µm in the North Atlantic nanoplastic study.
Separate published estimates of plastic mass in rivers and the ocean, not one budget
Data table
| label | value | unit | group | source | level | kind | low | high |
|---|---|---|---|---|---|---|---|---|
| rivers, global, 2019 (OECD model, built around large items) | 109 | Mt | modeled stock from waste leakage | S-011 | C | model estimate | ||
| ocean, global, 2019 (OECD model, built around large items) | 30 | Mt | modeled stock from waste leakage | S-011 | C | model estimate | ||
| initially buoyant plastic 0.1–1,600 mm, PE, PP and PS, whole ocean incl. coasts, 2020 | 3.2 | Mt | fitted mass budget | S-071 | C | model estimate | 3 | 3.4 |
| nanoplastic below 1 µm, PET, PS and PVC, North Atlantic mixed layer only, 2020 | 27 | Mt | extrapolated from samples | S-067 | C | extrapolated from 9 open-ocean stations; lower limit per authors | ||
| microplastic, top 9 cm of the global seafloor | 14 | Mt | extrapolated from samples | S-335 | C | extrapolated from 51 samples in one region | ||
| floating plastic caught by surface nets (mostly ≥ 0.33 mm), global, 2019 | 2.3 | Mt | extrapolated from samples | S-065 | C | model from net samples; value is the paper's mean; mass from counts at a fixed 0.0136 g per particle | 1.1 | 4.9 |
| floating plastic, Great Pacific Garbage Patch | 0.079 | Mt | extrapolated from samples | S-068 | C | model calibrated with surveys; minimum estimate | 0.045 | 0.129 |
Frequently asked questions
Is the Great Pacific Garbage Patch a floating island of trash?
No. One 2018 estimate puts about 79,000 t of plastic over 1.6 million km², in 1.8 trillion scattered pieces, most of them small; on average that is about 49 kg per square kilometer (our calculation, level P). Most of the mass is in large items such as nets (level C,9).
Is there more nanoplastic than larger plastic in the ocean?
In the mixed layer of the temperate to subtropical North Atlantic, one 2025 study estimates about 27 Mt of nanoplastic, against 0.36 Mt of larger buoyant plastic in a separate model. The two cover different polymers and sizes. We found no comparable survey of another ocean, so a global answer is not established (level C,3).
Does plastic sink?
Yes. Dense polymers such as PET and PVC sink, and floating ones can sink once they are coated by organisms or caught in marine snow. One model estimates that 220,000 t of initially buoyant plastic reach marine sediments each year (estimate, level C,5).
Are lakes cleaner than the open ocean?
Not always. A survey of 38 lakes and reservoirs found plastic in every one, and the three most polluted matched or exceeded concentrations reported in subtropical ocean gyres (level C,16).
Where to go next
How ocean plastic fits into the planet-wide flows behind the home counters is on Flows & Model, and how sea spray returns particles to the air is on Atmosphere. Land sources and farm soils are on Soil. River barriers, ocean cleanup and their removal totals are on Solutions by System. Instruments and their size limits are on How We Measure It, and pellet and treaty rules on Policy & Regulation.
Sources
- Jambeck JR, Geyer R, Wilcox C, Siegler TR, Perryman M, Andrady A et al. (2015). Plastic waste inputs from land into the ocean. Science. doi:10.1126/science.1260352 journal article
- Eriksen M, Lebreton LCM, Carson HS, Thiel M, Moore CJ, Borerro JC et al. (2014). Plastic Pollution in the World's Oceans: More than 5 Trillion Plastic Pieces Weighing over 250,000 Tons Afloat at Sea. PLoS ONE. doi:10.1371/journal.pone.0111913 journal article open access
- ten Hietbrink S, Materić D, Holzinger R, Groeskamp S, Niemann H (2025). Nanoplastic concentrations across the North Atlantic. Nature. doi:10.1038/s41586-025-09218-1 journal article
- Eriksen M, Cowger W, Erdle LM, Coffin S, Villarrubia-Gómez P, Moore CJ et al. (2023). A growing plastic smog, now estimated to be over 170 trillion plastic particles afloat in the world’s oceans—Urgent solutions required. PLOS ONE. doi:10.1371/journal.pone.0281596 journal article open access
- Kaandorp MLA, Lobelle D, Kehl C, Dijkstra HA, van Sebille E (2023). Global mass of buoyant marine plastics dominated by large long-lived debris. Nature Geoscience. doi:10.1038/s41561-023-01216-0 journal article
- OECD (2022). Global Plastics Outlook: Economic Drivers, Environmental Impacts and Policy Options. OECD Publishing. doi:10.1787/de747aef-en report open access
- Meijer LJJ, van Emmerik T, van der Ent R, Schmidt C, Lebreton L (2021). More than 1000 rivers account for 80% of global riverine plastic emissions into the ocean. Science Advances. doi:10.1126/sciadv.aaz5803 journal article open access
- van Emmerik T, Mellink Y, Hauk R, Waldschläger K, Schreyers L (2022). Rivers as Plastic Reservoirs. Frontiers in Water. doi:10.3389/frwa.2021.786936 review open access
- Lebreton L, Slat B, Ferrari F, Sainte-Rose B, Aitken J, Marthouse R et al. (2018). Evidence that the Great Pacific Garbage Patch is rapidly accumulating plastic. Scientific Reports. doi:10.1038/s41598-018-22939-w journal article open access
- Zhao S, Kvale KF, Zhu L, Zettler ER, Egger M, Mincer TJ et al. (2025). The distribution of subsurface microplastics in the ocean. Nature 641:51-61. doi:10.1038/s41586-025-08818-1 journal article open access
- Kane IA, Clare MA, Miramontes E, Wogelius R, Rothwell JJ, Garreau P et al. (2020). Seafloor microplastic hotspots controlled by deep-sea circulation. Science 368:1140-1145. doi:10.1126/science.aba5899 journal article
- Barrett J, Chase Z, Zhang J, Holl MMB, Willis K, Williams A et al. (2020). Microplastic Pollution in Deep-Sea Sediments From the Great Australian Bight. Frontiers in Marine Science 7:576170. doi:10.3389/fmars.2020.576170 journal article open access
- Peeken I, Primpke S, Beyer B, Gütermann J, Katlein C, Krumpen T et al. (2018). Arctic sea ice is an important temporal sink and means of transport for microplastic. Nature Communications 9:1505. doi:10.1038/s41467-018-03825-5 journal article open access
- Materić D, Kjær HA, Vallelonga P, Tison JL, Röckmann T, Holzinger R (2022). Nanoplastics measurements in Northern and Southern polar ice. Environmental Research. doi:10.1016/j.envres.2022.112741 journal article
- Ter Halle A, Jeanneau L, Martignac M, Jardé E, Pedrono B, Brach L et al. (2017). Nanoplastic in the North Atlantic Subtropical Gyre. Environmental Science & Technology. doi:10.1021/acs.est.7b03667 journal article
- Nava V, Chandra S, Aherne J, Alfonso MB, Antão-Geraldes AM, Attermeyer K et al. (2023). Plastic debris in lakes and reservoirs. Nature. doi:10.1038/s41586-023-06168-4 journal article open access
- Xu Y, Ou Q, Jiao M, Liu G, van der Hoek JP (2022). Identification and Quantification of Nanoplastics in Surface Water and Groundwater by Pyrolysis Gas Chromatography–Mass Spectrometry. Environmental Science & Technology. doi:10.1021/acs.est.1c07377 journal article
- Koelmans AA, Mohamed Nor NH, Hermsen E, Kooi M, Mintenig SM, De France J (2019). Microplastics in freshwaters and drinking water: Critical review and assessment of data quality. Water Research. doi:10.1016/j.watres.2019.02.054 review
- Gall S, Thompson R (2015). The impact of debris on marine life. Marine Pollution Bulletin 92:170-179. doi:10.1016/j.marpolbul.2014.12.041 review
- Savoca MS, McInturf AG, Hazen EL (2021). Plastic ingestion by marine fish is widespread and increasing. Global Change Biology 27:2188-2199. doi:10.1111/gcb.15533 journal article
- Rochman CM, Browne MA, Underwood AJ, van Franeker JA, Thompson RC, Amaral-Zettler LA (2016). The ecological impacts of marine debris: unraveling the demonstrated evidence from what is perceived. Ecology 97(2):302-312. doi:10.1890/14-2070.1 review
- Bucci K, Tulio M, Rochman CM (2020). What is known and unknown about the effects of plastic pollution: A meta-analysis and systematic review. Ecological Applications 30(2):e02044. doi:10.1002/eap.2044 review
- Cole M, Lindeque PK, Fileman E, Clark J, Lewis C, Halsband C et al. (2016). Microplastics Alter the Properties and Sinking Rates of Zooplankton Faecal Pellets. Environmental Science & Technology 50(6):3239-3246. doi:10.1021/acs.est.5b05905 journal article
- Azimrayat Andrews Z, Kvale K, Hunt C (2024). Slow biological microplastics removal under ocean pollution phase-out trajectories. Environmental Research Letters 19:064029. doi:10.1088/1748-9326/ad472c journal article open access
- Thompson RC, Courtene-Jones W, Boucher J, Pahl S, Raubenheimer K, Koelmans AA (2024). Twenty years of microplastic pollution research—what have we learned?. Science. doi:10.1126/science.adl2746 review
Evidence levels and provenance
- AConsensus
- Multiple independent studies or a systematic review plus a statement by a scientific body.
- BWell supportedUsed on this page
- Several independent studies with concordant findings.
- CLimitedUsed on this page
- Few studies, narrow conditions, or methodological caveats.
- DDisputedUsed on this page
- Conflicting results; both sides are shown.
- EUnknownUsed on this page
- No reliable evidence found; the search scope is stated.
- PProvenanceUsed on this page
- Provenance: checked against the primary record. A separate category, not an evidence grade: used for bibliographic facts, legal texts, official metadata, definitions quoted from a standard, the site's own arithmetic and statements about the site's process.
Editorial categories of this site. A–E grade scientific findings, per claim, with a one-line rationale; D and E are not lower rungs of the A–C scale. P is not a grade: it marks facts checked against their primary record.