COUNTING WHAT LIGHT CANNOT RESOLVE
How We Measure It
Standard methods for plastic particles start at 20 µm or 1 µm, so nanoplastics are largely missing from routine monitoring. This page explains what each instrument can and cannot tell, how labs contaminate their own samples, and why careful labs given the same sample report very different numbers.
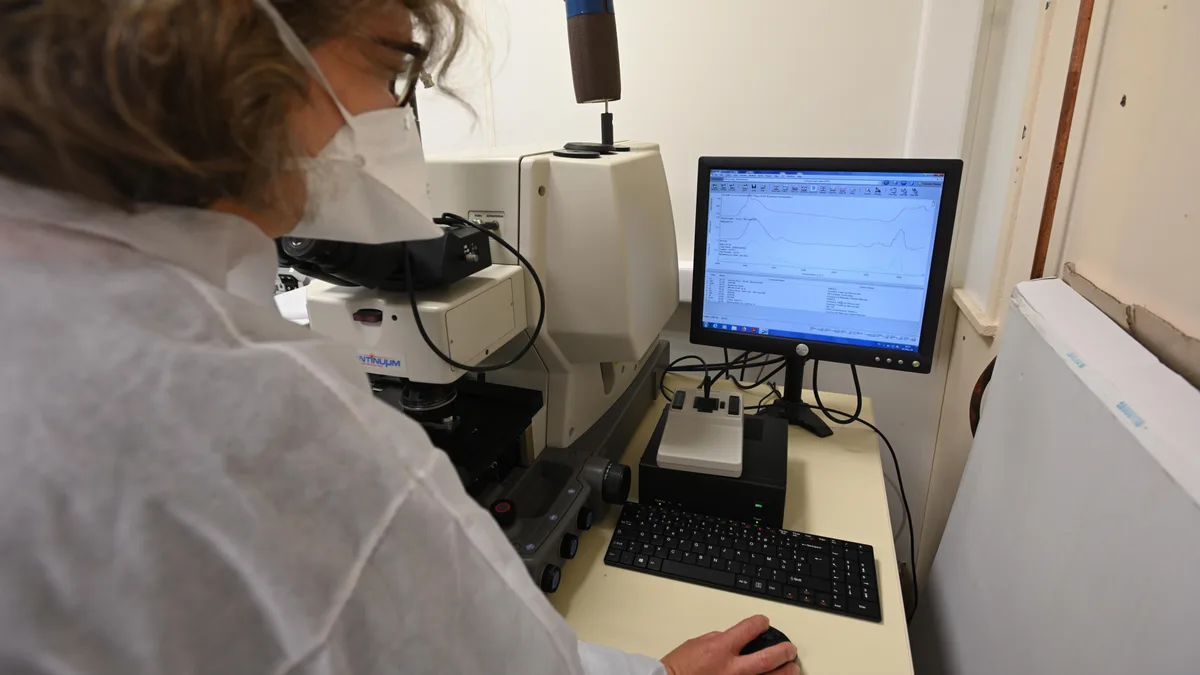
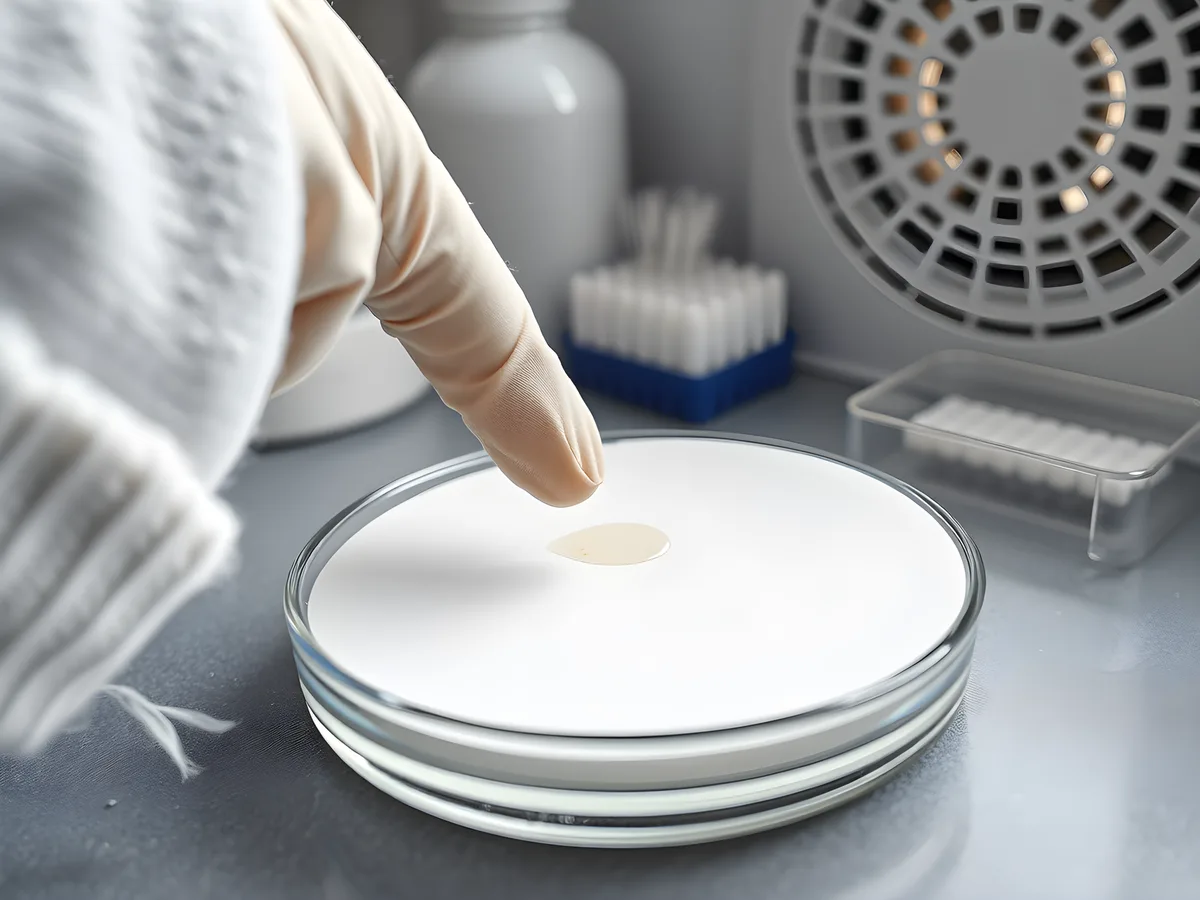
Standard methods miss nanoplastics (below 1 µm): the EU drinking-water method counts nothing below 20 µm1, and ISO 16094-2 starts at 1 µm2. Those are scopes, not instrument limits; one specialist lab has identified particles down to 500 nm by Raman microscopy, recovering 67% of test beads (level C)3. Every step can also add plastic. In a 2026 test, touching a surface with lab gloves left a mean of about 2,000 false "microplastics" per square millimeter (level C)4.
≈2,000 /mm²
false microplastic hits left by dry contact with lab gloves
nitrile and latex gloves, infrared and Raman library matching; cleanroom nitrile gloves ≈100 /mm²; Clough et al. 20264
one lab's test; a 2020 study of 10 glove types found the same stearate artifact (S-291)
CLimited4 of 50
freshwater and drinking-water studies meeting every quality criterion
Koelmans et al. 2019, 50 studies of freshwater, groundwater, tap and bottled water5
systematic quality review; a 2018 biota review found the same weaknesses (S-315)
BWell supported≈1,000×
modeled rise in count when the lower cutoff falls from 300 µm to 1 µm
power-law model, slope 2.2 (marine surface water median), up to 5 mm; our calculation; estimate, not a measurement6
Arithmetic only: extends a fitted power law below its valid range (roughly 50–350 µm in Kooi's samples); the resulting count increase is not established.
PProvenanceSampling sets the smallest particle you can find
A nominal mesh or pore size is not an exact gate. Elongated particles slip through lengthwise, aggregates are counted as larger objects, and small particles lodge in or are lost from membranes7,3. A size range means the nominal cutoff plus a shown recovery.
The EU drinking-water method samples at least 1,000 liters through 100 µm and 20 µm filters and accepts spike recoveries of 60–140%. It reports particles of 20 µm–5 mm and fibers of 20 µm–15 mm per cubic meter1. Sediment and tissue are digested8, which can lose or alter particles.
Contamination is the harder problem; guidelines ask for clothing policies, cleaned glassware, clean-air cabinets and blanks treated like samples9. The 2025 North Atlantic survey used pre-combusted glass vials and set any signal below three standard deviations of its blanks to zero10.
Blanks vary: in a 22-laboratory exercise on clean water they carried 91 particles on average, standard deviation 141 (level C)11.
In a 2024 bottled-water study, ultrapure Milli-Q water run through the whole procedure held about as much plastic as the samples. Materić argued that it was the right procedural blank and that setting it aside for clean filters makes the counts unreliable12. The authors replied that the Milli-Q water was itself contaminated, with a different polymer profile, and that their filter blanks, exposed to the same lab air, controlled the remaining sources (level D)13.
 Illustration
Counting and identifying particles one by one
Particle methods give count, size, shape and, with spectroscopy, polymer. Visible light cannot resolve detail finer than roughly 200–300 nm (our calculation from the Abbe limit14); smaller particles can be detected, not imaged.
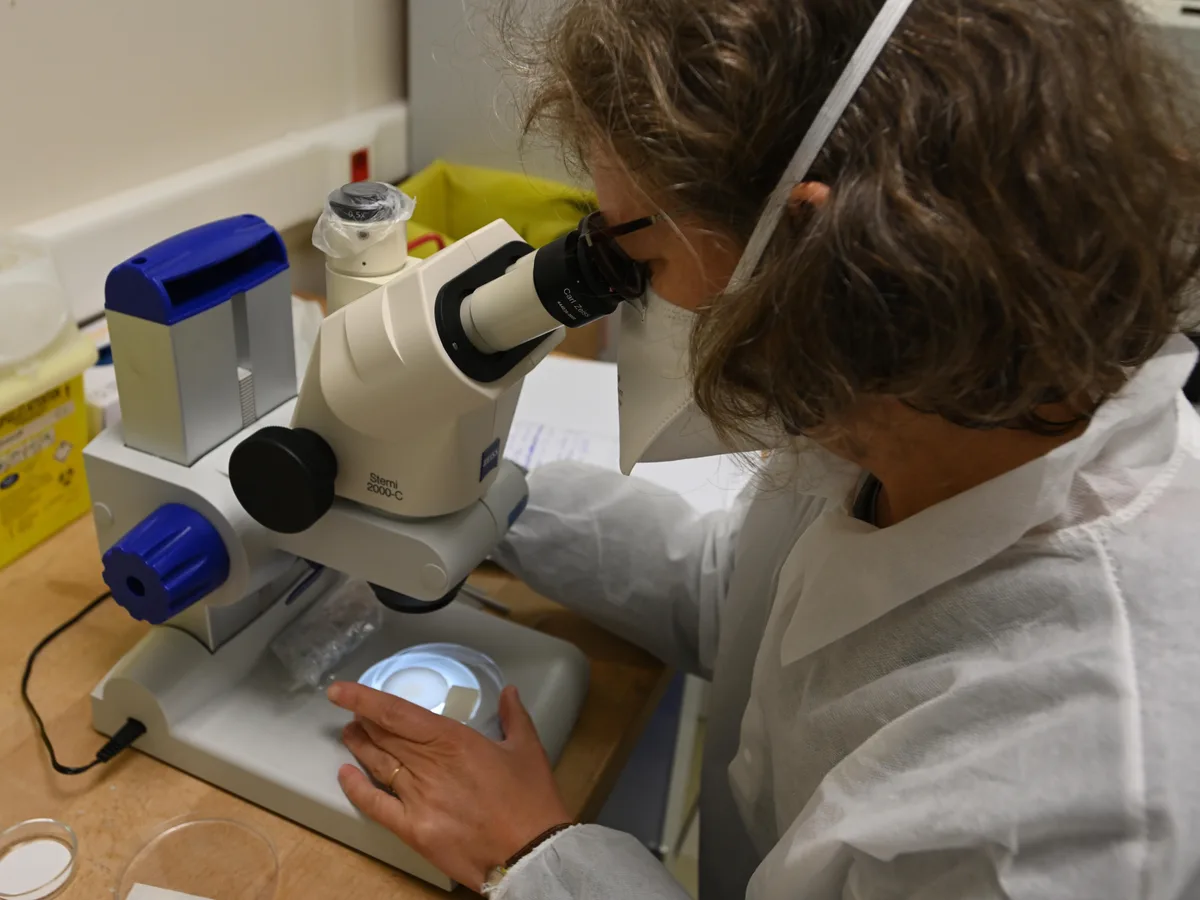
Optical microscopy is cheap but has no chemistry. In the 22-lab test, recovery averaged 76% (standard error 10%), excellent mainly above 50 µm11. In a 12-lab test, particles below 1 mm were undercounted by 20% even with best practice (level C)15.
Nile red dye binds to fat-loving (lipophilic) surfaces and makes plastic glow under a fluorescence microscope. The original protocol covers 20–1,000 µm16; the JRC/BAM study grouped staining with the less specific techniques17.
µFTIR matches an infrared spectrum per particle to a polymer library. Mid-infrared light cannot resolve detail finer than about 4–7 µm, and the routine range starts near 20 µm14; an 84-lab comparison put the limit at 10–20 µm7.
µRaman uses a visible laser and reaches about 0.5 µm14, but fluorescence from dyes, additives and matrix can swamp its spectra17. An automated 2026 workflow reached 500 nm and recovered 67 ± 10% of 500 nm test beads. It oversized particles by about 0.5 µm and needed each particle centered in the laser focus (level C)3. In potable water, only 0.36% of its 0.5–10 µm particles were plastic3.
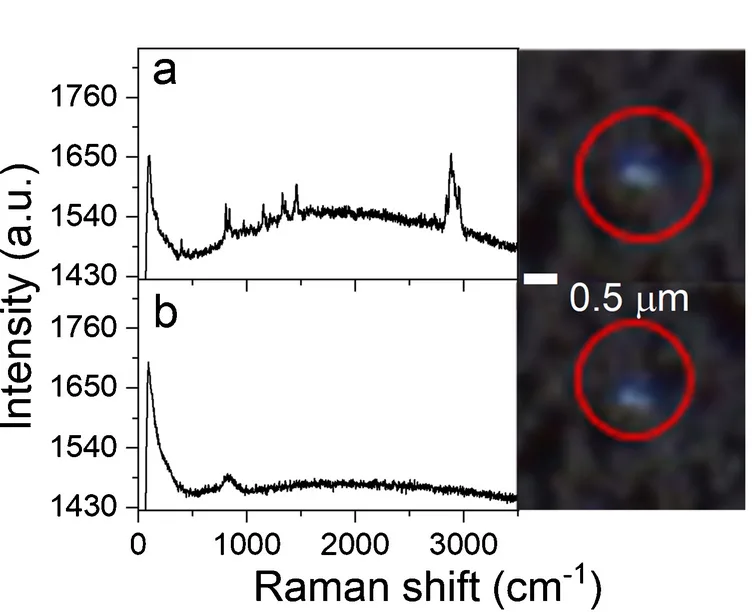
O-PTIR (optical photothermal infrared) reads infrared absorption with a visible probe beam. A 2025 tissue study reports about 500 nm lateral resolution18, and the instrument can record a Raman spectrum from the same spot14.
Weighing plastic instead of counting it
Thermoanalytical methods heat a sample and identify polymers from breakdown products, giving mass per polymer but no number, size or shape19,20. In pyrolysis GC/MS (py-GC/MS), each polymer is quantified from indicator compounds. One 2025 blood workflow used 1-eicosene for polyethylene (PE) and reached detection limits from 14 ng/mL for polypropylene (PP) to 245 ng/mL for PE (level C)21.
TED-GC/MS (thermal extraction desorption GC/MS) traps gases released from a larger sample portion before analysis19. Both weigh whatever polymer reaches the instrument: polymer-related mass in a prepared fraction. py-GC/MS has reported nanoplastic mass this way in surface water, groundwater and wastewater22,23. That label needs evidence that the signal came from particles, not dissolved polymer.
Limitation
Testing py-GC/MS on human blood, Rauert and colleagues found extraction recoveries of 7–109% and realistic detection limits up to 20 times higher than those calculated in pure water. Under their extraction and marker conditions, the method was not yet suitable for PE and polyvinyl chloride (PVC) in biological matrices (level C)24. Nardella and colleagues report a working full-scan blood workflow with 1-eicosene as the PE marker21; the two studies validated different steps.
Reaching the nanoscale
TD-PTR-MS (thermal desorption proton-transfer-reaction mass spectrometry) fingerprints polymers by their vapor, with a detection limit below 1 ng of polystyrene (PS) in 1 mL samples25. In a 2025 survey, 1.5 mL subsamples of North Atlantic seawater passed through 1.0 µm filters held polyethylene terephthalate (PET), PS and PVC but no PE or PP. Whether PE was altered, below detection or masked stayed open (level C)10.
SRS microscopy (stimulated Raman scattering) images particles fast enough to count. Its resolution is about 365 nm; Qian and colleagues detected particles down to 100 nm against a seven-polymer library and estimated sizes below 365 nm from signal strength, assuming solid spheres: a method demonstration (level C)26. Their count of about 240,000 particles per liter in 3 bottled-water brands, about 90% nanoplastics, is disputed over its blanks (level D; see the blanks dispute above)12,13.
AFM-IR reads infrared absorption under an atomic force microscope tip. A 2026 study identified single PS particles down to 80 nm and silica down to 20 nm, but throughput was too low to confirm nanoplastics in ambient air without enrichment (level C)27.
Size without chemistry. Field-flow fractionation, nanoparticle tracking analysis and dynamic light scattering size particles but cannot tell plastic from clay or protein28,19. Single-particle ICP-MS counts nanoplastics by their carbon or metal signal, so far mainly in lab tests29.
Metal-doped tracers sidestep detection in lab tests: in simulated sewage sludge, over 98% of such nanoplastics ended up in sludge, with over 93% recovered30; field particles carry no tag.
What each method can tell, and what it cannot
Data table
| label | value | unit | lower_um | plot | reports | shown_range | resolution | standard | cannot_tell | source |
|---|---|---|---|---|---|---|---|---|---|---|
| Optical microscopy | 50 | µm | 50 | bar | count, size, shape | good recovery above 50 µm (22 labs, clean water) | n/a | not alone | polymer; small, clear particles | S-039, S-037 |
| Nile red | 20 | µm | 20 | bar | count, size | 20–1,000 µm protocol | n/a | none | which polymer | S-318, S-038 |
| µFTIR | 20 | µm | 20 | bar | count, size, polymer | routine above 10–20 µm | 3.7–7.4 µm | EU from 20 µm; ISO from 1 µm | below about 10 µm; stearate look-alikes | S-319, S-326, S-291 |
| µRaman | 0.5 | µm | 0.5 | bar | count, size, polymer | routine 1–5 µm; 500 nm beads at 67% recovery, one lab | about 0.5 µm | EU from 20 µm; ISO from 1 µm | fluorescent particles; exact size near 500 nm | S-325, S-326 |
| O-PTIR | 0.5 | µm | marker | polymer, image | no recovery range reported | about 500 nm | none | shape below 500 nm; recovery | S-320 | |
| SRS microscopy | 0.1 | µm | marker | count, estimated size, 7 polymers | one demonstration, bottled water | about 365 nm; detects to 100 nm | none | shape below 365 nm; other polymers | S-033 | |
| AFM-IR | 0.08 | µm | marker | polymer per particle | test aerosols, one lab | detects 80 nm PS, 20 nm silica | none | concentrations (too slow) | S-327 | |
| py-GC/MS, TED-GC/MS | ng/mL | none | mass per polymer | size set by prior filtration; blood LOD 14–245 ng/mL | n/a | ISO 16094-3 draft, mass only | size, number, shape; particulate or not | S-043, S-042, S-041 | ||
| TD-PTR-MS | ng | none | mass per polymer | fraction through a 1.0 µm filter; LOD below 1 ng PS | n/a | none | size, number; masked PE | S-031, S-067 | ||
| FFF, NTA, DLS | nm | none | size distribution | not reported in cited reviews | n/a | none plastic-specific | whether it is plastic | S-028, S-027 | ||
| EU 2024/1441 scope | 20 | µm | 20 | reference | particles, fibers per m³ | 20 µm–5 mm | n/a | legal method | below 20 µm | S-132 |
| ISO 16094-2 scope | 1 | µm | 1 | reference | count, size, polymer | 1–5,000 µm, ten polymers | n/a | ISO standard | below 1 µm | S-040 |
Why two honest labs disagree
Size cutoffs. Small particles vastly outnumber large ones: above a lower size limit of roughly 50–350 µm, depending on the sample type, counts follow power laws; below it, measured counts fall short of the fitted line (level B)6,16,32. Across more than 60,000 particles measured by FTIR imaging, median slopes ran from 2.2 in marine surface water to 3.1 in organisms (level C)6.
Take a constructed example: one lab counts above 300 µm, another down to 1 µm, in the same water. A slope of 2.2 gives the second about 970 times more particles, a slope of 3.1 about 160,000 times (our calculation, up to 5 mm; level P). This calculation extends a fitted power law down to 1 µm; in Kooi's samples, the fit already fails below roughly 50–350 µm. The factors illustrate that assumption, not a measured increase (level E; searched S-314, S-313, S-026, S-027 and S-028, 3 November 2026).
Same water, different cutoff: modeled count relative to a 300 µm cutoff
How this was calculated
Our calculation. Count between the cutoff L and 5,000 µm, proportional to L^(1−α) − 5000^(1−α), with α = 2.2 (median, marine surface water) and α = 3.1 (median, biota) from Kooi et al. 2021. Model, labeled 'model'; extrapolation below the fitted lower limit (roughly 50–350 µm, sample-type dependent; Kooi et al. 2021) is not established, so the 100 µm point and all smaller cutoffs are marked extrapolated. No laboratory icons: the comparison is a constructed example.
Data table
| label | value | unit | cutoff_um | value_slope_3_1 | extrapolated |
|---|---|---|---|---|---|
| 300 µm | 1 | × count at 300 µm | 300 | 1 | false |
| 100 µm | 3.8 | × count at 300 µm | 100 | 10 | true |
| 20 µm | 27 | × count at 300 µm | 20 | 296 | true |
| 10 µm | 61 | × count at 300 µm | 10 | 1268 | true |
| 1 µm | 972 | × count at 300 µm | 1 | 159638 | true |
Count versus mass. One 1 mm PE sphere weighs about 0.5 mg, as much as a trillion 100 nm spheres (our calculation, density 0.95 g/cm³; level P); see How to Read the Numbers.
Sample volume. The EU method samples at least 1,000 liters and must analyze at least 10% of the recovered material, so at least 100 liters1. The North Atlantic survey collected 2 liters and analyzed 1.5 mL subsamples10: about 67,000 times less analyzed volume (our calculation; level P). Each stray particle weighs more in a small portion.
Method
Same sample, many answers: a real test. In 2025, 84 laboratories registered to receive identical tablets of PET and aged PE particles of about 10–200 µm, and 56 reported results. All that reported identified both polymers; reproducibility standard deviations, in percent of the reference value, were 62–117% (PE) and 46–62% (PET) with thermal methods and 121–129% and 64–70% with spectroscopy. Dissolving and filtering the tablets was one of the most critical steps (level C)7.
Between-lab spread. In the JRC/BAM comparison, 98 datasets on one PET-in-water sample spread almost evenly between the lowest and highest values. Libraries, match thresholds and data treatment varied strongly, and only 69% of labs reporting counts said how they sized particles17. A 2026 comparison across seven countries with shared protocols found identification accuracy from 54% to 93% and PE recovery from below 5% to above 130%33. Large spread recurs across exercises (level B)15,11,7.
Look-alikes. Leachates of 10 glove types read as PE under µRaman, µFTIR and py-GC/MS, because stearates and fatty acids share PE's long hydrocarbon chains (level B)31,4. Biological matrices can also yield common py-GC/MS markers for PE and PVC21,24. A 2026 framework asks for two orthogonal techniques before plastic is reported in human samples34.
How far this affects brain-tissue figures is disputed (level D). Monikh, Materić and colleagues argue that the 2025 brain study lacked adequate contamination controls and validation, and that undigested lipids can inflate the PE signal35. Campen and colleagues reply that the lipid comparison mixes dry- and wet-weight percentages, that polymers without known lipid interference rose over time too, and that procedural blanks held no detectable polymer36,37.
They concede that tissue digestion has no agreed method and that alkaline digestion may overestimate polymer content37. We read only the reply's opening paragraph, which acknowledges uncertainty "in even the best current methods"36; the points above follow a 2026 paper's summary37. For health questions, see Human Body.
Standards cover microplastics in clean water, not nanoplastics
ISO/TR 21960:2020 summarizes the state of knowledge, ISO 24187:2023 sets principles for microplastic analysis38,39, and
ISO 16094-2:2025 covers drinking water and other low-solids water by microscopy and vibrational spectroscopy, sizing and counting particles of 1–5,000 µm and identifying ten named polymers2. Its thermo-analytical sister, ISO 16094-3, gives polymer mass without a size range. Its final draft (FDIS) went to ballot on 15 September 2026, and it was not published when we checked on 3 November 202640,20.
ASTM D8332-20 and D8333-20 cover collecting and preparing water samples for Raman, infrared or py-GC/MS41,42. Legal status is on Policy and Regulation.
Quality criteria came first: biota studies scored an average reliability of 0 on ten criteria43. A 2019 review found only 4 of 50 freshwater and drinking-water studies meeting every criterion (level B)5. In 2021 the JRC/BAM report named the missing tools: method validation, reference materials and proficiency testing17.
Of the plastic-specific documents listed here (ISO 16094-2 and -3, ISO 24187, ISO/TR 21960, ASTM D8332 and D8333, EU 2024/1441), none sizes and counts plastic below 1 µm (level P; checked 3 November 2026). General nanoparticle-sizing standards, which do not identify polymers, were not searched. See Knowledge Gaps.
Questions
Can any lab measure nanoplastics routinely?
If gloves and lipids create false positives, are microplastic findings wrong?
Why not convert particle counts into grams?
It needs assumed size, shape and density distributions. Koelmans and colleagues published such a conversion; its output is an estimate, not a measurement (level B,32).
Where to go next
Size classes are defined on What Is Nanoplastic. How to Read the Numbers turns these limits into questions for any headline, and Landmark Studies shows which instruments produced the best-known results.
Sources
- European Commission (2024). Commission Delegated Decision (EU) 2024/1441 of 11 March 2024 supplementing Directive (EU) 2020/2184 by laying down a methodology to measure microplastics in water intended for human consumption. Official Journal of the European Union. eur-lex.europa.eu/eli/dec_del/2024/1441/oj web open access
- ISO/TC 147/SC 2 (2025). ISO 16094-2:2025 Water quality — Analysis of microplastic in water — Part 2: Vibrational spectroscopy methods for waters with low content of suspended solids including drinking water. International Organization for Standardization. www.iso.org/standard/84460.html standard
- Jüngling IS, Schmitt L, De Franceschi F, Da Costa Filho PA, Lei L, Coic L et al. (2026). Challenges and solutions in the analysis of micro- and nanoplastics down to 500 nm with automated Raman microspectroscopy: suitable filters, accuracy in the detection, identification, and quantification. Analytical and Bioanalytical Chemistry 418:5283–5302. doi:10.1007/s00216-026-06567-2 journal article open access
- Clough ME, Ochoa Rivera E, Ayala AM, Parham RL, Pennacchio J, Thurber HE et al. (2026). Avoiding and reducing microplastic false positives from dry glove contact. Analytical Methods 18:2914–2926. doi:10.1039/d5ay01801c journal article open access
- Koelmans AA, Mohamed Nor NH, Hermsen E, Kooi M, Mintenig SM, De France J (2019). Microplastics in freshwaters and drinking water: Critical review and assessment of data quality. Water Research. doi:10.1016/j.watres.2019.02.054 review
- Kooi M, Primpke S, Mintenig SM, Lorenz C, Gerdts G, Koelmans AA (2021). Characterizing the multidimensionality of microplastics across environmental compartments. Water Research 202:117429. doi:10.1016/j.watres.2021.117429 journal article open access
- Ciornii D, Hodoroaba V-D, Benismail N, Maltseva A, Ferrer JF, et al. et al. (2025). Interlaboratory Comparison Reveals State of the Art in Microplastic Detection and Quantification Methods. Analytical Chemistry 97(16):8719–8728. doi:10.1021/acs.analchem.4c05403 journal article open access
- Brander SM, Renick VC, Foley MM, Steele C, Woo M, Lusher A et al. (2020). Sampling and Quality Assurance and Quality Control: A Guide for Scientists Investigating the Occurrence of Microplastics Across Matrices. Applied Spectroscopy 74:1099–1125. doi:10.1177/0003702820945713 review
- Cowger W, Booth AM, Hamilton BM, Thaysen C, Primpke S, Munno K et al. (2020). Reporting Guidelines to Increase the Reproducibility and Comparability of Research on Microplastics. Applied Spectroscopy. doi:10.1177/0003702820930292 journal article open access
- ten Hietbrink S, Materić D, Holzinger R, Groeskamp S, Niemann H (2025). Nanoplastic concentrations across the North Atlantic. Nature. doi:10.1038/s41586-025-09218-1 journal article
- De Frond H, Thornton Hampton L, Kotar S, Gesulga K, Matuch C, Lao W et al. (2022). Monitoring microplastics in drinking water: An interlaboratory study to inform effective methods for quantifying and characterizing microplastics. Chemosphere. doi:10.1016/j.chemosphere.2022.134282 journal article
- Materić D (2024). Nanoplastics measurements must have appropriate blanks. Proceedings of the National Academy of Sciences 121(48). doi:10.1073/pnas.2411099121 journal article open access
- Qian N, Stapleton P, Yan B, Min W (2024). Reply to Materić: Appropriate blanks should avoid major contamination sources in the lab. Proceedings of the National Academy of Sciences 121(48). doi:10.1073/pnas.2415874121 journal article open access
- Böke JS, Popp J, Krafft C (2022). Optical photothermal infrared spectroscopy with simultaneously acquired Raman spectroscopy for two-dimensional microplastic identification. Scientific Reports 12:18785. doi:10.1038/s41598-022-23318-2 journal article open access
- Isobe A, Buenaventura NT, Chastain S, Chavanich S, Cózar A, DeLorenzo M et al. (2019). An interlaboratory comparison exercise for the determination of microplastics in standard sample bottles. Marine Pollution Bulletin. doi:10.1016/j.marpolbul.2019.07.033 journal article
- Erni-Cassola G, Gibson MI, Thompson RC, Christie-Oleza JA (2017). Lost, but Found with Nile Red: A Novel Method for Detecting and Quantifying Small Microplastics (1 mm to 20 μm) in Environmental Samples. Environmental Science & Technology 51:13641–13648. doi:10.1021/acs.est.7b04512 journal article
- Cella C, Emteborg H, Belz S, Bianchi I, Fumagalli FS, Geiss O et al. (2021). Current status of the quantification of microplastics in water: Results of a JRC/BAM interlaboratory comparison study on PET in water. Publications Office of the European Union (JRC Technical Report, EUR 30799 EN). doi:10.2760/6228 report open access
- Gruber ES, Karl V, Duswald K, Bhamidipalli MS, Schlederer M, Limberger T et al. (2025). Method for label-free & non-destructive detection of microplastics in human formalin-fixed paraffin-embedded tissue sections. Scientific Reports 15:42637. doi:10.1038/s41598-025-26751-1 journal article open access
- Ivleva NP (2021). Chemical Analysis of Microplastics and Nanoplastics: Challenges, Advanced Methods, and Perspectives. Chemical Reviews. doi:10.1021/acs.chemrev.1c00178 review
- ISO/TC 147/SC 2 (2026). ISO/FDIS 16094-3 Water quality — Analysis of microplastic in water — Part 3: Thermo-analytical methods. International Organization for Standardization. www.iso.org/standard/84463.html standard
- Nardella F, Brits M, van Velzen MJM, Scibetta L, Durkin A, Vermeulen R et al. (2025). Advancing pyrolysis-gas chromatography-mass spectrometry for the accurate quantification of micro- and nanoplastics in human blood. Microplastics and Nanoplastics. doi:10.1186/s43591-025-00152-7 journal article open access
- Xu Y, Ou Q, Jiao M, Liu G, van der Hoek JP (2022). Identification and Quantification of Nanoplastics in Surface Water and Groundwater by Pyrolysis Gas Chromatography–Mass Spectrometry. Environmental Science & Technology. doi:10.1021/acs.est.1c07377 journal article
- Okoffo ED, Thomas KV (2024). Mass quantification of nanoplastics at wastewater treatment plants by pyrolysis–gas chromatography–mass spectrometry. Water Research. doi:10.1016/j.watres.2024.121397 journal article
- Rauert C, Charlton N, Bagley A, Dunlop SA, Symeonides C, Thomas KV (2025). Assessing the Efficacy of Pyrolysis–Gas Chromatography–Mass Spectrometry for Nanoplastic and Microplastic Analysis in Human Blood. Environmental Science & Technology. doi:10.1021/acs.est.4c12599 journal article open access
- Materić D, Kasper-Giebl A, Kau D, Anten M, Greilinger M, Ludewig E et al. (2020). Micro- and Nanoplastics in Alpine Snow: A New Method for Chemical Identification and (Semi)Quantification in the Nanogram Range. Environmental Science & Technology. doi:10.1021/acs.est.9b07540 journal article
- Qian N, Gao X, Lang X, Deng H, Bratu TM, Chen Q et al. (2024). Rapid single-particle chemical imaging of nanoplastics by SRS microscopy. Proceedings of the National Academy of Sciences. doi:10.1073/pnas.2300582121 journal article
- Kummer N, Horender S, Kulmala T, Vasilatou K, Hueglin C, Kaegi R (2026). Possibilities and limitations of AFM-IR to detect nanoplastic particles in the atmosphere. Environmental Science: Nano 13(4):1910–1925. doi:10.1039/d5en01155h journal article open access
- Schwaferts C, Niessner R, Elsner M, Ivleva NP (2019). Methods for the analysis of submicrometer- and nanoplastic particles in the environment. TrAC Trends in Analytical Chemistry. doi:10.1016/j.trac.2018.12.014 review
- Jiménez-Lamana J, Marigliano L, Allouche J, Grassl B, Szpunar J, Reynaud S (2020). A Novel Strategy for the Detection and Quantification of Nanoplastics by Single Particle Inductively Coupled Plasma Mass Spectrometry (ICP-MS). Analytical Chemistry. doi:10.1021/acs.analchem.0c01536 journal article
- Mitrano DM, Beltzung A, Frehland S, Schmiedgruber M, Cingolani A, Schmidt F (2019). Synthesis of metal-doped nanoplastics and their utility to investigate fate and behaviour in complex environmental systems. Nature Nanotechnology 14:362–368. doi:10.1038/s41565-018-0360-3 journal article
- Witzig CS, Földi C, Wörle K, Habermehl P, Pittroff M, Müller YK et al. (2020). When Good Intentions Go Bad—False Positive Microplastic Detection Caused by Disposable Gloves. Environmental Science & Technology 54:12164-12172. doi:10.1021/acs.est.0c03742 journal article
- Koelmans AA, Redondo-Hasselerharm PE, Mohamed Nor NH, Kooi M (2020). Solving the Nonalignment of Methods and Approaches Used in Microplastic Research to Consistently Characterize Risk. Environmental Science & Technology 54:12307–12315. doi:10.1021/acs.est.0c02982 journal article open access
- Graf M, Chadwick D, Sun Y, Ding F, Ren S, et al. (2026). Instrument-dependent variability affects both microplastic polymer identification and quantification: an inter-laboratory comparison using polymer standards. Scientific Reports 16:34427. doi:10.1038/s41598-026-64477-w journal article open access
- Thomas KV, Belz S, Booth AM, Clift MJD, Cross RK, Davies G et al. (2026). Communicating Confidence in the Reliability of Micro- and Nanoplastic Identification in Human Health Studies. Environment & Health. doi:10.1021/envhealth.5c00671 journal article
- Abdolahpur Monikh F, Materić D, Valsami-Jones E, Grossart HP, Altmann K, Holzinger R et al. (2025). Challenges in studying microplastics in human brain. Nature Medicine. doi:10.1038/s41591-025-04045-3 journal article
- Campen MJ, West AB, Garcia M, Gullapalli R, El Hayek E (2025). Reply to: Challenges in studying microplastics in human brain. Nature Medicine. doi:10.1038/s41591-025-04046-2 journal article
- Viola, Makdissi, Musacchio, Aliprandi, Franco Taveras, Mayer et al. (2026). Healthy mice show resilience to chronic nano- and microplastic exposure in the brain. Frontiers in Immunology 17:1917614. doi:10.3389/fimmu.2026.1917614 journal article open access
- ISO/TC 61/SC 14 (2020). ISO/TR 21960:2020 Plastics — Environmental aspects — State of knowledge and methodologies. International Organization for Standardization. www.iso.org/standard/72300.html standard
- ISO/TC 61/SC 14 (2023). ISO 24187:2023 Principles for the analysis of microplastics present in the environment. International Organization for Standardization. www.iso.org/standard/78033.html standard
- Institute for Standardization of Serbia (national listing of ISO/TC 147/SC 2 project) (2026). ISO/FDIS 16094-3 Water quality — Analysis of microplastic in water — Part 3: Thermo-analytical methods for waters with low content of suspended solids including drinking water (project record iso:proj:84463). Institute for Standardization of Serbia. iss.rs/en/project/show/iso:proj:84463 web open access
- ASTM International, Committee D19 (2020). ASTM D8332-20 Standard Practice for Collection of Water Samples with High, Medium, or Low Suspended Solids for Identification and Quantification of Microplastic Particles and Fibers. ASTM International. store.astm.org/d8332-20.html standard
- ASTM International, Committee D19 (2020). ASTM D8333-20 Standard Practice for Preparation of Water Samples with High, Medium, or Low Suspended Solids for Identification and Quantification of Microplastic Particles and Fibers Using Raman Spectroscopy, IR Spectroscopy, or Pyrolysis-GC/MS. ASTM International. store.astm.org/d8333-20.html standard
- Hermsen E, Mintenig SM, Besseling E, Koelmans AA (2018). Quality Criteria for the Analysis of Microplastic in Biota Samples: A Critical Review. Environmental Science & Technology 52:10230–10240. doi:10.1021/acs.est.8b01611 review
Evidence levels and provenance
- AConsensus
- Multiple independent studies or a systematic review plus a statement by a scientific body.
- BWell supportedUsed on this page
- Several independent studies with concordant findings.
- CLimitedUsed on this page
- Few studies, narrow conditions, or methodological caveats.
- DDisputedUsed on this page
- Conflicting results; both sides are shown.
- EUnknownUsed on this page
- No reliable evidence found; the search scope is stated.
- PProvenanceUsed on this page
- Provenance: checked against the primary record. A separate category, not an evidence grade: used for bibliographic facts, legal texts, official metadata, definitions quoted from a standard, the site's own arithmetic and statements about the site's process.
Editorial categories of this site. A–E grade scientific findings, per claim, with a one-line rationale; D and E are not lower rungs of the A–C scale. P is not a grade: it marks facts checked against their primary record.