THE FASTEST PATHWAY
Atmosphere
Microplastics fall with rain, snow and dust on cities, protected parks, mountain summits and polar ice. How much the world emits into the air is disputed: in 2026 a comparison with 2,782 measurements found that three emission inventories overestimated measured airborne concentrations and deposition by a factor of 100 to 10,000.
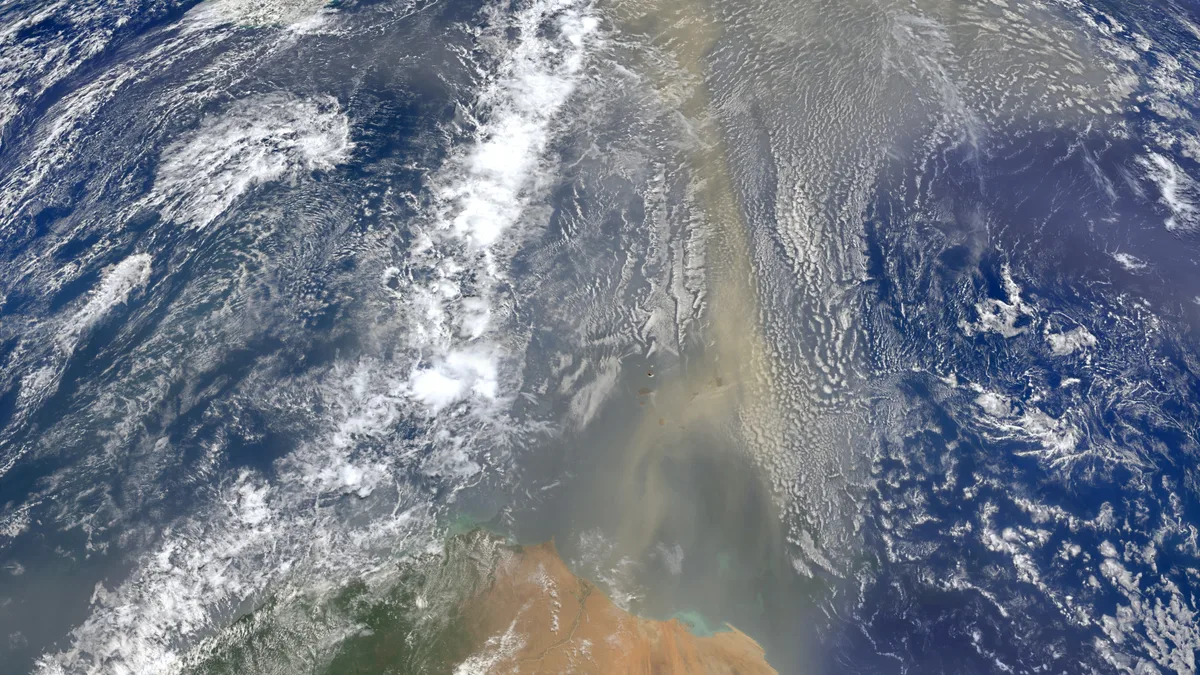
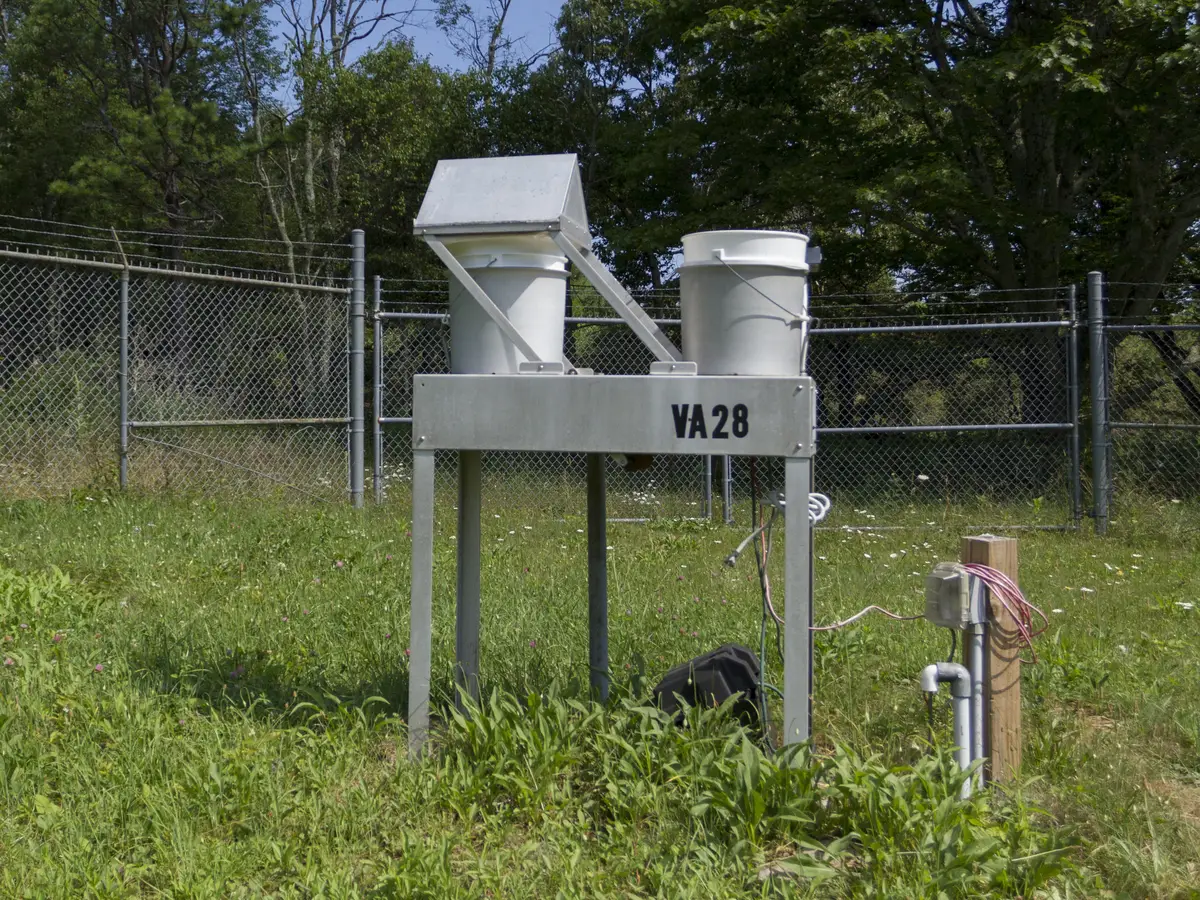
Plastic falls out of the sky. Collectors at 11 western US national parks and wilderness areas averaged 132 microplastic particles per square meter per day (level C)1. The authors extrapolated this to more than 1,000 metric tons a year on protected land in that region1. How much the planet sends into the air is disputed. In January 2026 a Vienna team found that three emission inventories overestimated the medians of 2,782 measurements by a factor of 100 to 10,000 (level C)2.
≈0.08 particles/m³
median microplastic concentration in outdoor air over land
concentration in air; from the 925 concentration measurements among 2,782 compiled (the rest are deposition), 76 studies, 283 locations, 2014–2024; coastal sites excluded; sizes from several µm up; mostly µ-Raman and µ-FTIR2
one compilation of heterogeneous methods; across all sites the mean (31 particles/m³) is about a thousand times the overall median (0.03)
CLimited100–10,000×
how far three emission inventories, run through one transport model, overestimated measured airborne plastic
global median concentrations and deposition; model output aligned to each study's size range, 5–100 µm; Evangelou et al. 20262
single analysis; outside experts question how comparable the compiled measurements are
CLimited≈4,500 t vs ≈1 Mt
two 2026 estimates of global microplastic emissions into the air per year
estimates, not measurements: 0.0045 Tg/yr for 5–100 µm (Nature, peer reviewed) vs 1,001 ± 781 Gg/yr for 5–250 µm (preprint, not yet peer reviewed)2,3
a disagreement of more than two orders of magnitude, partly from different size ranges; the preprint was under review for Atmospheric Chemistry and Physics on 3 November 2026
DDisputed>1,000 t/yr
microplastic deposited on protected lands in the western US
deposition onto the ground; 11 network sites sampled over 14 months (as described in the companion 2021 paper); mass extrapolated from particle counts of about 4 µm and larger1,4
CLimited2,238 particles/m³
median microplastic concentration in car cabin air
concentration in air; particles 1–10 µm; two cars, five samples, southern France; Raman spectroscopy; Yakovenko et al. 20255
small sample; homes in the same study had a median of 528 particles/m³
CLimitedTwo kinds of numbers: in the air and on the ground
Airborne plastic is reported in two ways that are easy to mix up. A concentration counts particles suspended in a cubic meter of air, sampled by pumping air through a filter. A deposition rate counts particles that settle onto a square meter of surface per day, caught in a funnel or a bucket that collects rain, snow and dry fallout. Wet deposition comes down with precipitation; dry deposition settles on its own.
The largest compilation so far, by Ioanna Evangelou, Silvia Bucci and Andreas Stohl at the University of Vienna, gathered 925 concentration and 1,857 deposition measurements made between 2014 and 2024 (level P)2. The median concentration was 0.03 particles/m³ across all sites, 0.08 over land and 0.003 over the open sea, 27 times lower (level C)2. The median bulk deposition over land was 0.0006 particles/m² per second, or about 50 particles/m² per day (our conversion from2).
Single sites vary more. Along the southeast coast of China, reported concentrations range from 0.004 to 190 particles/m³ (level C)2. Reported deposition runs from 50 particles/m²/day in a Chinese suburb to 3,100 at a British urban site2. The global mean concentration, 31 particles/m³, is a thousand times the overall median of 0.03, because a few studies report very high values2.
Size limits drive much of this spread. Most compiled studies identified polymers by µ-Raman or µ-FTIR spectroscopy and reported particles from several micrometers to several millimeters2. Particles smaller than a few micrometers are usually not counted, although particle numbers rise steeply as size falls5,6.
Land leads by particle number; the mass split is disputed
Several independent studies find road traffic a major source of airborne plastic over land, at least near roads, in cities and in western US deposition (level B)4,7,8. A 2026 global inversion by Ondřej Tichý and colleagues, still a preprint, ranks road dust, at 51 ± 31 Gg a year, below agriculture at 170 ± 125 Gg (preprint estimate, level C)3.
Janice Brahney and colleagues fitted a transport model to western US deposition data. It attributed 84% of deposited microplastic to roads, 11% to the ocean and 5% to agricultural dust (model estimate, level C)4. Tire and road wear particles were rare in their samples: in their reading, roads mainly resuspend plastic from many products after traffic grinds it down4.
Studies that target tire rubber chemically, by pyrolysis gas chromatography with mass spectrometry (py-GC/MS), give a different picture. At a roadside in Leipzig in September 2022, tire wear made up about 65% of the plastic mass in particles below 10 µm (level C)7. In Oslo, tire wear particles accounted for more than 90% of airborne microplastic mass (level C)8. These studies count tire wear as plastic; the spectroscopy-based western US samples rarely identified it4.
Textiles shed fibers into air. In Paris fallout, Rachid Dris and colleagues found about 29% of fibers synthetic or mixed (level C)9. They estimated that 3 to 10 metric tons of fibers settle on the Paris area each year9.
The ocean's role is disputed (level D). Two earlier models fitted to western US deposition data made sea spray the largest source by mass. Brahney's put the ocean at about 8.6 million metric tons (8.6 Tg) a year, 95% range 0 to 224. An inversion by Nikolaos Evangeliou and colleagues put it at 8.9 ± 3.5 Tg of a 9.6 ± 3.6 Tg total (estimates, level C)10.
Newer models disagree in both directions. A 2025 global model made the ocean about 0.008% of emissions but about 15% of deposition, mainly a sink (estimate, level C)11. The Tichý preprint counters that oceanic emissions are "likely non-negligible": 763 ± 611 of its 1,001 Gg a year3.
Method
Is tire wear counted as plastic? It depends on what a study looks for. The studies cited here that targeted tire polymers counted it: py-GC/MS in Leipzig and Oslo air and over the Norwegian Sea, TD-PTR-MS in Greenland firn7,8,12,13. Detection depends on the target compounds, calibration and sample treatment, not on the instrument family alone. FTIR imaging of snow listed rubber among the main polymers6. Most surveys compiled in 2026 used µ-Raman or µ-FTIR, while the bottom-up inventory tested there combines traffic wear (tire, brake, road markings, road surface) with ocean and bare-soil emissions2. Measurements and models may therefore not count the same particles.
Hours to days aloft, as far as the poles
In the Brahney model, particles of about 4 µm and larger stayed up from one hour to 6.5 days (model estimate, level C)4. The authors suggest smaller particles could stay up for weeks4. In the Vienna model, removal from the air was dominated by settling under gravity rather than by rain2.
That is enough to reach remote places: several independent studies find microplastics deposited at remote mountain, Arctic and polar sites far from local sources (level B)14,6,15,13,16. At Bernadouze in the French Pyrenees, Steve Allen and colleagues measured deposition of about 365 particles/m²/day (5 µm and larger) from November 2017 to March 2018 (level C)14. Air-mass trajectories indicated transport over up to 95 km; the authors note that their data cannot prove long-range transport14.
At the Pic du Midi Observatory (2,877 m), also in the Pyrenees, pumped air from the free troposphere held 0.09–0.66 particles/m³ from June to October 2017 (concentration, µ-Raman, level C)16. Back-trajectories crossed the Atlantic and the Mediterranean, which the authors read as intercontinental and transoceanic transport16.
Snow from the Alps to the Fram Strait held microplastics, with Arctic samples reaching 14,400 particles per liter at 11 µm and above (FTIR imaging, level C)6. Cloud water on Japanese summits from 1,300 to 3,776 m held 6.7 to 13.9 particles per liter, sized 7.1–94.6 µm (level C)17.
Over the Norwegian Sea up to Bear Island, py-GC/MS found up to 37.5 ng/m³ of microplastic in air, with tire wear reaching 35 ng/m³ (level C)12. On Ross Island, Antarctica, snow at all 19 sites sampled in late 2019 held microplastics, about 29 particles per liter of meltwater at 50 µm and above (µFTIR, level C)18. Back-trajectories allow transport of up to 6,000 km, but nearby research stations are a possible local source18.
How much reaches the ocean from the air is a model question. A 2020 simulation estimated that about 100,000 metric tons of tire wear particles a year are deposited in the world ocean (estimate, level C)19. From the few marine deposition measurements, all near coasts, Evangelou and colleagues infer that most suspended microplastic settles close to its land sources2.
Models versus measurements: the 2026 correction
Evangelou, Bucci and Stohl ran three published emission inventories through the FLEXPART transport model, matching each simulated value to the size range of its measurement2. All three overestimated the global median concentrations and deposition by two to four orders of magnitude (level C)2. Over land, simulated median concentrations were 105 to 1,506 particles/m³, against a measured 0.08 (level C)2. Before scaling, even the best correlation with measured concentrations was weak (r = 0.33)2.
With data too sparse for an inversion, two global factors cut land emissions to 0.13% of the bottom-up inventory and raised ocean emissions 3.6 times2. The scaled total is 0.0045 Tg (range 0.0006–0.0089), about 4,500 metric tons a year for 5–100 µm (estimate, level C)2. Land emits over 20 times more particles than the ocean, but the ocean emits more mass, about 4,000 against 500 t a year (estimate, level C)2. That split rests on assumed emission size distributions2.
The emission magnitude is disputed (level D). Soroush Abolfathi (University of Warwick) called the study careful but warned that size cut-offs and mass-to-number conversions can shift results by orders of magnitude20. Richard Lampitt (National Oceanography Centre) argued that the compiled techniques differ too much to compare and that model inputs often come from chains of other models20. Isidro Pérez (University of Valladolid) cited measurements spread over years of changing emissions, sparse sites and an outlier-sensitive correlation coefficient21.
The Tichý preprint is a testable alternative, not a midpoint: fitted to remote deposition data, it estimates about 1 Mt a year for 5–250 µm3. On 3 November 2026 it was under review for Atmospheric Chemistry and Physics, with public discussion open until 11 November (level P)3.
By our comparison, Brahney's extrapolation puts more than 1,000 t a year onto western US protected lands1, twice the scaled model's 500 t a year for all land emissions worldwide2. It is not like for like. Land deposition also receives plastic from the sea and particles lifted again after settling, and the size windows differ (counts from about 4 µm converted to mass, against 5–100 µm). This is a diagnostic to explain, not a refutation of either study.
Estimate
Every global emission figure on this page is a model estimate, not a measurement. The published values span more than three orders of magnitude, from about 9.6 Tg a year10 to 0.0045 Tg a year2, and each covers a different size range. The named air presets behind this site's home counters are explained on Flows & Model.
Indoor air and what we breathe
People in industrialized countries spend about 90% of their time indoors5. Small studies report more plastic indoors than outdoors. In the Paris area, Dris and colleagues counted 1.0–60.0 fibers/m³ in two apartments and an office, against 0.3–1.5 fibers/m³ outdoors; about a third of the indoor fibers were petrochemical (level C)22.
Smaller particles change the scale. Nadiia Yakovenko and colleagues sampled three apartments and two cars in southern France, identifying particles of 1–10 µm by Raman spectroscopy (level C)5. Median concentrations were 528 particles/m³ in homes and 2,238 in car cabins; 94% of particles were smaller than 10 µm5. Combining these with published data, they estimate that an adult inhales about 68,000 particles of 1–10 µm a day indoors, 100 times earlier estimates extrapolated from larger sizes (estimate, level C)5.
By mass, the Leipzig study estimated an inhaled dose of about 2.1 µg of airborne plastic a day for someone breathing that roadside air (estimate, level C)7. The WHO concluded in 2022 that inhalation exposure data were too limited for a human risk assessment23. What inhaled particles do in the body is covered on Human Body; filtration indoors is covered on Solutions by System.
What is uncertain about nanoplastics in air
For nanoplastics below 1 µm, the airborne record is close to empty. We found no peer-reviewed, size-resolved number concentrations of nanoplastics below 1 µm in outdoor air (level E). Search scope: this site's registry, Crossref and web search, papers from 2019–2026 on "airborne nanoplastics", "atmospheric nanoplastics" and "TD-PTR-MS air", November 2026. The models in the 2026 comparison stop at 5 µm, and the compiled measurements start at several micrometers2.
The nanoplastic evidence comes from snow and ice. Dušan Materić and colleagues used thermal desorption proton transfer reaction mass spectrometry (TD-PTR-MS) to find PET nanoplastics in Alpine snow (level C)24.
At the Sonnblick Observatory, 3,106 m up in the Austrian Alps, surface snow in 2017 held on average 46.5 ng/mL, implying deposition of about 42 kg per km² a year (level C)15. Greenland firn averaged 13.2 ng/mL and Antarctic sea ice 52.3 ng/mL, with tire wear nanoparticles identified in Greenland (level C)13. The sea-ice value does not show whether the particles arrived by air or from seawater.
These are masses, not counts or sizes. The Leipzig study reports a fine fraction by mass, not resolved below 1 µm7. Sub-micrometer estimates in the indoor study are extrapolations from a size distribution, not measurements5.
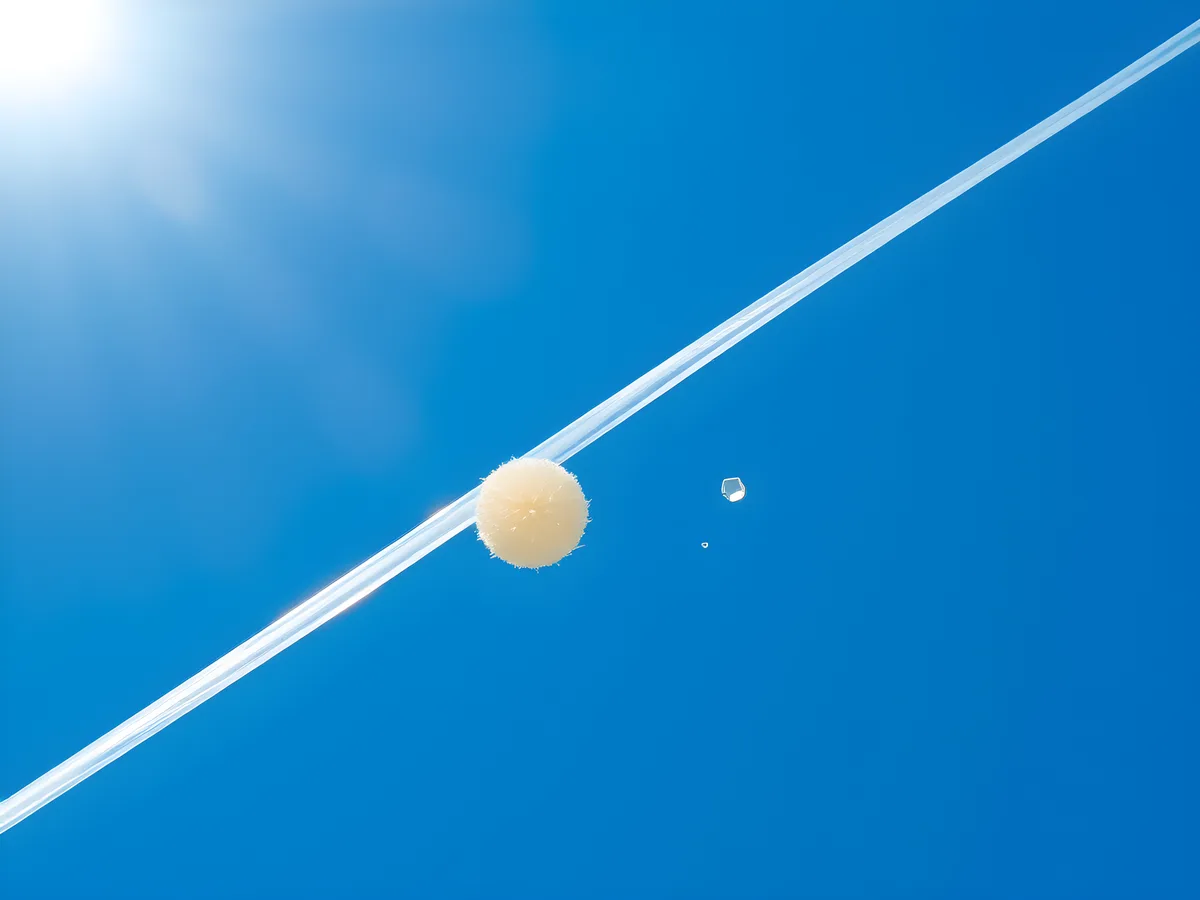 Illustration
Measured vs modeled microplastic concentrations in air, global medians
Data table
| label | value | unit | kind | scope |
|---|---|---|---|---|
| Over land, measured median | 0.08 | particles/m³ | measurement | 2014–2024, coastal sites excluded |
| Over land, model (TD-B inventory) | 105 | particles/m³ | model estimate | lowest of three inventories over land; TD-B is the Brahney et al. 2021 top-down estimate |
| Over land, model (TD-E inventory) | 1506 | particles/m³ | model estimate | highest of three inventories over land; TD-E is the Evangeliou et al. 2022 top-down estimate |
| Over ocean, measured median | 0.003 | particles/m³ | measurement | 2014–2024, open ocean |
| Over ocean, model (lowest inventory) | 0.2 | particles/m³ | model estimate | range across three inventories |
| Over ocean, model (highest inventory) | 13.9 | particles/m³ | model estimate | range across three inventories |
Global microplastic emissions into the air: published estimates
Data table
| label | value | unit | size_range | basis | source |
|---|---|---|---|---|---|
| Evangeliou et al. 2022, top-down inversion | 9.6 | Tg/yr | microplastics up to 250 µm | total of all sources; western US deposition data, global extrapolation; ocean 8.9 ± 3.5 of the 9.6 ± 3.6; microfibers (6.5 ± 2.9 Tg/yr) estimated separately and not included | S-199 |
| Brahney et al. 2021, ocean source only | 8.6 | Tg/yr | model bins 0.3–70 µm; observations 4–250 µm | ocean term only, 95% range 0–22, not a total; western US deposition data, global extrapolation; roads (0.096) and agricultural dust (0.069) add about 2% | S-050 |
| Tichý et al. 2026, preprint | 1 | Tg/yr | 5–250 µm | remote deposition data, Bayesian inversion; not peer reviewed; under review for Atmospheric Chemistry and Physics on 3 November 2026 | S-198 |
| Fu et al. 2023, GEOS-Chem | 0.32 | Tg/yr | 0.3–70 µm | second-hand: as reported in Evangelou et al. 2026; the primary paper was not checked by this site | S-052 |
| Evangelou et al. 2026, scaled | 0.0045 | Tg/yr | 5–100 µm | 2,782 measurements, two global scaling factors; 90% confidence interval 0.0006–0.0089 | S-052 |
Airborne plastic indoors and outdoors: what each study counted
Data table
| label | value | unit | statistic | size_range | place | source | low |
|---|---|---|---|---|---|---|---|
| Outdoor air over land, global median | 0.08 | particles/m³ | median | several µm and larger | 283 locations worldwide, 2014–2024 | S-052 | |
| Outdoor air, Paris area (all fibers) | 1.5 | fibers/m³ | range; value is the high end | fibers, natural and synthetic | one outdoor site, published 2017 | S-203 | 0.3 |
| Indoor air, Paris area (all fibers) | 60 | fibers/m³ | range; value is the high end | fibers; about one-third petrochemical | two apartments and one office | S-203 | 1 |
| Homes, median | 528 | particles/m³ | median | 1–10 µm, Raman | three apartments, Toulouse, seven samples | S-063 | |
| Car cabins, median | 2238 | particles/m³ | median | 1–10 µm, Raman | two cars, southern France, five samples | S-063 |
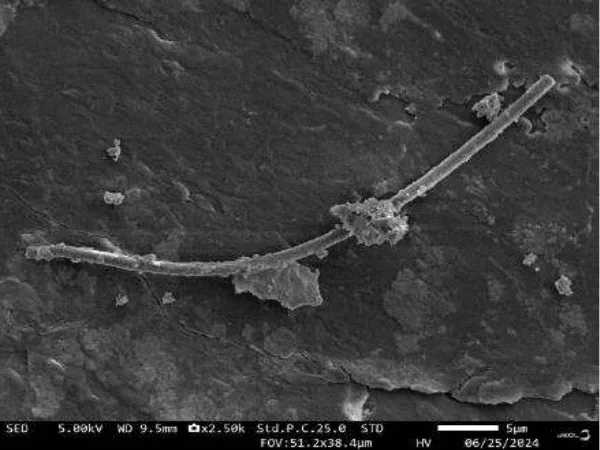
Questions
Is there more plastic in indoor or outdoor air?
Does the ocean put plastic into the air?
Are tire particles counted as microplastics?
Why did the 2026 study lower the emission estimates so much?
Three published inventories, run through a transport model, gave airborne concentrations 100 to 10,000 times higher than the medians of 2,782 measurements. Scaling land emissions down to about one-thousandth made modeled and measured mean concentrations over land match; ocean emissions were then scaled up 3.6 times (level C,2).
Does airborne plastic reach Antarctica?
One study found microplastics in snow at all 19 sites sampled on Ross Island in late 2019, about 29 particles per liter of meltwater at 50 µm and above. Back-trajectories allow transport of up to 6,000 km, but nearby research stations are a possible local source (level C,18). Nanoplastics in Antarctic sea ice (13) do not show whether they arrived by air or from seawater.
Where to go next
What happens to plastic once it lands at sea is on Oceans. The instruments and their size limits are explained on How We Measure It, and open questions on Knowledge Gaps.
Sources
- Brahney J, Hallerud M, Heim E, Hahnenberger M, Sukumaran S (2020). Plastic rain in protected areas of the United States. Science. doi:10.1126/science.aaz5819 journal article
- Evangelou I, Bucci S, Stohl A (2026). Atmospheric microplastic emissions from land and ocean. Nature. doi:10.1038/s41586-025-09998-6 journal article
- Tichý O, Košík V, Eckhardt S, Evangeliou N, Šmídl V (2026). Global continental and oceanic emissions of atmospheric microplastics inferred from pattern-restricted Bayesian inversion. EGUsphere (preprint, open for discussion, not peer reviewed). doi:10.5194/egusphere-2026-5158 Preprint · not peer reviewed open access
- Brahney J, Mahowald N, Prank M, Cornwell G, Klimont Z, Matsui H et al. (2021). Constraining the atmospheric limb of the plastic cycle. Proceedings of the National Academy of Sciences. doi:10.1073/pnas.2020719118 journal article
- Yakovenko N, Pérez-Serrano L, Segur T, Hagelskjaer O, Margenat H, Le Roux G et al. (2025). Human exposure to PM10 microplastics in indoor air. PLOS One. doi:10.1371/journal.pone.0328011 journal article open access
- Bergmann M, Mützel S, Primpke S, Tekman MB, Trachsel J, Gerdts G (2019). White and wonderful? Microplastics prevail in snow from the Alps to the Arctic. Science Advances. doi:10.1126/sciadv.aax1157 journal article open access
- Kaushik A, Peter AE, van Pinxteren M, Scholz-Böttcher BM, Herrmann H (2025). Composition, interactions and resulting inhalation risk of micro- and nano-plastics in urban air. Communications Earth & Environment. doi:10.1038/s43247-025-02980-0 journal article open access
- Herzke D, Schmidt N, Lervik AE, Schulze D, Celentano S, Eckhardt S et al. (2026). Airborne microplastics on the move: Urban Europe as a source to remote regions. Environmental Pollution. doi:10.1016/j.envpol.2025.127380 journal article
- Dris R, Gasperi J, Saad M, Mirande C, Tassin B (2016). Synthetic fibers in atmospheric fallout: A source of microplastics in the environment?. Marine Pollution Bulletin 104:290–293. doi:10.1016/j.marpolbul.2016.01.006 journal article
- Evangeliou N, Tichý O, Eckhardt S, Zwaaftink CG, Brahney J (2022). Sources and fate of atmospheric microplastics revealed from inverse and dispersion modelling: From global emissions to deposition. Journal of Hazardous Materials 432:128585. doi:10.1016/j.jhazmat.2022.128585 journal article open access
- Yang S, Brasseur G, Walters S, Lichtig P, Li CWY (2025). Global atmospheric distribution of microplastics with evidence of low oceanic emissions. npj Climate and Atmospheric Science 8:81. doi:10.1038/s41612-025-00914-3 journal article open access
- Goßmann I, Herzke D, Held A, Schulz J, Nikiforov V, Georgi C et al. (2023). Occurrence and backtracking of microplastic mass loads including tire wear particles in northern Atlantic air. Nature Communications 14:3707. doi:10.1038/s41467-023-39340-5 journal article open access
- Materić D, Kjær HA, Vallelonga P, Tison JL, Röckmann T, Holzinger R (2022). Nanoplastics measurements in Northern and Southern polar ice. Environmental Research. doi:10.1016/j.envres.2022.112741 journal article
- Allen S, Allen D, Phoenix VR, Le Roux G, Durántez Jiménez P, Simonneau A et al. (2019). Atmospheric transport and deposition of microplastics in a remote mountain catchment. Nature Geoscience. doi:10.1038/s41561-019-0335-5 journal article
- Materić D, Ludewig E, Brunner D, Röckmann T, Holzinger R (2021). Nanoplastics transport to the remote, high-altitude Alps. Environmental Pollution. doi:10.1016/j.envpol.2021.117697 journal article
- Allen S, Allen D, Baladima F, Phoenix VR, Thomas JL, Le Roux G et al. (2021). Evidence of free tropospheric and long-range transport of microplastic at Pic du Midi Observatory. Nature Communications 12:7242. doi:10.1038/s41467-021-27454-7 journal article open access
- Wang Y, Okochi H, Tani Y, Hayami H, Minami Y, Katsumi N et al. (2023). Airborne hydrophilic microplastics in cloud water at high altitudes and their role in cloud formation. Environmental Chemistry Letters 21:3055–3062. doi:10.1007/s10311-023-01626-x journal article open access
- Aves AR, Revell LE, Gaw S, Ruffell H, Schuddeboom A, Wotherspoon NE et al. (2022). First evidence of microplastics in Antarctic snow. The Cryosphere 16:2127–2145. doi:10.5194/tc-16-2127-2022 journal article open access
- Evangeliou N, Grythe H, Klimont Z, Heyes C, Eckhardt S, Lopez-Aparicio S et al. (2020). Atmospheric transport is a major pathway of microplastics to remote regions. Nature Communications. doi:10.1038/s41467-020-17201-9 journal article open access
- Science Media Centre (UK) (2026). Expert reaction to a study investigating global atmospheric microplastic emissions. Science Media Centre, London. www.sciencemediacentre.org/expert-reaction-to-a-study-investigating-global-atmospheric-microplastic-emissions/ web open access
- Science Media Centre Spain (2026). A study claims that atmospheric microplastic emissions may be overestimated. SMC España. sciencemediacentre.es/en/study-claims-atmospheric-microplastic-emissions-may-be-overestimated web open access
- Dris R, Gasperi J, Mirande C, Mandin C, Guerrouache M, Langlois V et al. (2017). A first overview of textile fibers, including microplastics, in indoor and outdoor environments. Environmental Pollution 221:453–458. doi:10.1016/j.envpol.2016.12.013 journal article
- World Health Organization (2022). Dietary and inhalation exposure to nano- and microplastic particles and potential implications for human health. World Health Organization, Geneva. www.who.int/publications/i/item/9789240054608 report open access
- Materić D, Kasper-Giebl A, Kau D, Anten M, Greilinger M, Ludewig E et al. (2020). Micro- and Nanoplastics in Alpine Snow: A New Method for Chemical Identification and (Semi)Quantification in the Nanogram Range. Environmental Science & Technology. doi:10.1021/acs.est.9b07540 journal article
- Rao M. N., Ghude S. D., Nivdange S. D., Panchang R., Pipal A. S., Mukherjee A. et al. (2025). Characterization and health risk assessment of airborne microplastics in Delhi NCR. Scientific Reports 15: 25662. doi:10.1038/s41598-025-04306-8 journal article open access
Evidence levels and provenance
- AConsensus
- Multiple independent studies or a systematic review plus a statement by a scientific body.
- BWell supportedUsed on this page
- Several independent studies with concordant findings.
- CLimitedUsed on this page
- Few studies, narrow conditions, or methodological caveats.
- DDisputedUsed on this page
- Conflicting results; both sides are shown.
- EUnknownUsed on this page
- No reliable evidence found; the search scope is stated.
- PProvenanceUsed on this page
- Provenance: checked against the primary record. A separate category, not an evidence grade: used for bibliographic facts, legal texts, official metadata, definitions quoted from a standard, the site's own arithmetic and statements about the site's process.
Editorial categories of this site. A–E grade scientific findings, per claim, with a one-line rationale; D and E are not lower rungs of the A–C scale. P is not a grade: it marks facts checked against their primary record.