FROM THE ATMOSPHERE TO THE HUMAN BODY
Planet Overview
Plastic particles are found in air, water and soil worldwide and are detected in the human body. The home counters are estimates, not measurements. None of the four systems shown meets our criterion for a proven complete solution: 0 / 4.
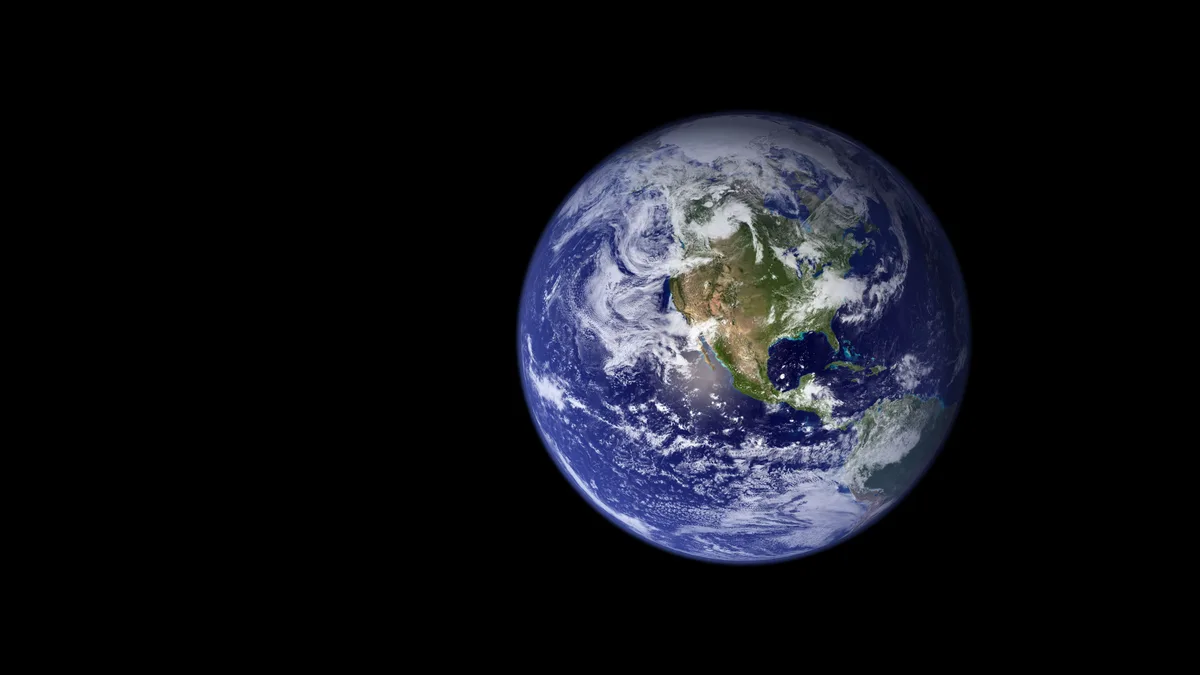
Plastic particles are consistently found in air, water and soil (level A)1. They are detected throughout the human body, though how reliably amounts are measured is debated (level B)1,2. A 2025 study of 12 stations estimated about 27 million metric tons (27 Mt) of nanoplastic in the mixed upper layer of the temperate to subtropical North Atlantic3. The authors put this in the range of earlier estimates for larger plastic in the Atlantic or even the global ocean (level C)4.
Three numbers at three scales
≈22 Mt
plastic leaked into the environment worldwide in 2019
all plastic sizes; 88% macroplastics, 12% microplastics below 5 mm; OECD model estimate for 2019, against about 460 Mt produced that year5
single global model estimate from an intergovernmental agency, not a measured total
CLimited≈27 Mt
nanoplastic estimated in the upper North Atlantic
mixed layer of the temperate to subtropical North Atlantic; PET, PS and PVC below 1 µm; 12 stations on one transect, extrapolated to the basin4
single study; polyethylene and polypropylene were not detected and may have been masked; not yet replicated
CLimited100–10,000×
how far models overshot measured airborne microplastic
three earlier emission inventories, size-aligned in a transport model, against measured global medians; 2,782 measurements of air concentration and deposition from 76 studies at 283 locations, 2014–2024; particles 5–100 µm6
particle numbers (the authors converted mass data to numbers); one study, though built on a large compiled dataset
CLimitedThe third number measures uncertainty rather than pollution. Laid beside 2,782 measurements of air concentration and deposition, the models overshot the measured medians by two to four orders of magnitude (level C)6.
Three numbers at three scales
Data table
| label | value | unit | level | source |
|---|---|---|---|---|
| plastic leaked into the environment, world, 2019 (all sizes, modeled) | 22 | Mt | C | S-011 |
| nanoplastic, North Atlantic mixed layer (PET, PS, PVC < 1 µm, extrapolated) | 27 | Mt | C | S-067 |
| model overestimate of measured airborne microplastic concentration, lower bound | 100 | × | C | S-052 |
| model overestimate of measured airborne microplastic concentration, upper bound | 10000 | × | C | S-052 |
What the live model shows and does not show
The home counters multiply a flow by elapsed time: since you opened the page, since midnight or since 1 January. Each flow is a named study value chosen in settings, and every counter is an estimate, not a measurement. Σ adds air and water only. With the defaults it is 1.7045 Mt a year (54 kg/s), and 99.7% of that is plastic of all sizes entering the ocean, mostly large debris (level P)7.
So Σ is not a micro- or nanoplastic total. The model subtracts nothing where flows overlap, and Σ is not plastic production. Soil has no counter because we found no global estimate of plastic entering soil each year (level E)7. Human intake is a separate mass counter. The default air flow comes from the 2026 comparison above: about 0.0045 Mt per year for particles of 5–100 µm (level C)6.
Estimate
Every number in the home counters is an estimate, not a measurement: a chosen study value multiplied by elapsed time. It is not a sensor reading and not global plastic production. Choosing another study in settings changes the counters, not any scientific result or evidence level.
What the zero means
0 / 4 is a count, not a score. A proven complete solution must meet four conditions. It works on dispersed particles across the whole system, covers nanoplastics below 1 µm, is shown outside the laboratory and does not simply move particles elsewhere8. No method meets all four for any system shown (level E)1. We searched Crossref, PubMed, agency pages and the web for 2016–2026, last on 3 November 2026. Prevention and local treatment are not judged by this count.
Local results are shown separately. In a pilot rapid sand filter at Zurich's waterworks, 99.5% of palladium-labeled model nanoplastics stayed in the top 0.9 m of sand (level C)9. A model of the full-scale plant, built on those tests, credits slow sand filtration with about 3 log units (99.9%) of removal. Retention is not destruction. The cards and methods are on Solutions by System, the findings per system on Evidence by System.
Where to go next
From Planet to Cell follows the particles from orbit down to a cell membrane. Four Microworlds shows air, water, soil and tissue as animated illustrations. How to Read the Numbers explains why particle counts and masses from different studies rarely compare directly, and Evidence Levels explains the A to E grades used here.
 Illustration
Sources
- Thompson RC, Courtene-Jones W, Boucher J, Pahl S, Raubenheimer K, Koelmans AA (2024). Twenty years of microplastic pollution research—what have we learned?. Science. doi:10.1126/science.adl2746 review
- Thomas KV, Belz S, Booth AM, Clift MJD, Cross RK, Davies G et al. (2026). Communicating Confidence in the Reliability of Micro- and Nanoplastic Identification in Human Health Studies. Environment & Health. doi:10.1021/envhealth.5c00671 journal article
- NIOZ Royal Netherlands Institute for Sea Research (2025). Tremendous amount of plastic floats as nanoparticles in the ocean. NIOZ (with Utrecht University). www.nioz.nl/en/news/tremendous-amount-of-plastic-floats-as-nanoparticles-in-the-ocean press open access
- ten Hietbrink S, Materić D, Holzinger R, Groeskamp S, Niemann H (2025). Nanoplastic concentrations across the North Atlantic. Nature. doi:10.1038/s41586-025-09218-1 journal article
- OECD (2022). Global Plastics Outlook: Economic Drivers, Environmental Impacts and Policy Options. OECD Publishing. doi:10.1787/de747aef-en report open access
- Evangelou I, Bucci S, Stohl A (2026). Atmospheric microplastic emissions from land and ocean. Nature. doi:10.1038/s41586-025-09998-6 journal article
- Nanoplastics planetary observatory (2026). Home counter model of the Nanoplastics planetary observatory: v6 script (NP object) and v7 specification (counter-model.json). Nanoplastics planetary observatory (site methodology record). Download from this site site record open access
- Nanoplastics planetary observatory (2026). Editorial decisions record and complete-solution criterion of the Nanoplastics planetary observatory. Nanoplastics planetary observatory (site editorial record). Methods record on this site site record open access
- Pulido-Reyes G, Magherini L, Bianco C, Sethi R, von Gunten U, Kaegi R et al. (2022). Nanoplastics removal during drinking water treatment: Laboratory- and pilot-scale experiments and modeling. Journal of Hazardous Materials. doi:10.1016/j.jhazmat.2022.129011 journal article
Evidence levels and provenance
- AConsensusUsed on this page
- Multiple independent studies or a systematic review plus a statement by a scientific body.
- BWell supportedUsed on this page
- Several independent studies with concordant findings.
- CLimitedUsed on this page
- Few studies, narrow conditions, or methodological caveats.
- DDisputed
- Conflicting results; both sides are shown.
- EUnknownUsed on this page
- No reliable evidence found; the search scope is stated.
- PProvenanceUsed on this page
- Provenance: checked against the primary record. A separate category, not an evidence grade: used for bibliographic facts, legal texts, official metadata, definitions quoted from a standard, the site's own arithmetic and statements about the site's process.
Editorial categories of this site. A–E grade scientific findings, per claim, with a one-line rationale; D and E are not lower rungs of the A–C scale. P is not a grade: it marks facts checked against their primary record.