PROCESS, PEOPLE AND LIMITS
How We Work
This site is an independent science observatory on micro- and nanoplastics, written with AI agents and approved by one human editor. Here we describe who is responsible, how each page is drafted and checked, how images are made and labeled, and what the site cannot do.
This site is an independent observatory of the published evidence on micro- and nanoplastics in air, water, soil and the human body. It collects measurements, estimates and open questions, grades each key finding and links every claim to the document it comes from. It is not a research institute, runs no laboratory of its own, does not campaign and gives no medical advice.
One example of how literal we try to be: the rotating globe shows no single day. In NASA's Blue Marble composite, released in 2002, the land surface is built from satellite observations made from June to September 2001. The clouds combine two days of visible-light imagery with a third day of infrared imagery over the poles (P)1.
Who is responsible
The site is owned and edited by {{OWNER_NAME}}, based in Croatia. The owner decides what is published, approves every page before it goes live and answers for its content. There is no editorial board and no staff of human writers; the drafting is done by AI agents working under the owner's briefs and rules. If you find an error or want to ask about a source, write to {{CONTACT_EMAIL}}; the procedure is on Corrections & Contact.
How a page is made
Every page starts as a written brief, drafted by an AI coordinating agent within rules set by the editor: the reader question it answers, its sections, the facts it must check and the topics it must leave to other pages. From there each page passes the same seven steps (P)2.
How a page is made
Data table
| label | value | unit |
|---|---|---|
| 1 Research: find and read papers, reports and official pages, newest first | 1 | step |
| 2 Draft: write the page from the brief and the sources | 2 | step |
| 3 Claims ledger: list every number, comparison and strong statement with source, scope and grade | 3 | step |
| 4 Verification: a separate checker opens each cited source and rules each claim confirmed, contradicted, unsupported or unknown | 4 | step |
| 5 Review: an AI model from a different vendor reads the page as a skeptical scientist | 5 | step |
| 6 Approval: the human editor reads, corrects and approves | 6 | step |
| 7 Publication with a snapshot date; planned: reader corrections loop back to step 4 | 7 | step |
The claims ledger is the core of the method. Each claim is a separate record with its value, its scope (where, when, which particle sizes, which method), the source and a grade with a one-line reason. Scientific findings get an evidence level from A to E. Bibliographic facts, official metadata, legal texts, our own arithmetic and statements about this site get P, meaning checked against the primary record (P)2.
Every verdict other than confirmed goes to a fixer: contradicted, unsupported and unknown alike. The fixer corrects the text or writes down why it stands, citing the source. The verification record names the page the checker actually read, so an abstract-only or archived copy is visible; we plan to publish these records with each page (P)2.
The reviewer in step 5 runs on a model from a different company. We do this to get a second, differently produced critique, not because it guarantees independence: both systems can make the same mistake, and we have not measured how often they do. The review looks for overclaiming, missing landmark studies, wrong grades and captions that promise more than an image shows. Its findings go to the editor, who decides what changes.
How we choose and rank sources is explained in Methods & Sources; what the letters A to E and P mean is in Evidence Levels.
How AI is used, and where it is not
We use AI agents for four jobs: searching the literature, drafting text, checking cited sources against claims, and generating illustrations. We say this plainly because it shapes how the site should be read.
AI is never a source on this site. A sentence written by a model counts for nothing until it traces to a cited paper, report, standard or official page that a reader can open. Where we could not find such a document, the page says "not established" and grades the point E.
Responsibility does not move to the software. The Committee on Publication Ethics (COPE) states that AI tools cannot be authors of a paper because they cannot take responsibility for it, and that authors must disclose how they used them. Its position was first issued in February 2023; the current version is dated 20 August 2024 (P)3. We apply the same principle to this site: the human editor is accountable for every published word, and this page is our disclosure.
The site does not publish interviews, quotes from people we have not cited, invented case stories or composite "typical" patients. News items are real, dated reports chosen by the editor.
Images: three lanes
Every image belongs to one of three lanes, and each lane has its own truth rule.
L1 is real imagery: satellite pictures, field photographs and published micrographs, used only with a verified license and a credit. L2 is data graphics, drawn from cited numbers, each shipped with its data table, its source and a text alternative. L3 is AI illustration. It is always captioned "Illustration", never imitates a microscope image with a fake scale bar and is never presented as a photo or a measurement.
The home page shows both ends of this rule. The rotating Earth is the NASA Blue Marble composite, built largely from observations by the MODIS instrument on the Terra satellite (P)1. The four microworlds are animated AI illustrations, generated with OpenAI's gpt-image model through Codex on 14 October 2026 at the owner's request, with particles enlarged for visibility; their prompts and file lineage are recorded on Picture Credits (P). They are not sample recordings or images of anyone's tissue.
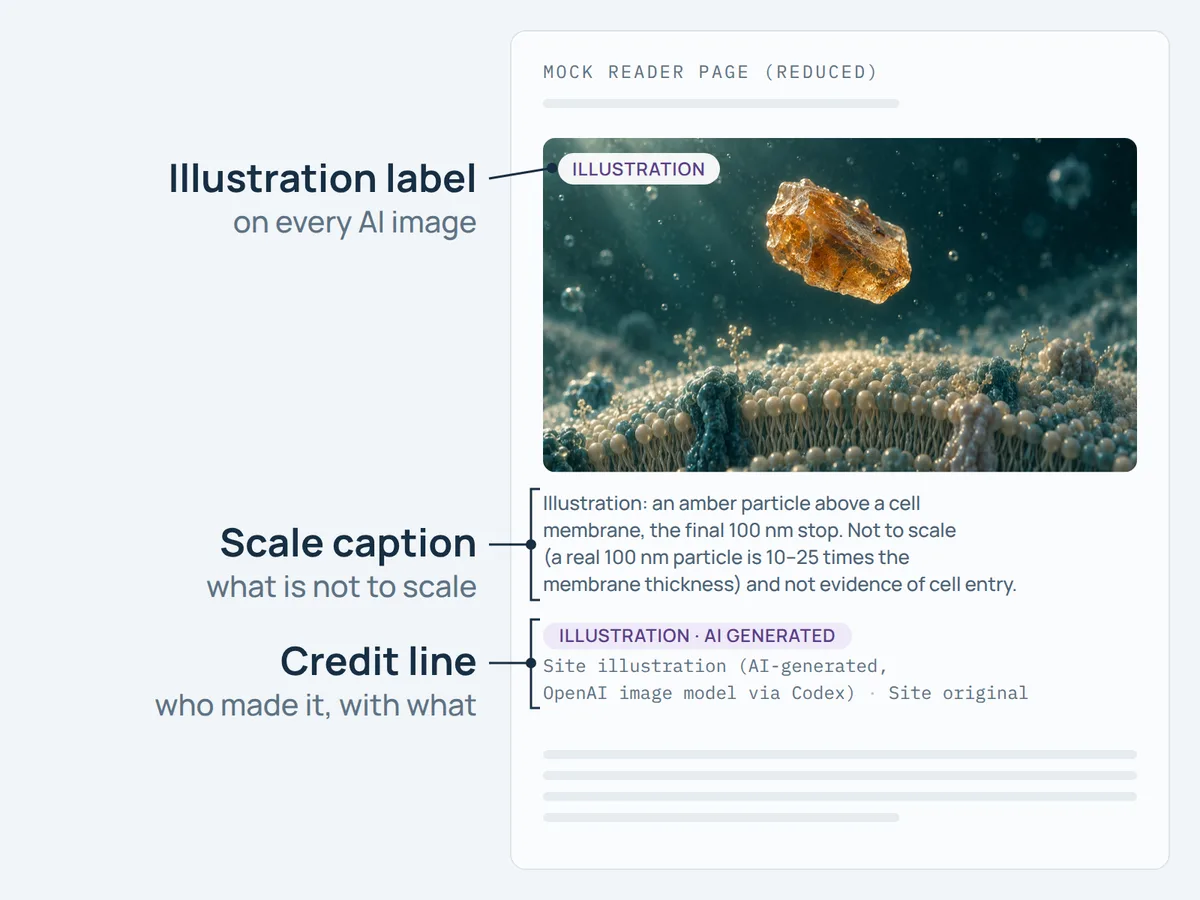 Illustration
Every image, its license and its author are listed in Picture Credits.
Updates and snapshot dates
Evidence pages are a dated snapshot, not a live feed. Each carries the date of its last literature review (4 November 2026) and does not update itself; a new study appears only after it has passed the same checks. News is curated by hand from real, dated reports.
The live counters on the home page are estimates, not measurements. Not every input is a micro- and nanoplastic figure: in model v7, applied on 4 November 2026, every water option, from the OECD default to river estimates, covers plastic of all sizes (P)4,5. Flows & Model lists where each input comes from and gives each model version a date.
Independence and funding
{{FUNDING_STATEMENT}}
The site carries no advertising and no sponsored content. No funder, company or advocacy group has a say in what is published. If that ever changes, this section will say so before the first such page appears.
Limitation
This is a small project with one human editor, so coverage is uneven and some topics wait longer for updates. The site is written in English first; translations follow later. AI agents can misread a paper or attach a number to the wrong scope, and our checks reduce that risk without removing it. Evidence on nanoplastics is young and moves fast, so a page can be out of date before its next snapshot. If you find a mistake, tell us through Corrections & Contact. We plan to keep a public corrections log there; no corrections have been recorded yet.
Sources
- NASA Goddard Space Flight Center, Stöckli R, Simmon R (2002). The Blue Marble (2002): True-color global imagery at 1km resolution. NASA Earth Observatory (NASA Science). science.nasa.gov/earth/earth-observatory/the-blue-marble-true-color-global-imagery-at-1km-resolution/ web open access
- Nanoplastics planetary observatory (2026). Methods and production record of the Nanoplastics planetary observatory (project brief, content schema and tools, agent prompts, registry build notes, verification and review audits). Nanoplastics planetary observatory (site methodology record). Methods record on this site site record open access
- COPE Council (2024). Authorship and AI tools (COPE position statement). Committee on Publication Ethics (COPE). doi:10.24318/cCVRZBms report open access
- OECD (2022). Global Plastics Outlook: Economic Drivers, Environmental Impacts and Policy Options. OECD Publishing. doi:10.1787/de747aef-en report open access
- Meijer LJJ, van Emmerik T, van der Ent R, Schmidt C, Lebreton L (2021). More than 1000 rivers account for 80% of global riverine plastic emissions into the ocean. Science Advances. doi:10.1126/sciadv.aaz5803 journal article open access
Evidence levels and provenance
- AConsensus
- Multiple independent studies or a systematic review plus a statement by a scientific body.
- BWell supported
- Several independent studies with concordant findings.
- CLimited
- Few studies, narrow conditions, or methodological caveats.
- DDisputed
- Conflicting results; both sides are shown.
- EUnknown
- No reliable evidence found; the search scope is stated.
- PProvenanceUsed on this page
- Provenance: checked against the primary record. A separate category, not an evidence grade: used for bibliographic facts, legal texts, official metadata, definitions quoted from a standard, the site's own arithmetic and statements about the site's process.
Editorial categories of this site. A–E grade scientific findings, per claim, with a one-line rationale; D and E are not lower rungs of the A–C scale. P is not a grade: it marks facts checked against their primary record.