WHERE EVERY IMAGE COMES FROM
Picture Credits
Every image on this site is listed with its source, credit and license or terms of use. The list separates real imagery, data graphics made from cited data, and AI illustrations.
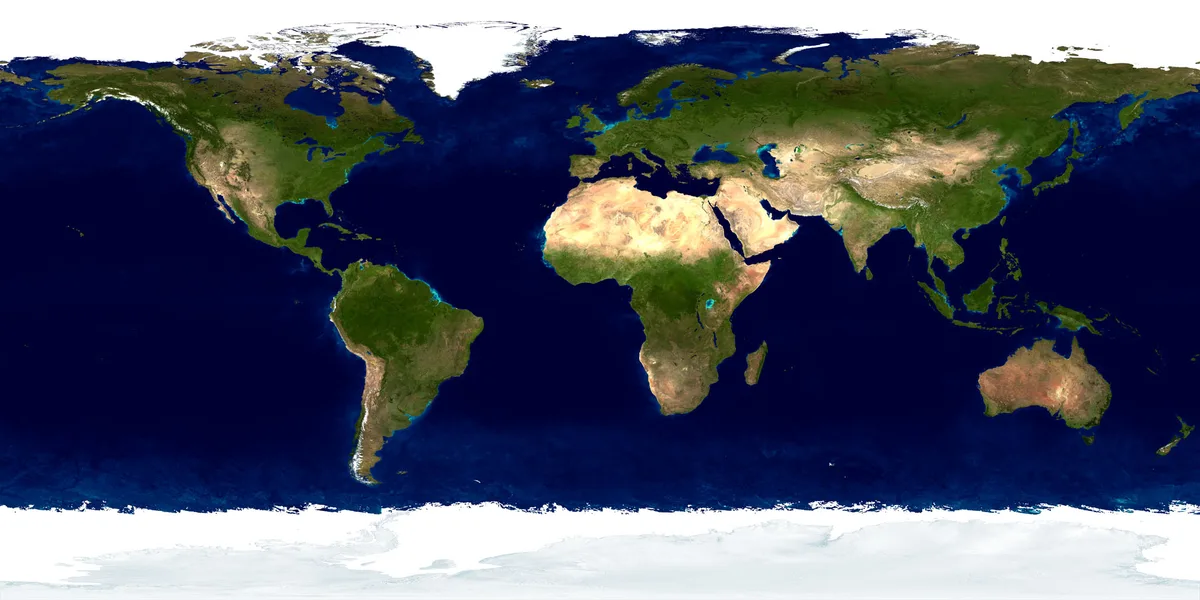
Every image on this site is listed below with its source, credit and license or terms of use. There are three kinds. Real photographs and micrographs appear only after their license is verified; captions name the instrument or setting. Data graphics are made here from cited data, and each caption names its source. AI illustrations show what no camera can, such as particles enlarged for visibility; each is labeled "Illustration" and never presented as a measurement.
The four microworld visuals on the home page are such illustrations: they were generated on 14 October 2026 with OpenAI's gpt-image model through Codex, OpenAI's coding agent, at the site owner's request (the owner's statement, matched by the local Codex records). Their prompts and file lineage are recorded; the original PNGs also carry C2PA credentials naming OpenAI, whose signatures have not been independently validated (P)1. Each is labeled as an illustration and shows no real tissue and no measurement.
Reuse follows each image's own terms. Graphics made by this site are released under {{SITE_LICENSE}}; the data they draw on keeps its own terms. To report a wrong or missing credit, use Corrections & Contact. Our image rules are in How We Work.
Data table
| lane | license class | images |
|---|---|---|
| L1 | Public domain, CC0, NASA or US Gov | 13 |
| L1 | CC BY | 14 |
| L1 | CC BY-SA | 10 |
| L1 | Other terms | 1 |
| L2 | Site original | 78 |
| L3 | Site original | 23 |
| total | 139 |
Home page
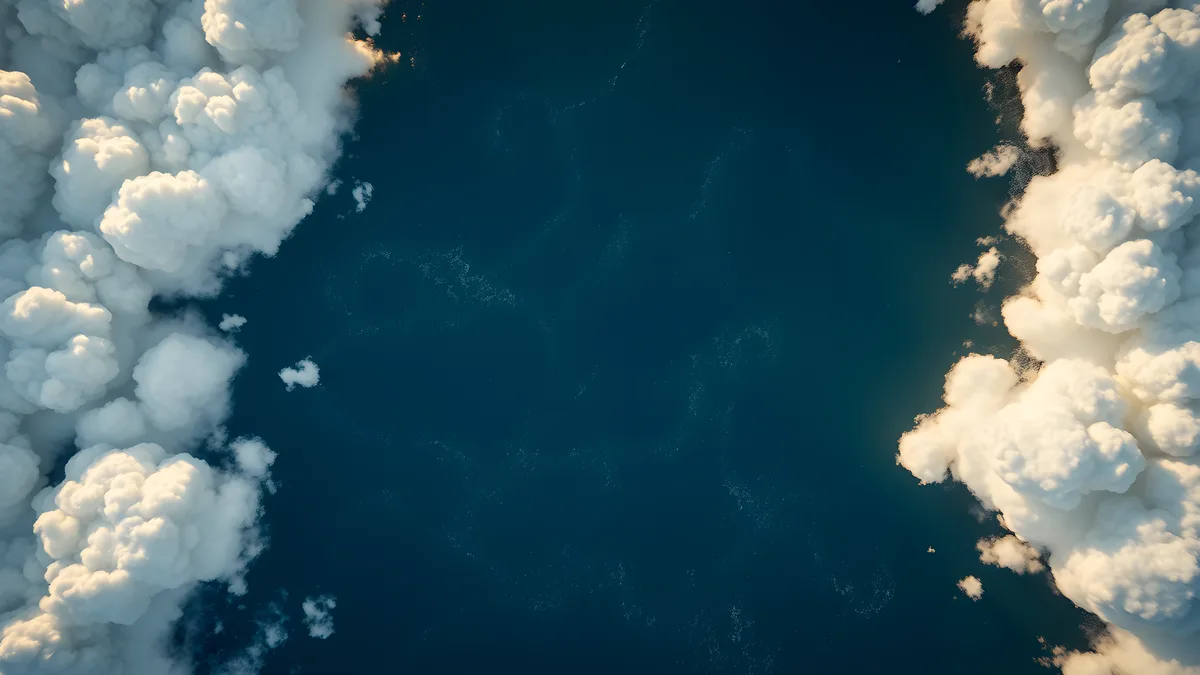
Journey frame: through clouds toward the ocean (illustration) Illustration · AI generated
- Credit
- Site illustration (AI-generated, FLUX.1 schnell)
- License
- Site original terms pending
- Made with
- FLUX.1-schnell (fp8, Comfy-Org/Flux-1-Schnell) · ComfyUI (local), tools/content/generate_l3.py
- Also used on
- From Planet to Cell
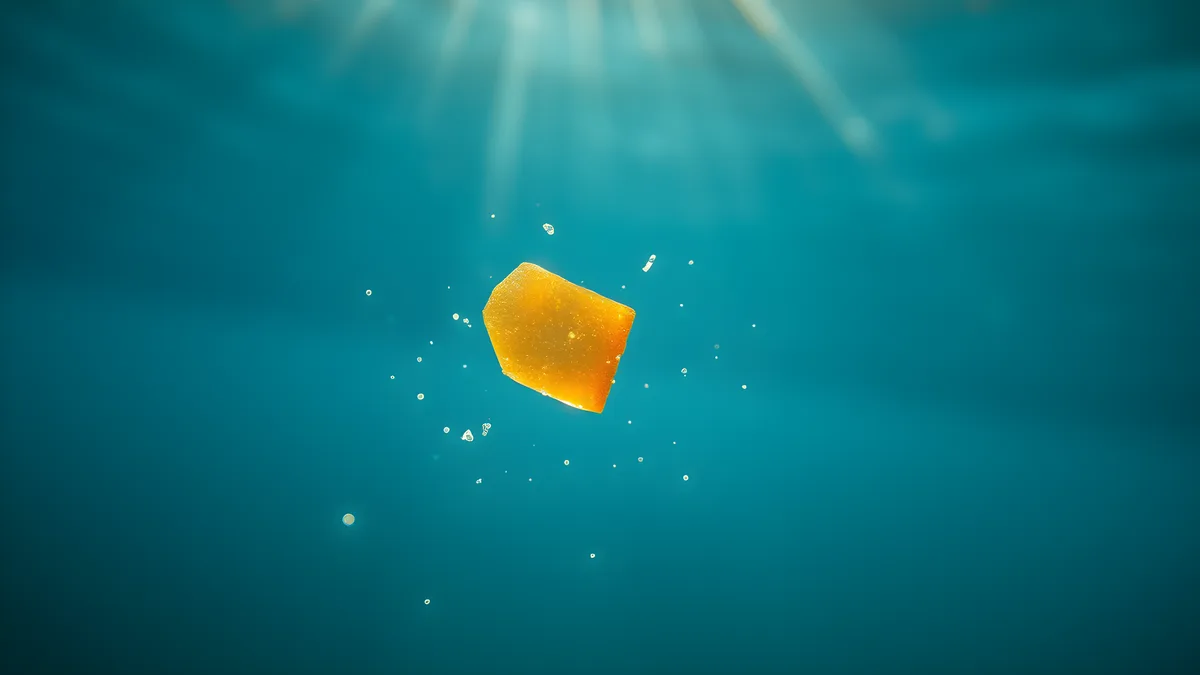
Journey frame: plastic fragment among smaller particles (illustration) Illustration · AI generated
- Credit
- Site illustration (AI-generated, FLUX.1 schnell)
- License
- Site original terms pending
- Made with
- FLUX.1-schnell (fp8, Comfy-Org/Flux-1-Schnell) · ComfyUI (local), tools/content/generate_l3.py
- Also used on
- From Planet to Cell
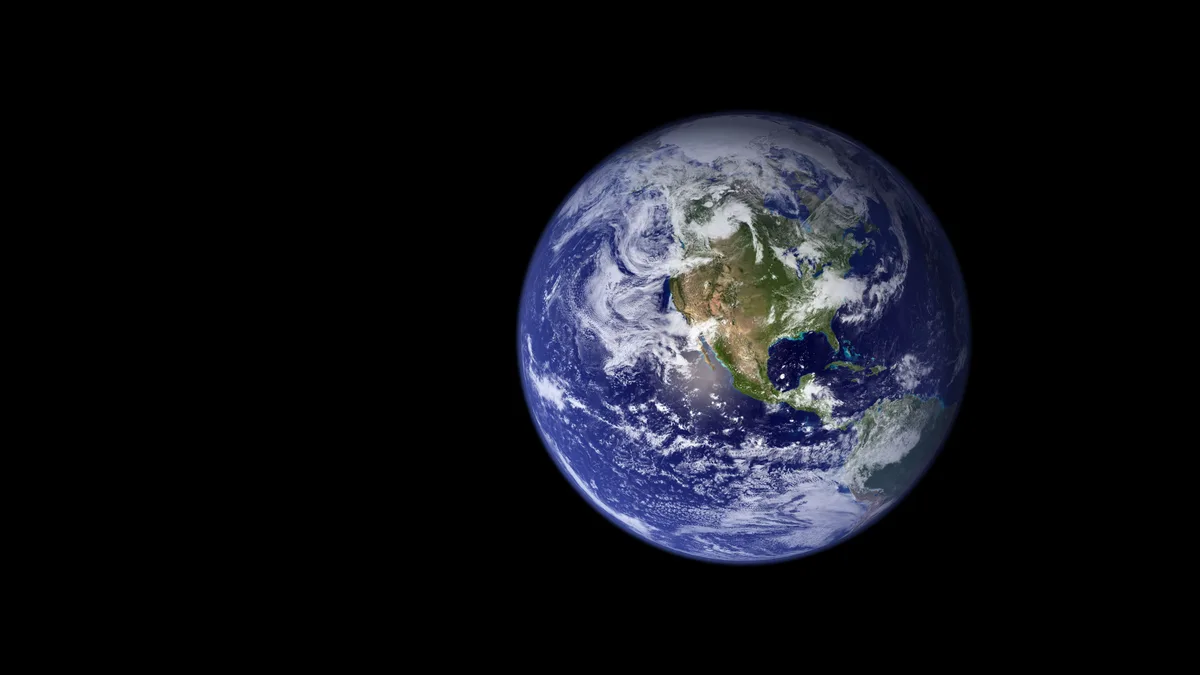
The Blue Marble (2002): Western Hemisphere globe Real image
- Credit
- NASA Goddard Space Flight Center. Image by Reto Stöckli (land surface, shallow water, clouds). Enhancements by Robert Simmon (ocean color, compositing, 3D globes, animation).
- Also credited
- Data and technical support: MODIS Land Group; MODIS Science Data Support Team; MODIS Atmosphere Group; MODIS Ocean Group. Additional data: USGS EROS Data Center (topography); USGS Terrestrial Remote Sensing Flagstaff Field Center (Antarctica); Defense Meteorological Satellite Program (city lights).
- License
- NASA
- Also used on
- Planet Overview
The Blue Marble: Land Surface, Ocean Color and Sea Ice (2048 × 1024) Real image
- Credit
- NASA Goddard Space Flight Center. Image by Reto Stöckli (land surface, shallow water, clouds). Enhancements by Robert Simmon (ocean color, compositing, 3D globes, animation).
- Also credited
- Data and technical support: MODIS Land Group; MODIS Science Data Support Team; MODIS Atmosphere Group; MODIS Ocean Group. Additional data: USGS EROS Data Center (topography); USGS Terrestrial Remote Sensing Flagstaff Field Center (Antarctica); Defense Meteorological Satellite Program (city lights).
- License
- NASA
- Also used on
- Picture Credits
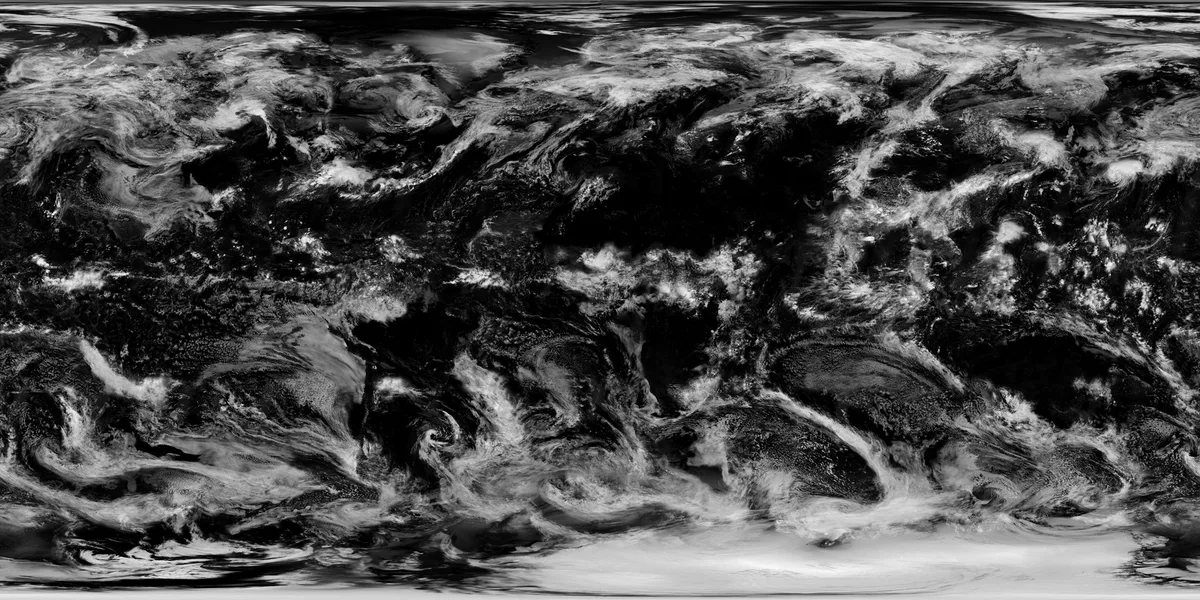
The Blue Marble: Clouds (2048 × 1024) Real image
- Credit
- NASA Goddard Space Flight Center. Image by Reto Stöckli (land surface, shallow water, clouds). Enhancements by Robert Simmon (ocean color, compositing, 3D globes, animation).
- Also credited
- Data and technical support: MODIS Land Group; MODIS Science Data Support Team; MODIS Atmosphere Group; MODIS Ocean Group. Additional data: USGS EROS Data Center (topography); USGS Terrestrial Remote Sensing Flagstaff Field Center (Antarctica); Defense Meteorological Satellite Program (city lights).
- License
- NASA
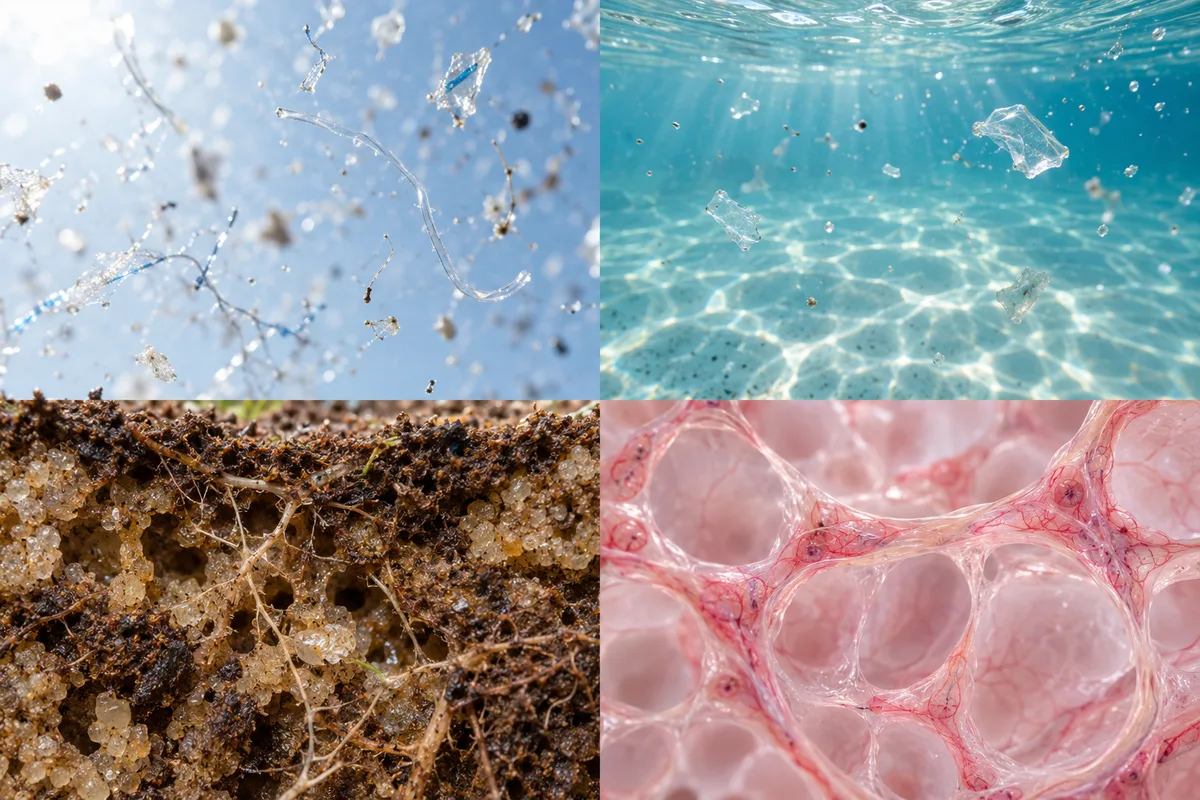
Microworld panels: air, water, soil and lung tissue (AI illustration, 2 × 2 atlas) Illustration · AI generated
- Credit
- Site illustration (AI-generated, OpenAI image model via Codex)
- License
- Site original terms pending
- Made with
- OpenAI gpt-image (version not stated) · Codex Desktop (OpenAI)
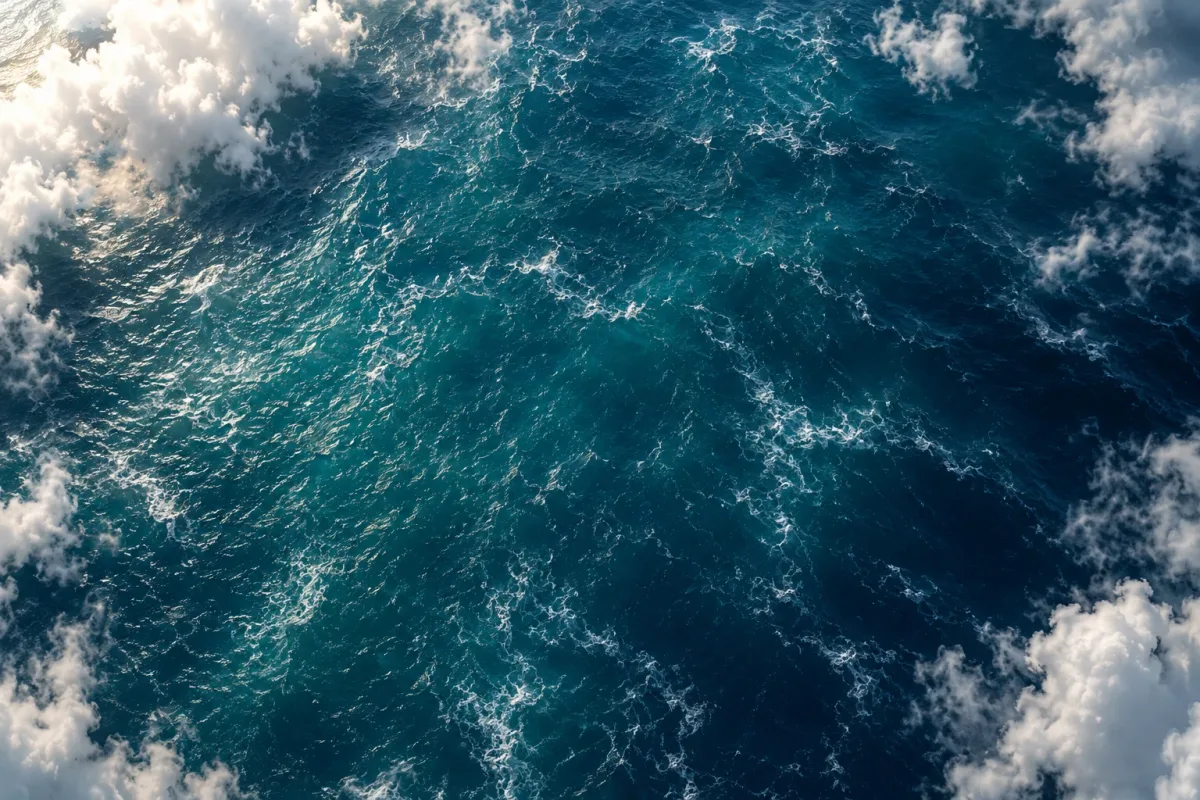
Journey frame: ocean through clouds (AI illustration) Illustration · AI generated
- Credit
- Site illustration (AI-generated, OpenAI image model via Codex)
- License
- Site original terms pending
- Made with
- OpenAI gpt-image (version not stated) · Codex Desktop (OpenAI)
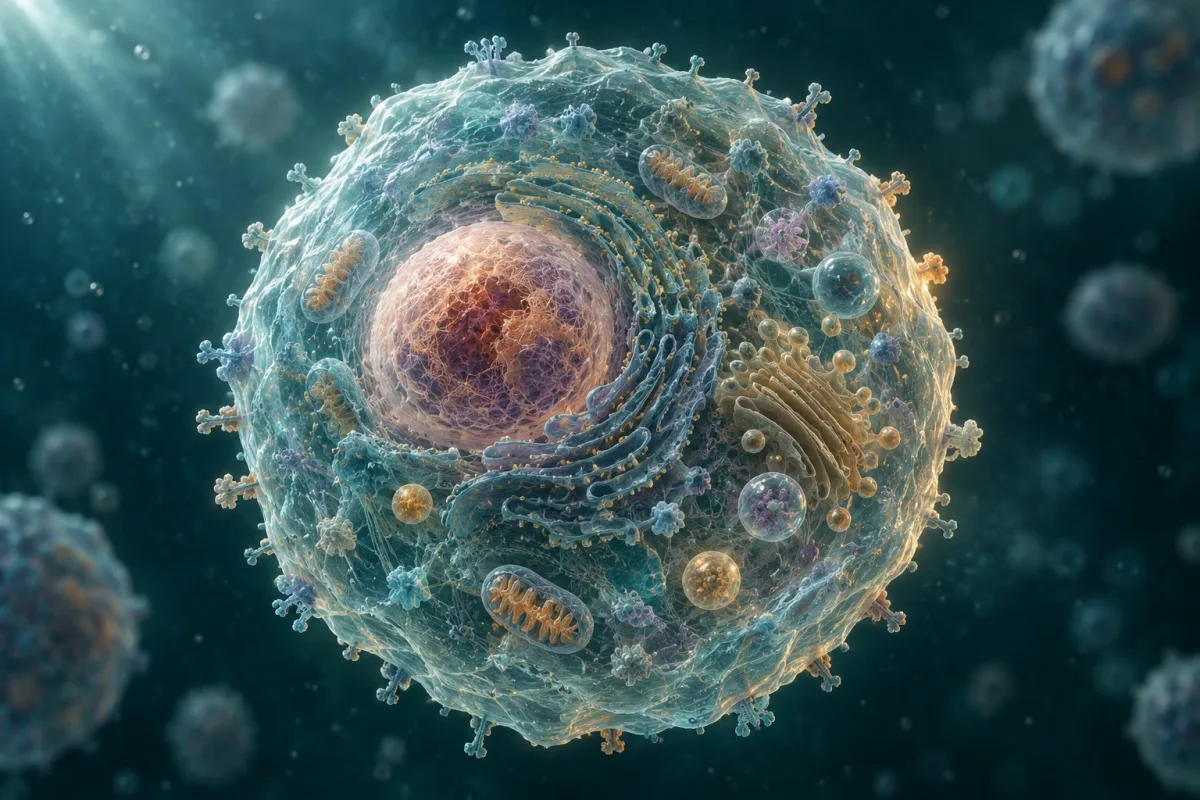
Journey frame: a single cell (AI illustration) Illustration · AI generated
- Credit
- Site illustration (AI-generated, OpenAI image model via Codex)
- License
- Site original terms pending
- Made with
- OpenAI gpt-image (version not stated) · Codex Desktop (OpenAI)
Journey frame: a particle above a cell membrane (AI illustration) Illustration · AI generated
- Credit
- Site illustration (AI-generated, OpenAI image model via Codex)
- License
- Site original terms pending
- Made with
- OpenAI gpt-image (version not stated) · Codex Desktop (OpenAI)
What You Can Do
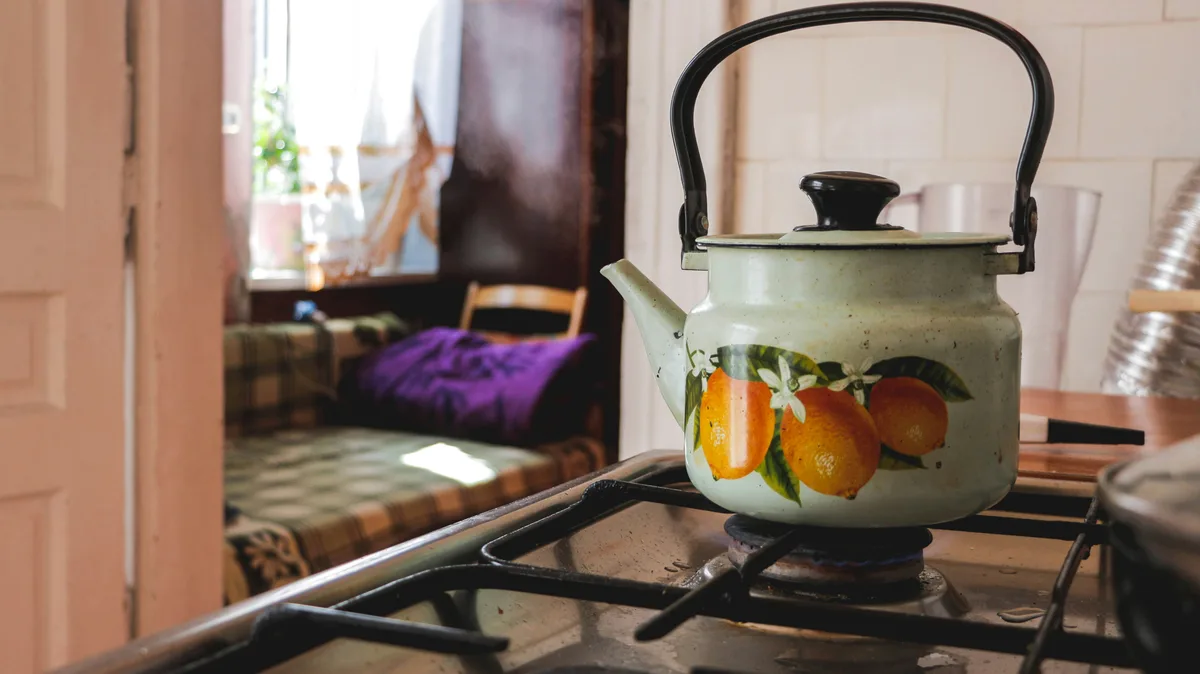
Enamel kettle on a gas stove Real image
- Credit
- Photo by Ioann-Mark Kuznietsov on Unsplash
- License
- Unsplash License
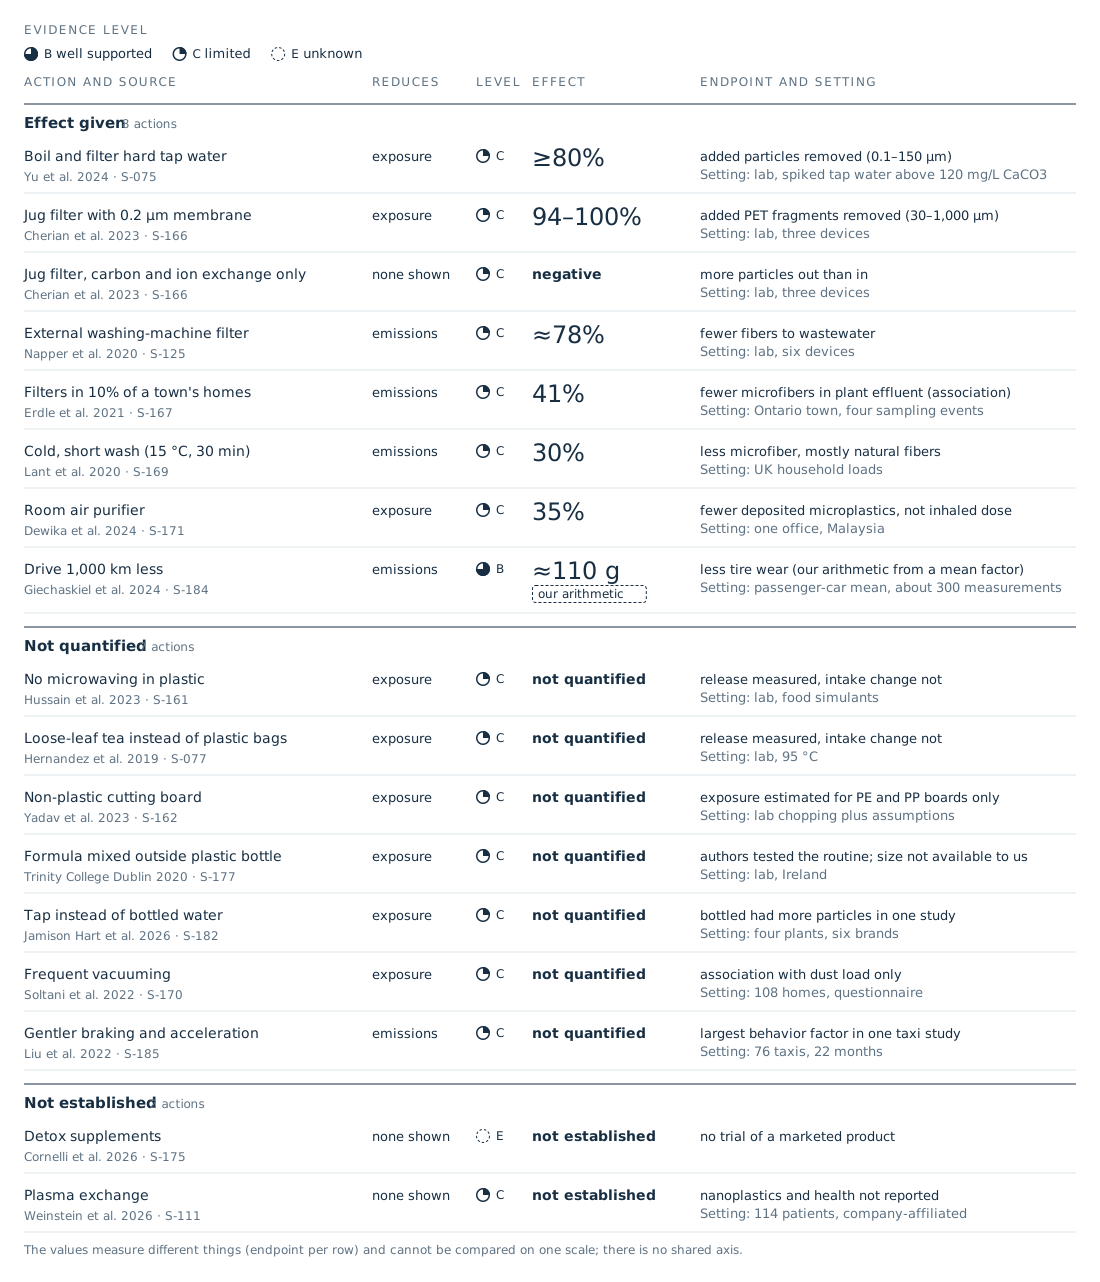
Everyday actions by evidence and measured effect Data graphic
- Credit
- Nanoplastics Observatory
- License
- Site original terms pending
- Data
- S-075
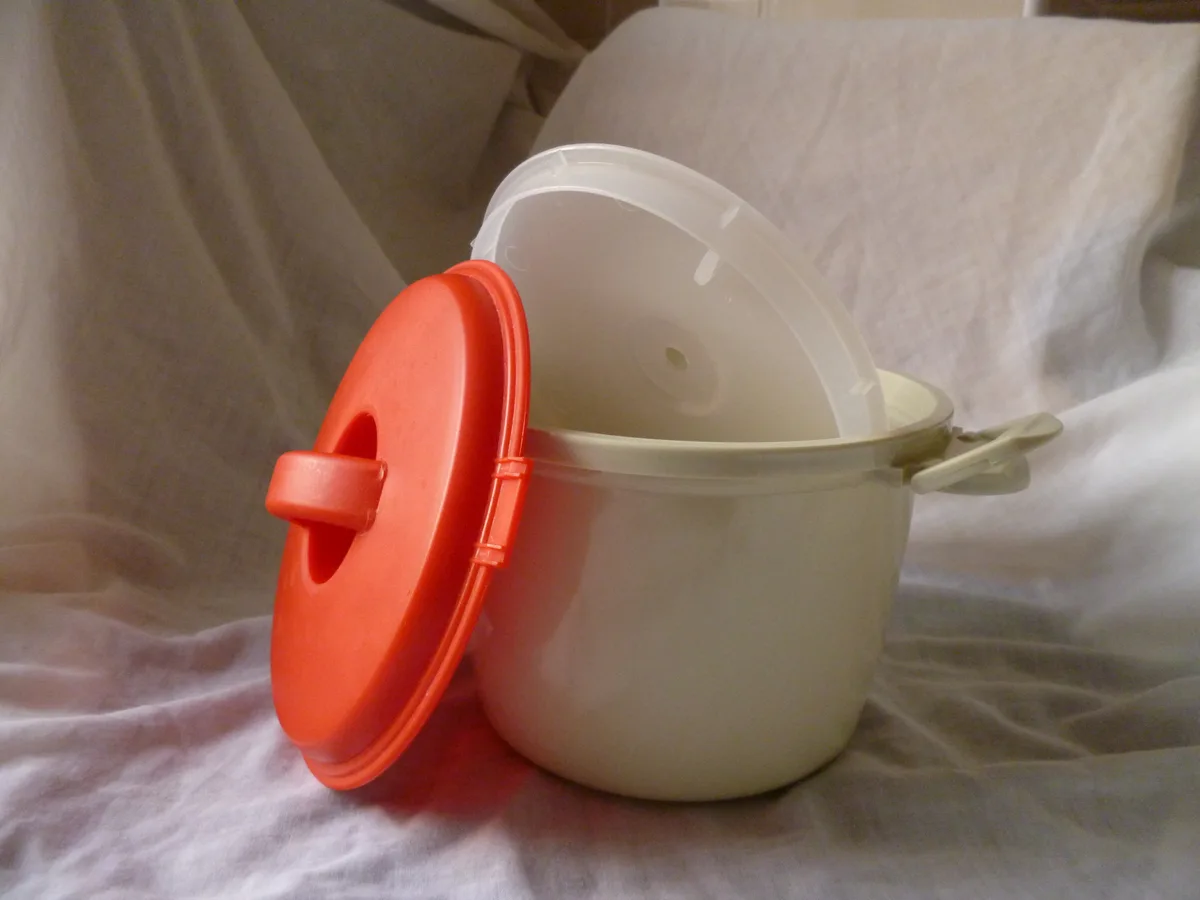
Plastic microwave rice cooker Real image
- Credit
- "Microwave Rice Maker" by Armchair, via Wikimedia Commons, CC BY-SA 3.0
- License
- CC BY-SA 3.0
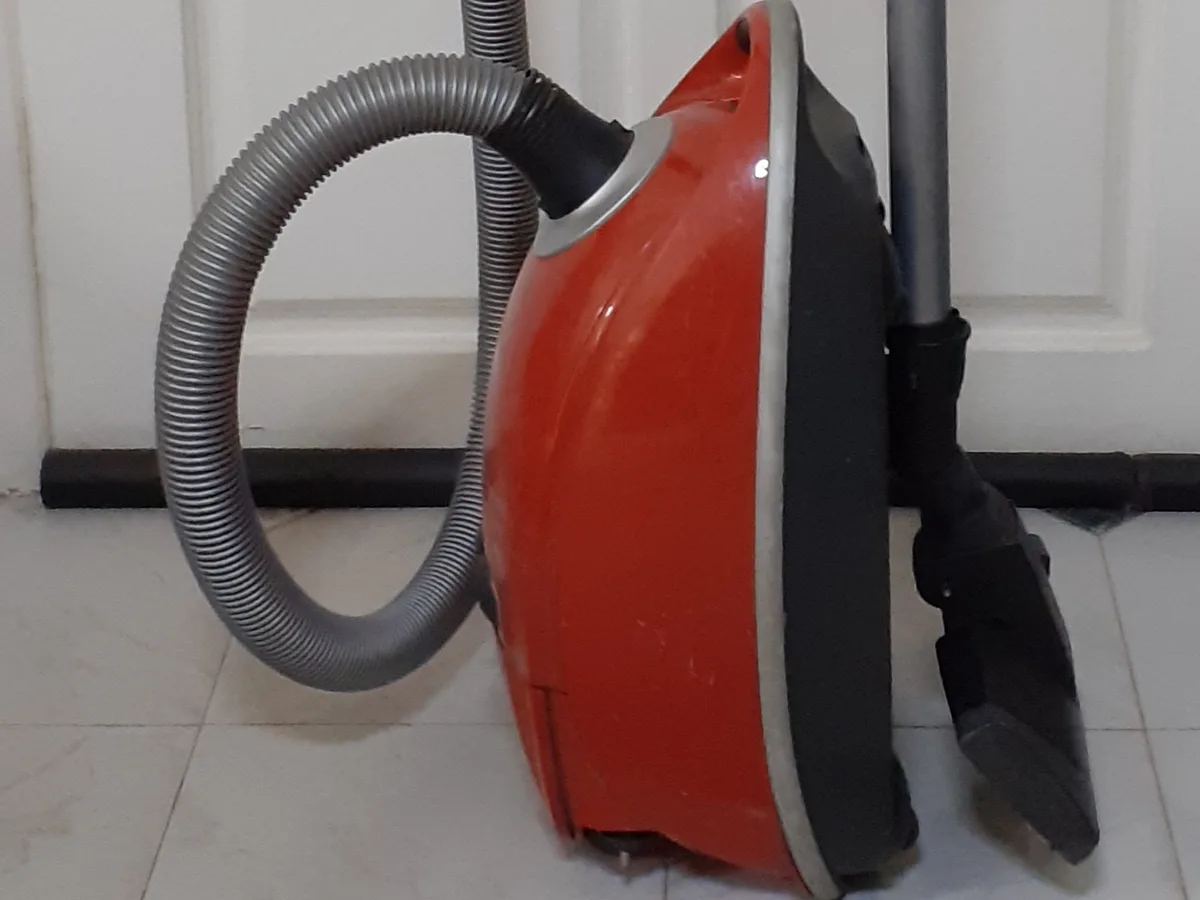
Canister vacuum cleaner on a tiled floor Real image
- Credit
- "Hlektiki skoupa" by Avacalop, via Wikimedia Commons, CC BY-SA 4.0
- License
- CC BY-SA 4.0
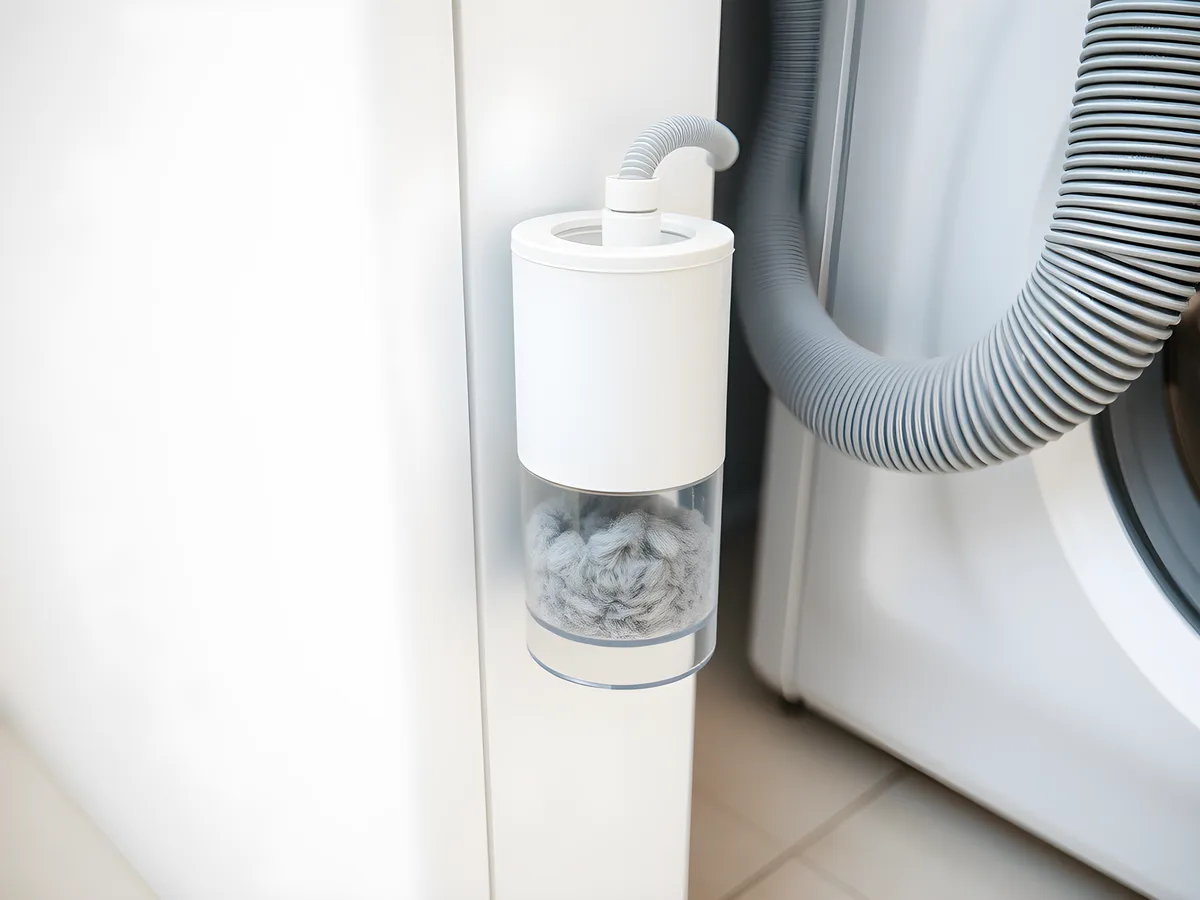
External washing-machine filter with captured lint (illustration) Illustration · AI generated
- Credit
- Site illustration (AI-generated, Flux)
- License
- Site original terms pending
- Made with
- FLUX.1-schnell (fp8, Comfy-Org/Flux-1-Schnell) · ComfyUI (local), tools/content/generate_l3.py
Solutions by Approach
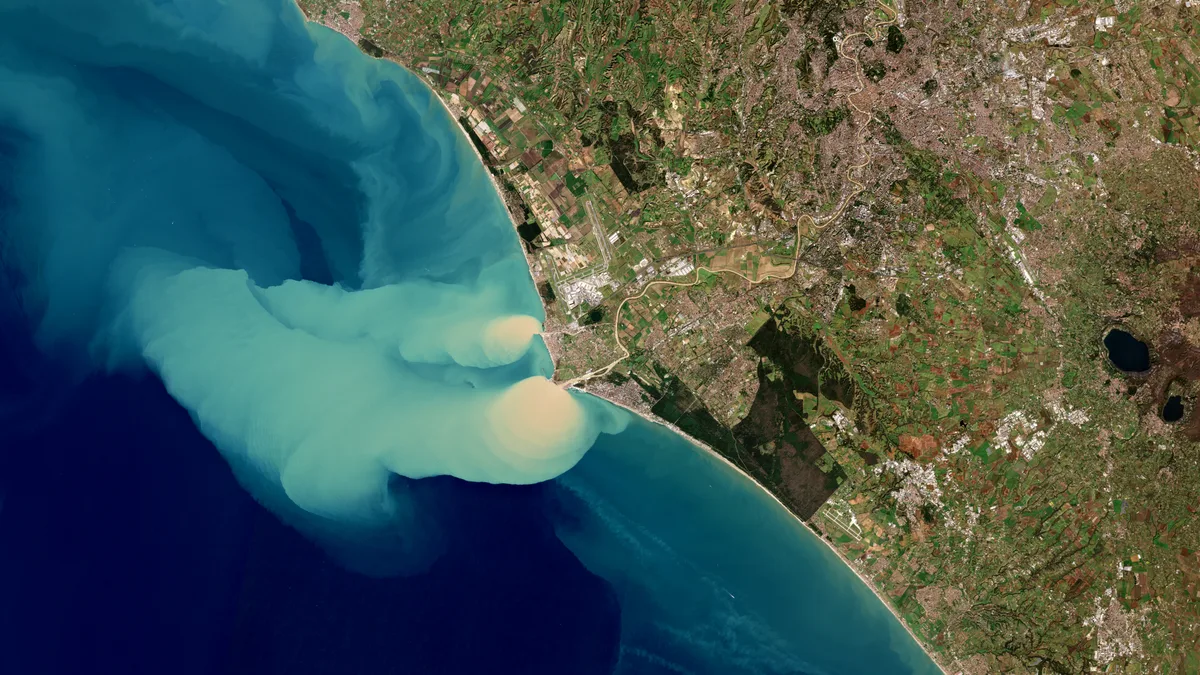
Sediment plume at sea Real image
- Credit
- contains modified Copernicus Sentinel data (2019), processed by ESA
- License
- CC BY-SA 3.0 IGO
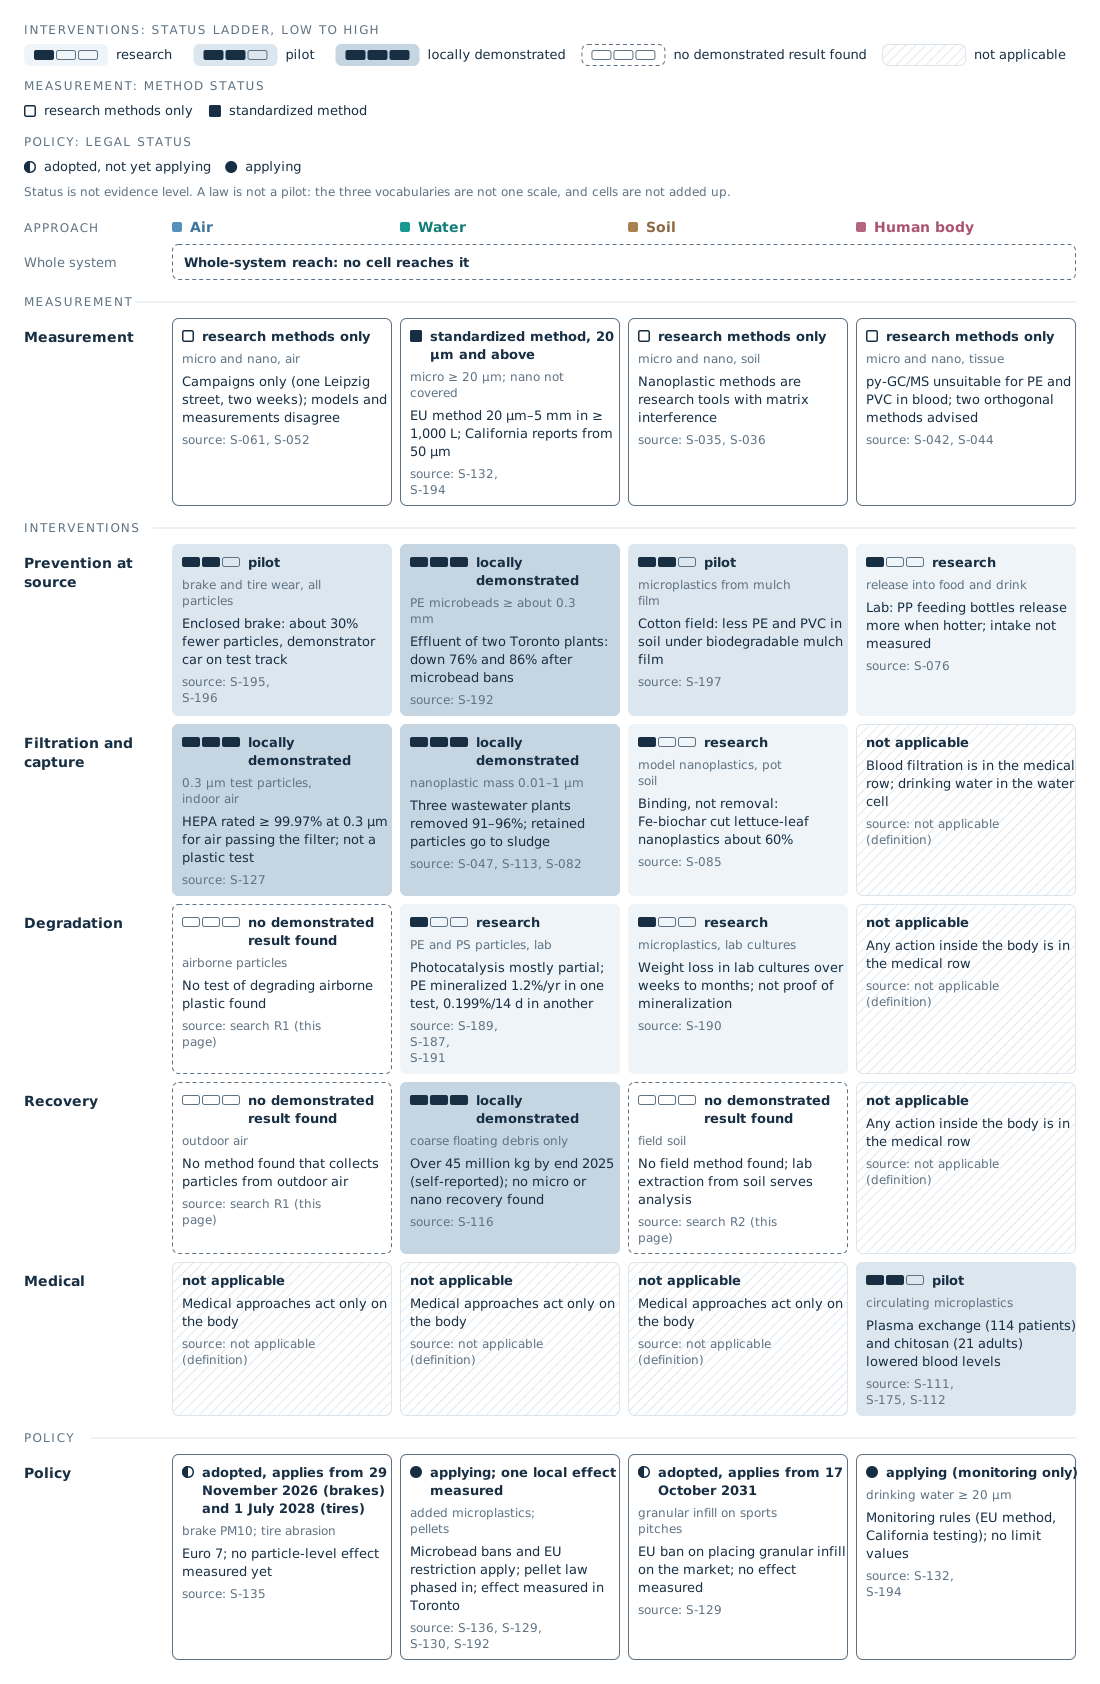
Solutions by approach and system: status on 3 November 2026 Data graphic
- Credit
- Nanoplastics Observatory
- License
- Site original terms pending
- Data
- S-061
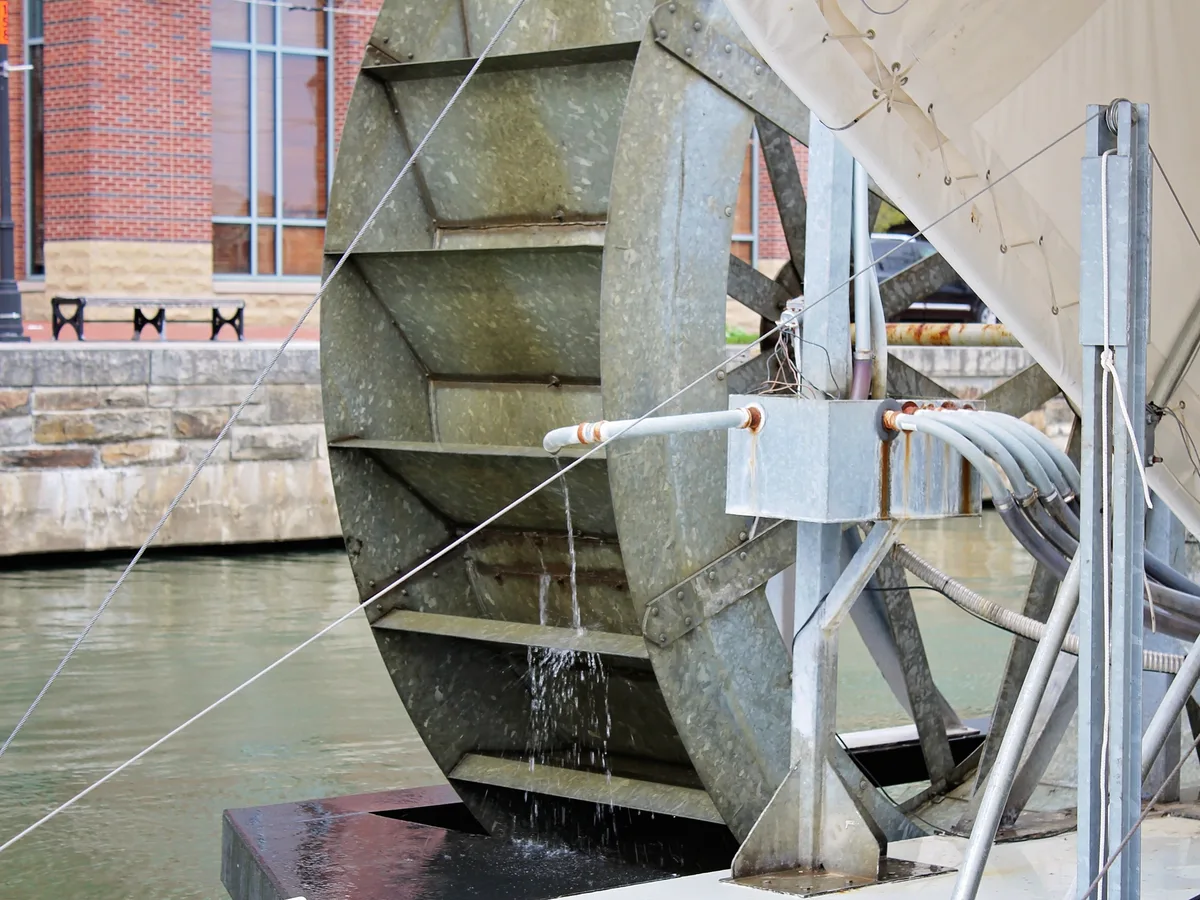
Inner Harbor Water Wheel (Mr. Trash Wheel), Baltimore Real image
- Credit
- U.S. Army photo by Cynthia Mitchell, U.S. Army Corps of Engineers
- License
- Public domain (US Gov)
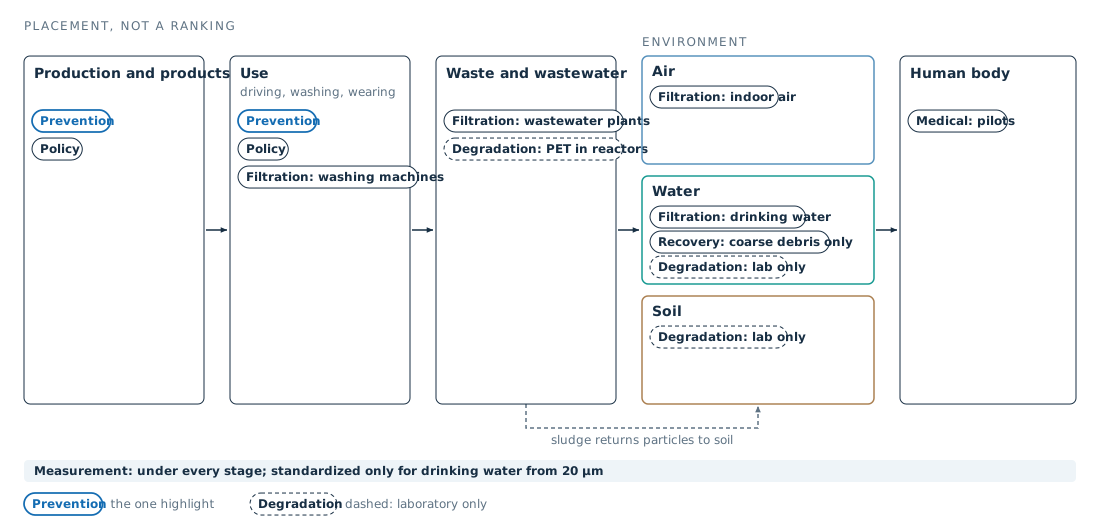
Where each approach acts along the chain Data graphic
- Credit
- Nanoplastics Observatory
- License
- Site original terms pending
- Data
- S-047
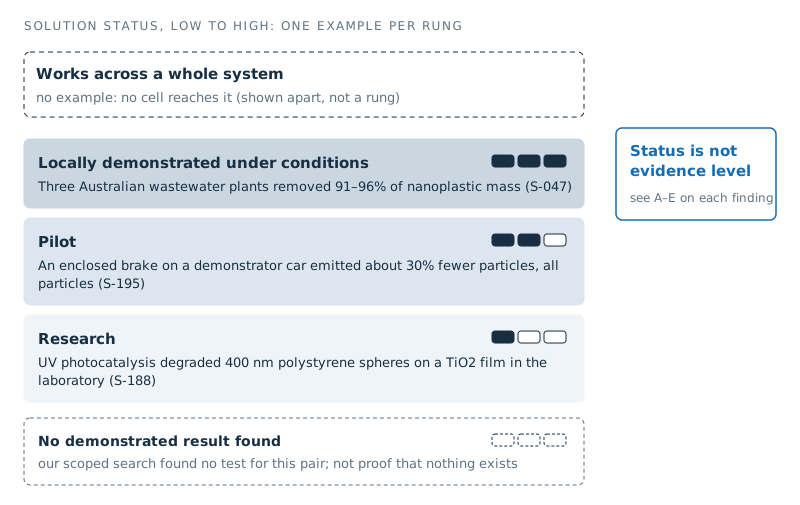
The solution status scale with one example per rung Data graphic
- Credit
- Nanoplastics Observatory
- License
- Site original terms pending
- Data
- S-047
Atmosphere
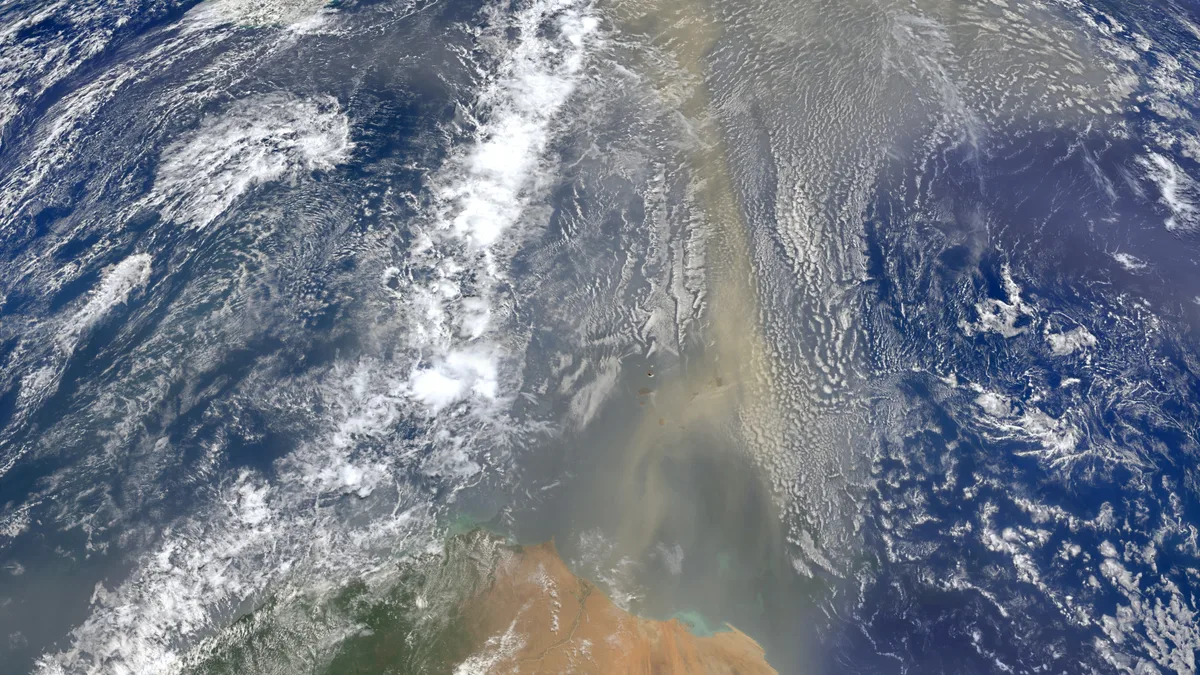
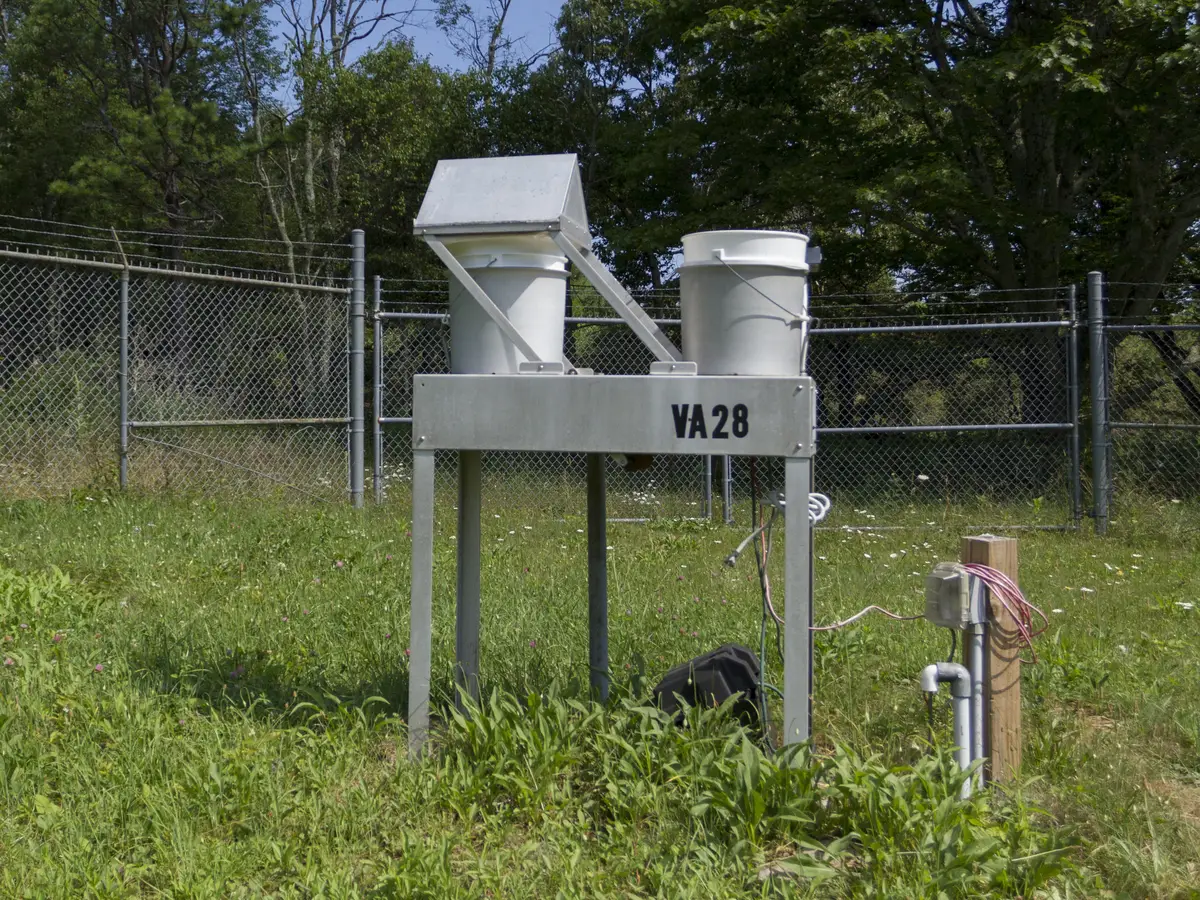
Atmospheric Wet Deposition Sampler Real image
- Credit
- NPS / Mary O'Neill
- License
- Public domain (US Gov)
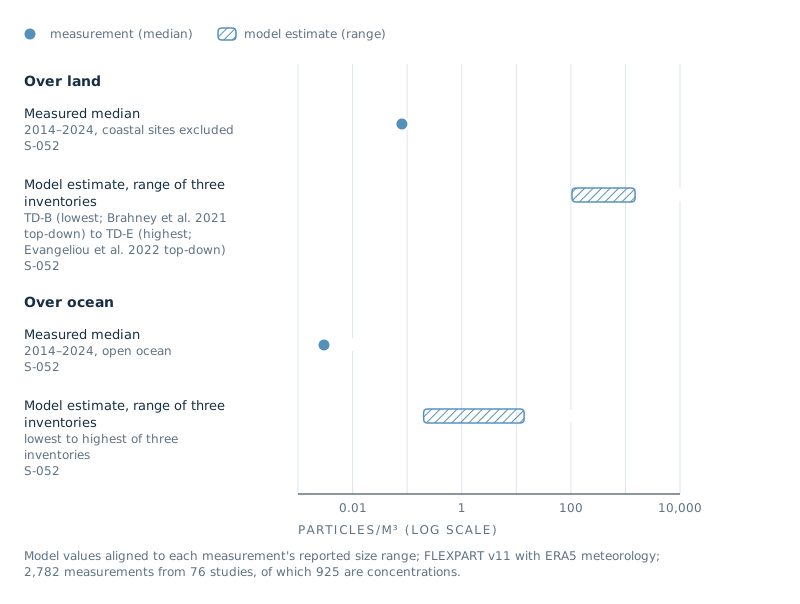
Measured vs modeled microplastic concentrations in air, global medians Data graphic
- Credit
- Nanoplastics Observatory
- License
- Site original terms pending
- Data
- S-052
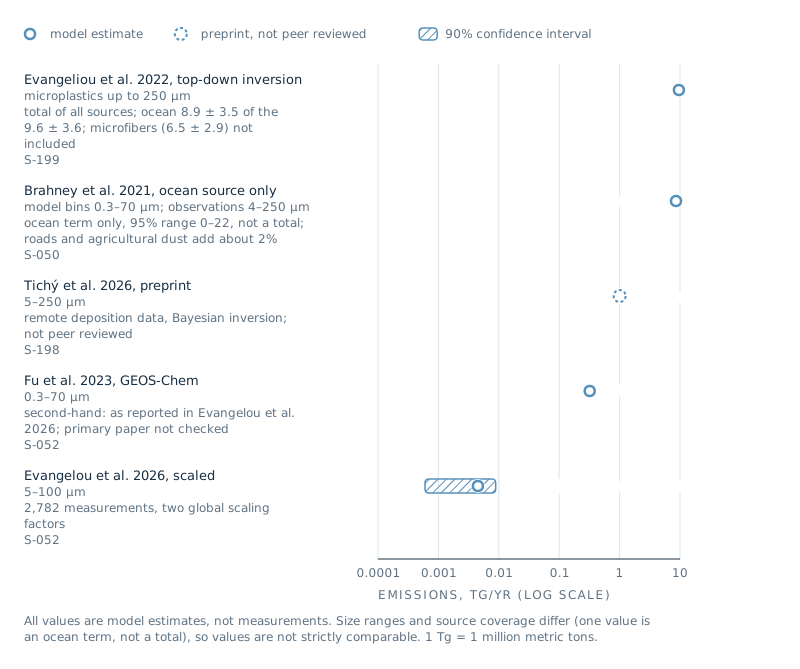
Global microplastic emissions into the air: published estimates Data graphic
- Credit
- Nanoplastics Observatory
- License
- Site original terms pending
- Data
- S-052
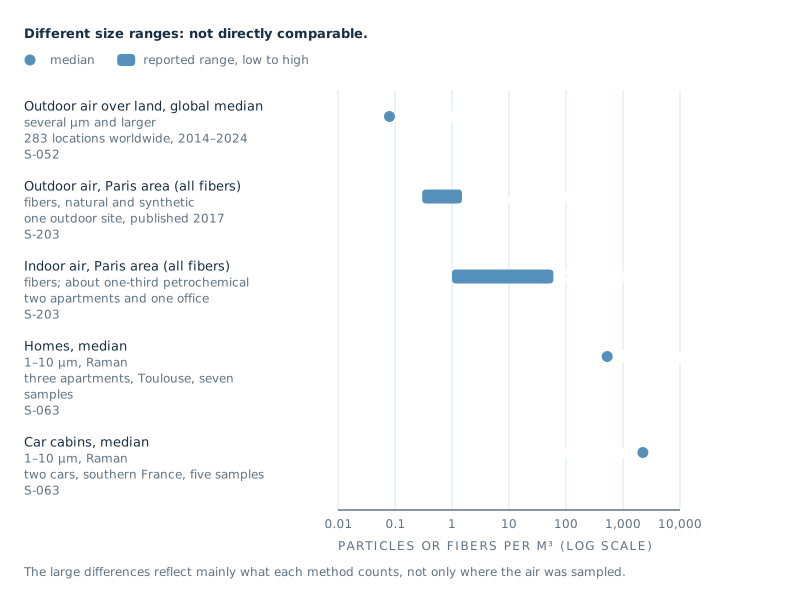
Airborne plastic indoors and outdoors: what each study counted Data graphic
- Credit
- Nanoplastics Observatory
- License
- Site original terms pending
- Data
- S-052
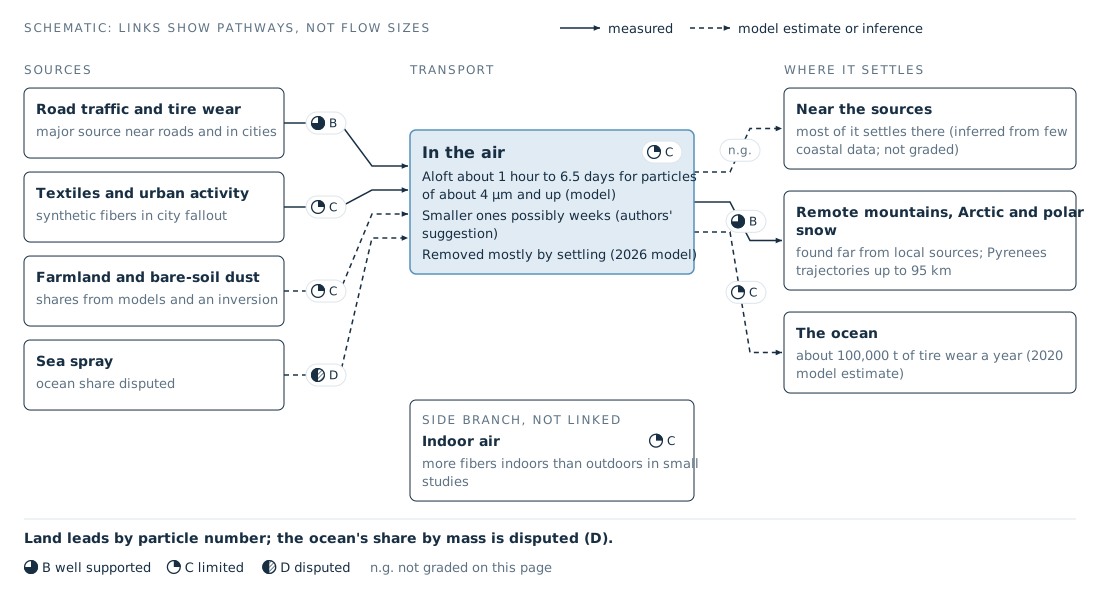
Airborne microplastic from source to deposition Data graphic
- Credit
- Nanoplastics Observatory
- License
- Site original terms pending
- Data
- S-052
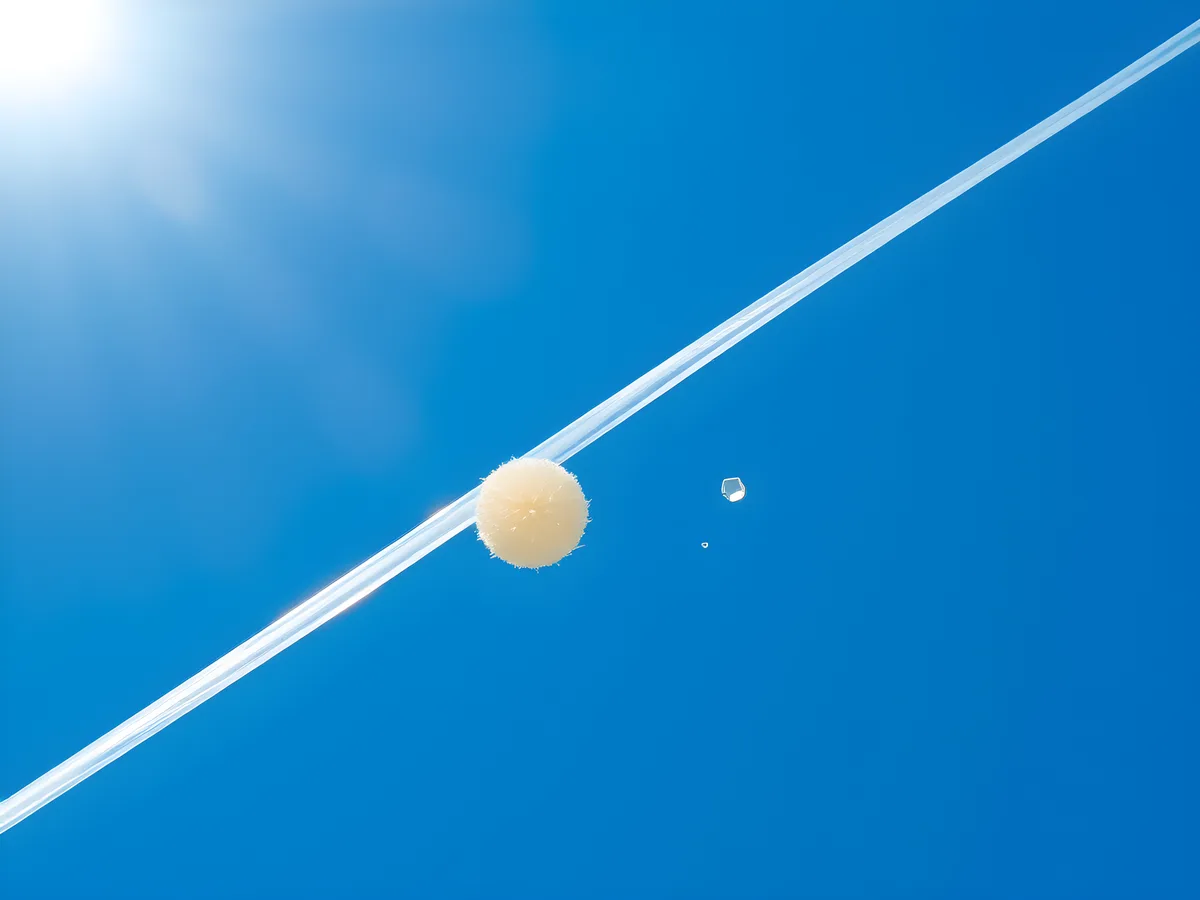
Fiber and pollen grain in daylight air (illustration) Illustration · AI generated
- Credit
- Site illustration (AI-generated, Flux)
- License
- Site original terms pending
- Made with
- FLUX.1-schnell (fp8, Comfy-Org/Flux-1-Schnell) · ComfyUI (local), tools/content/generate_l3.py
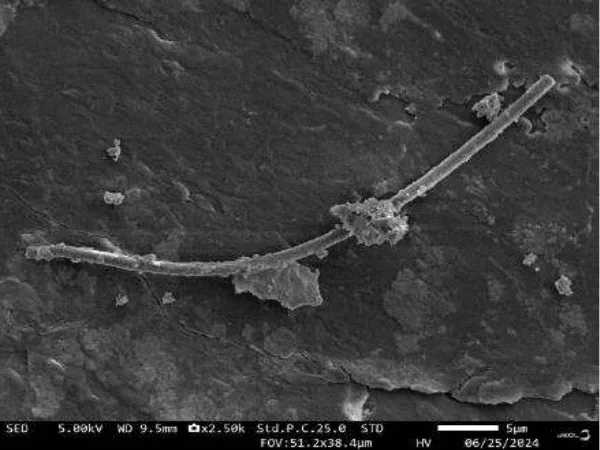
Corrections & Contact
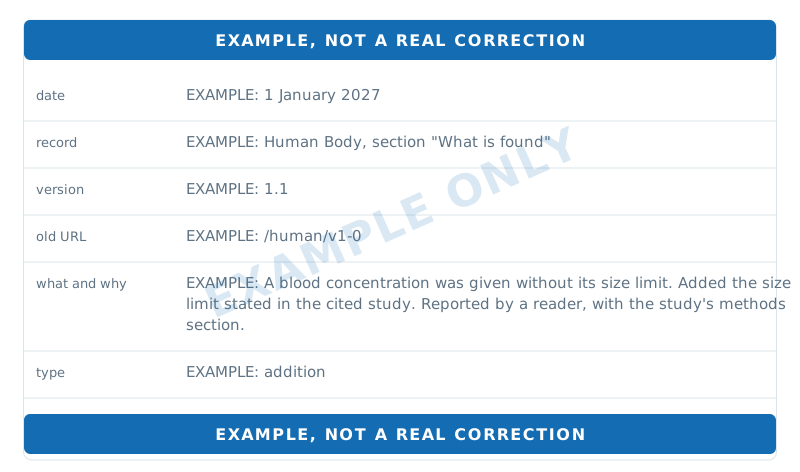
Example corrections log entry (not a real correction) Data graphic
- Credit
- Nanoplastics Observatory
- License
- Site original
- Data
- site-original

Report a correction (icon) Data graphic
- Credit
- Nanoplastics Observatory
- License
- Site original
- Data
- site-original
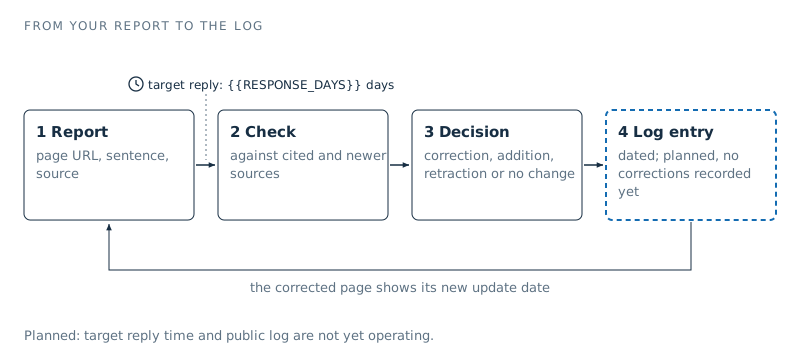
From a reader report to a dated corrections log entry Data graphic
- Credit
- Nanoplastics Observatory
- License
- Site original
- Data
- site-original
What Is Nanoplastic
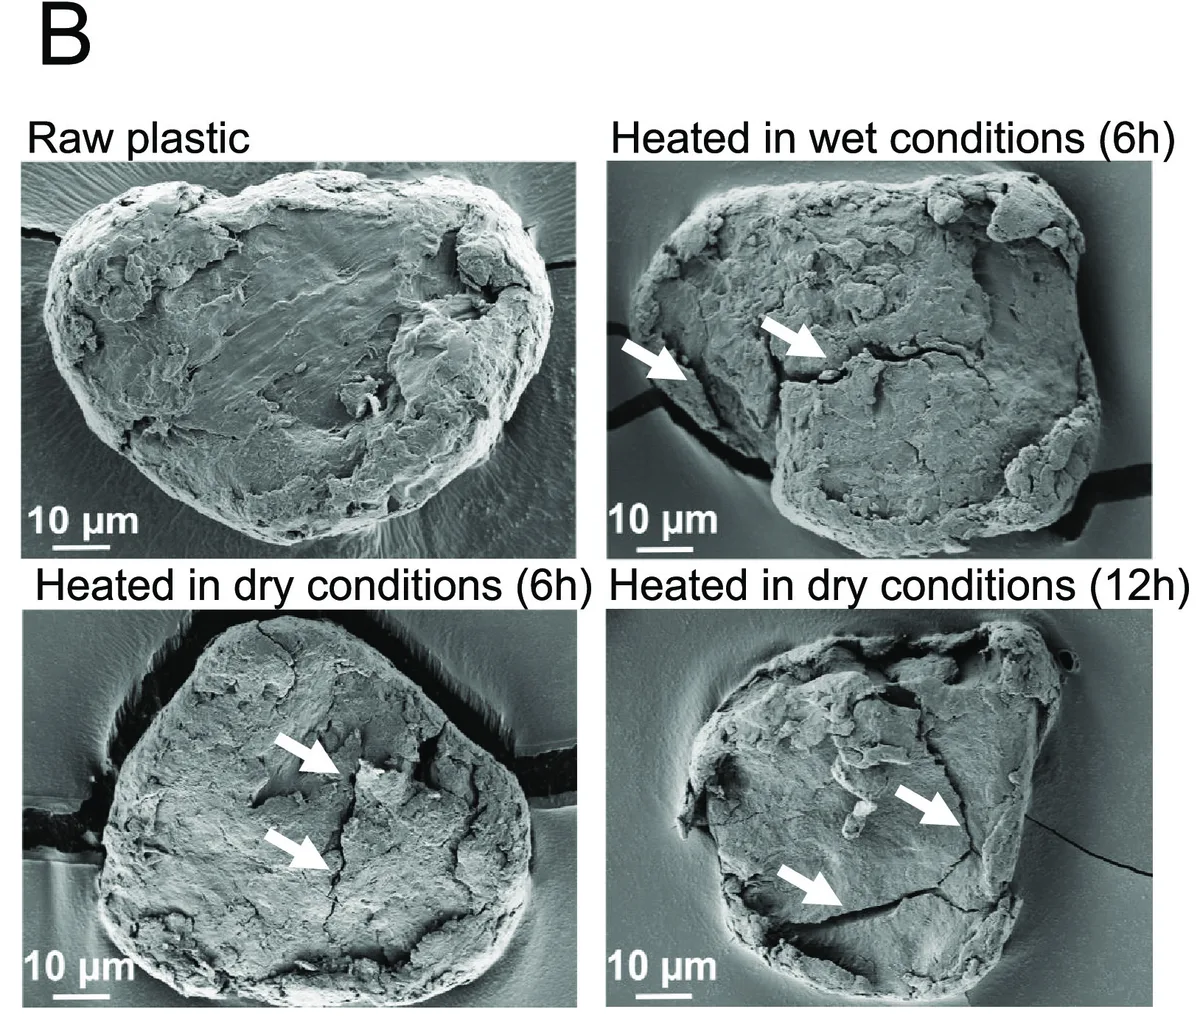
Figure 4B: HR-SEM of polystyrene particles before and after simulated thermal treatment Real image
- Credit
- Figure 4B from Sarkar A.K., Rubin A.E., Zucker I. (2021), Environmental Science & Technology 55(15):10491–10501, https://doi.org/10.1021/acs.est.1c02196 · CC BY 4.0 · cropped
- License
- CC BY 4.0
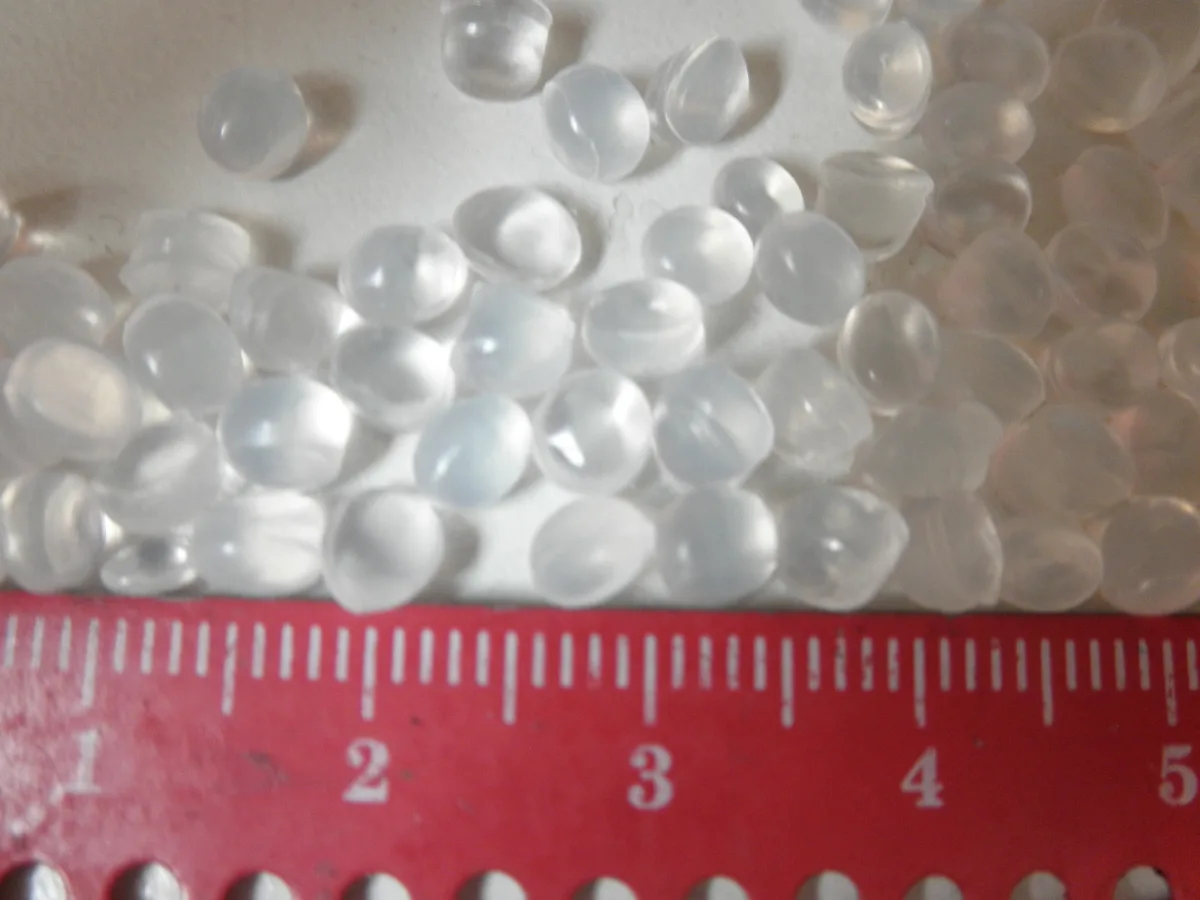
Polyethylene balls Real image
- Credit
- "Polyethylene balls5" by Lluis tgn, via Wikimedia Commons, CC BY-SA 3.0
- License
- CC BY-SA 3.0
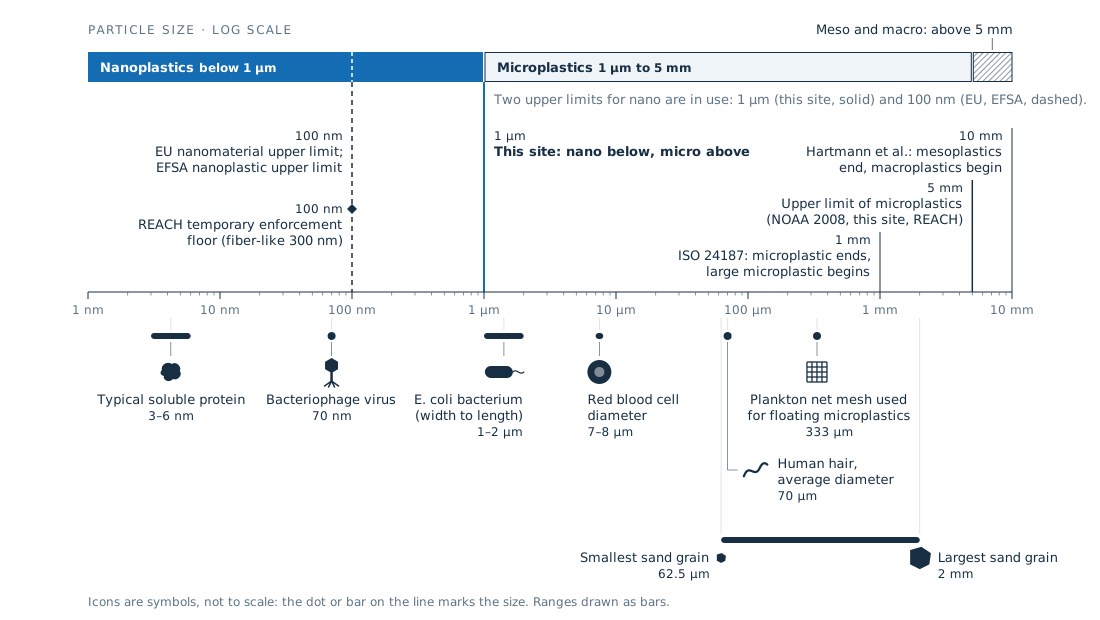
Where nanoplastics sit on the size scale Data graphic
- Credit
- Nanoplastics Observatory
- License
- Site original terms pending
- Data
- S-005
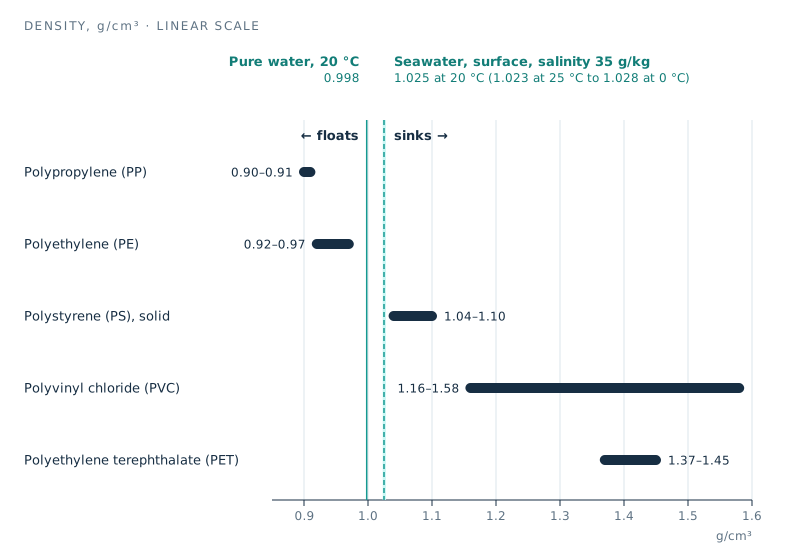
Common plastics by density, compared with water Data graphic
- Credit
- Nanoplastics Observatory
- License
- Site original terms pending
- Data
- S-221
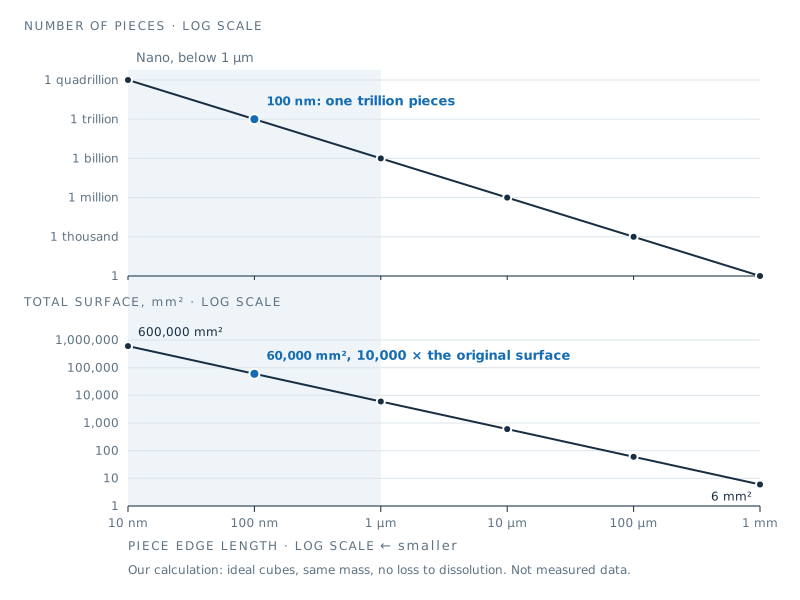
Same mass, smaller pieces: number and total surface of one 1 mm cube Data graphic
- Credit
- Nanoplastics Observatory
- License
- Site original terms pending
- Data
- S-017
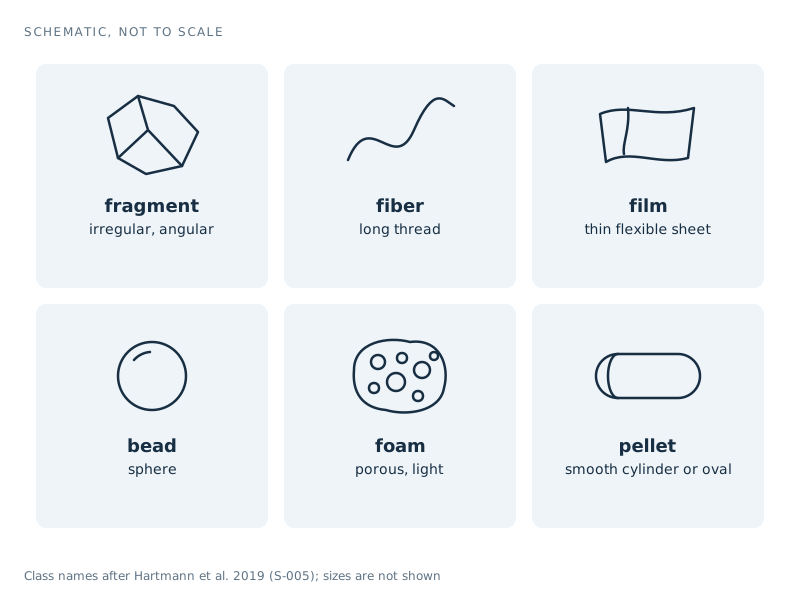
Six shape classes used to sort plastic particles Data graphic
- Credit
- Nanoplastics Observatory
- License
- Site original terms pending
- Data
- S-005
Events & Conferences
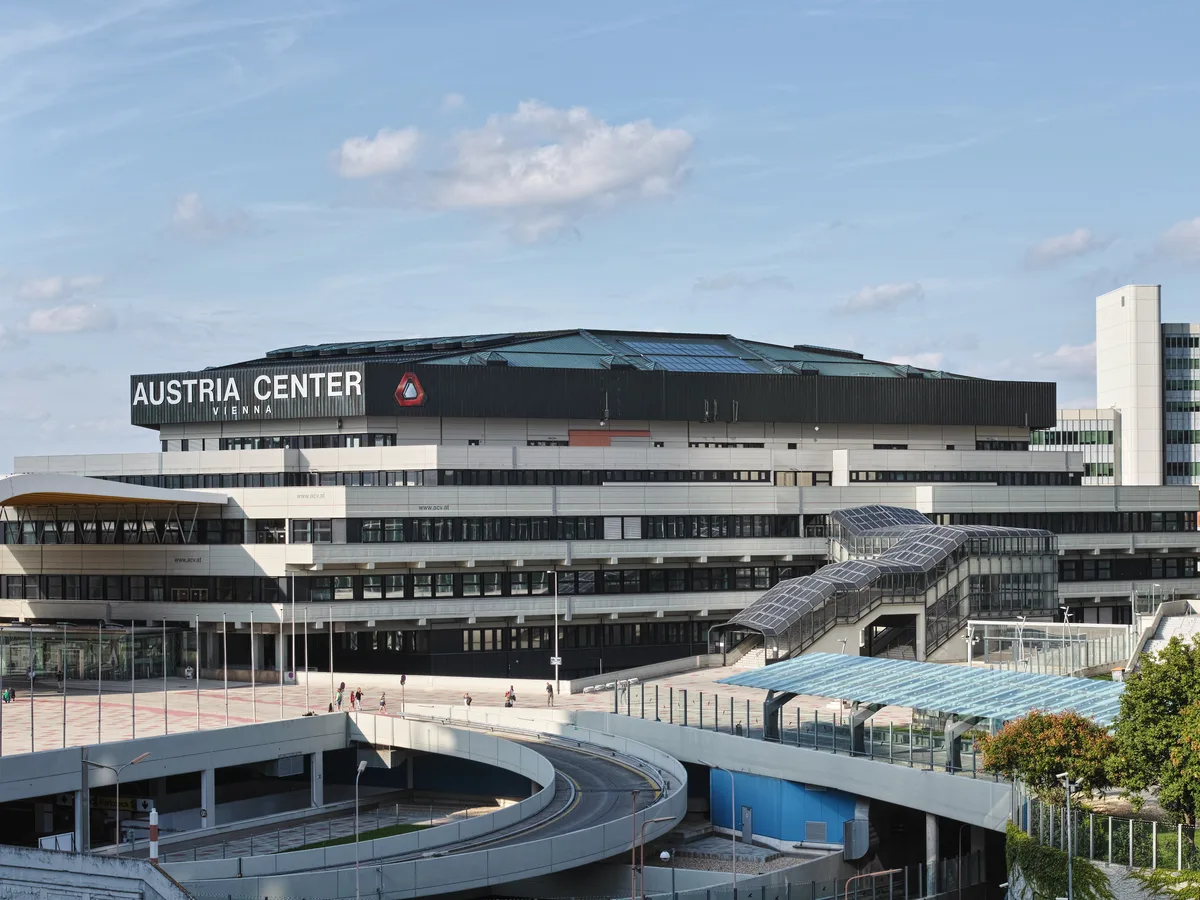
Austria Center Vienna from SSW on 2014-08-22 Real image
- Credit
- "Austria Center Vienna from SSW on 2014-08-22" by Robert F. Tobler, via Wikimedia Commons, CC BY-SA 4.0
- License
- CC BY-SA 4.0
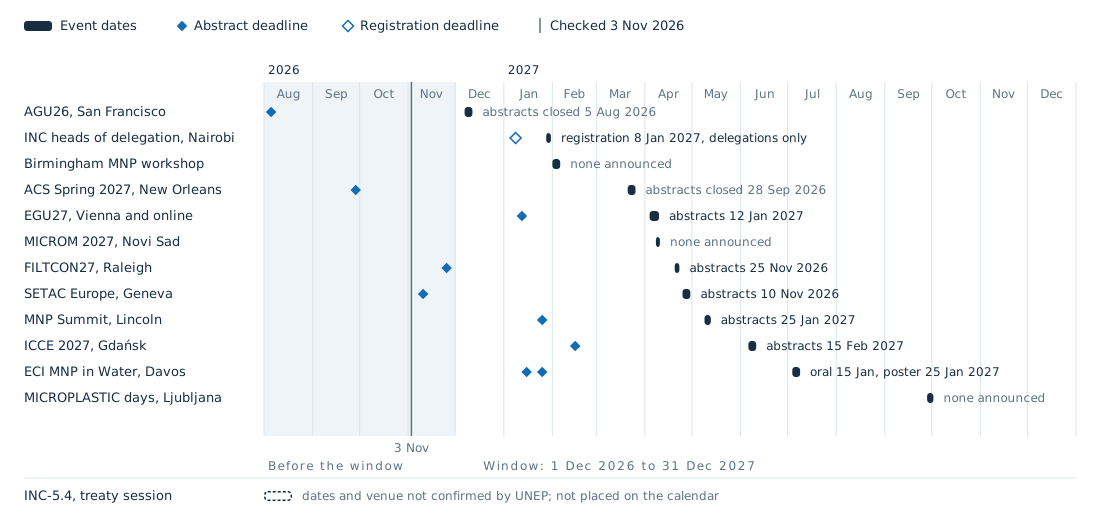
Micro- and nanoplastics events, December 2026 to December 2027 Data graphic
- Credit
- Nanoplastics Observatory
- License
- Site original
- Data
- S-152
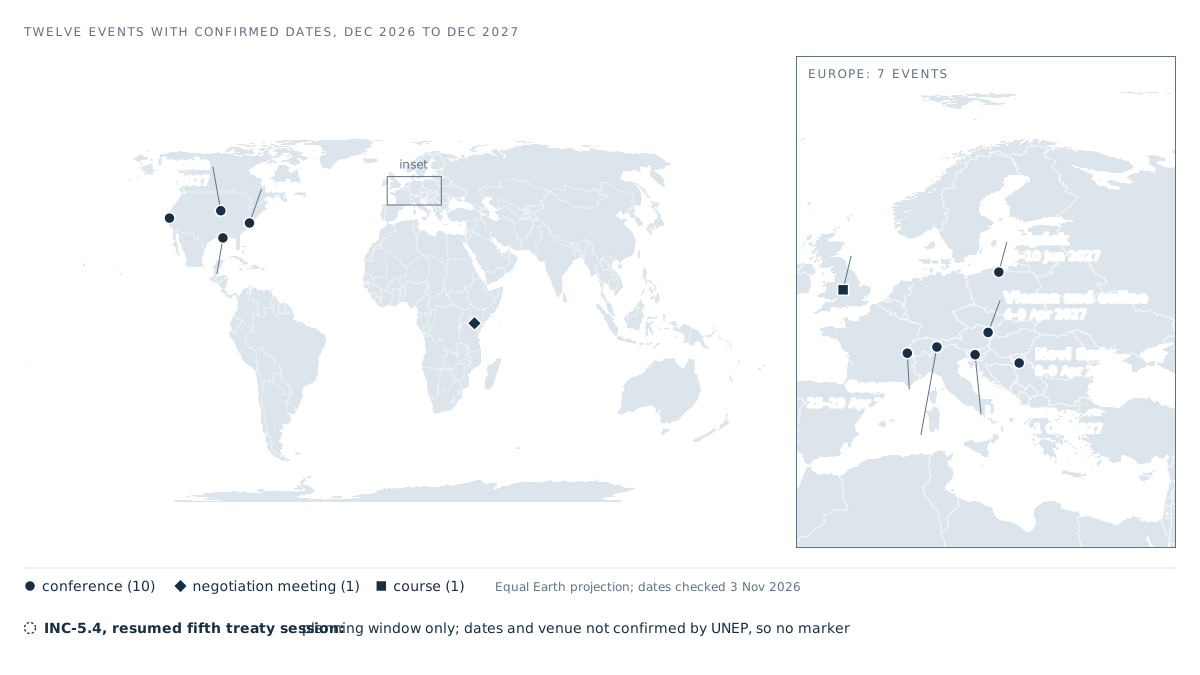
Where the twelve listed events meet, December 2026 to December 2027 Data graphic
- Credit
- Nanoplastics Observatory
- License
- Site original
- Data
- S-249

Event card template (example: EGU27, Vienna) Data graphic
- Credit
- Nanoplastics Observatory
- License
- Site original
- Data
- S-234
Evidence by Status
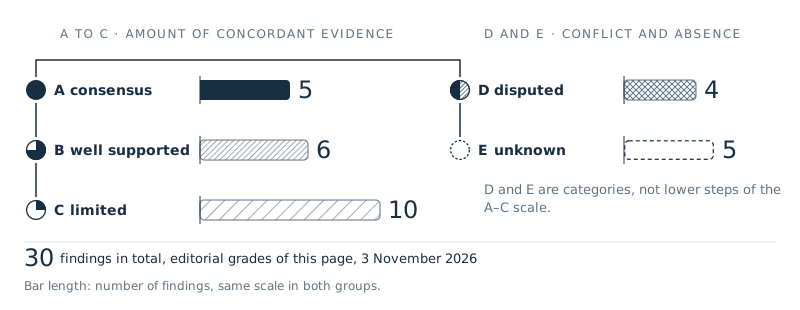
30 findings on the evidence ladder, 3 November 2026 Data graphic
- Credit
- Nanoplastics Observatory
- License
- Site original terms pending
- Data
- S-021
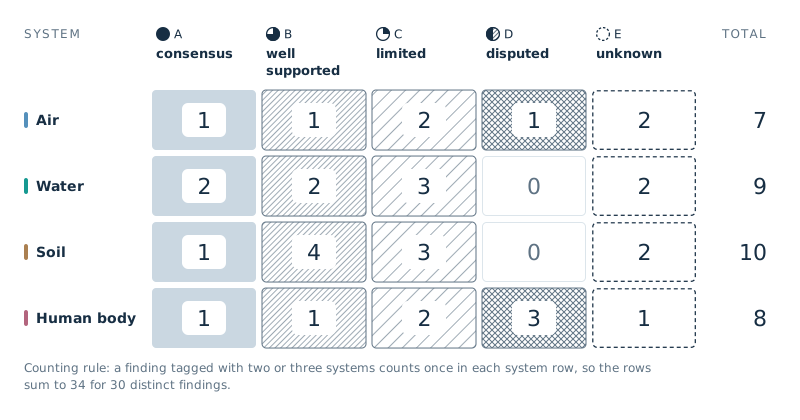
Findings by system and evidence level, 3 November 2026 Data graphic
- Credit
- Nanoplastics Observatory
- License
- Site original terms pending
- Data
- S-021
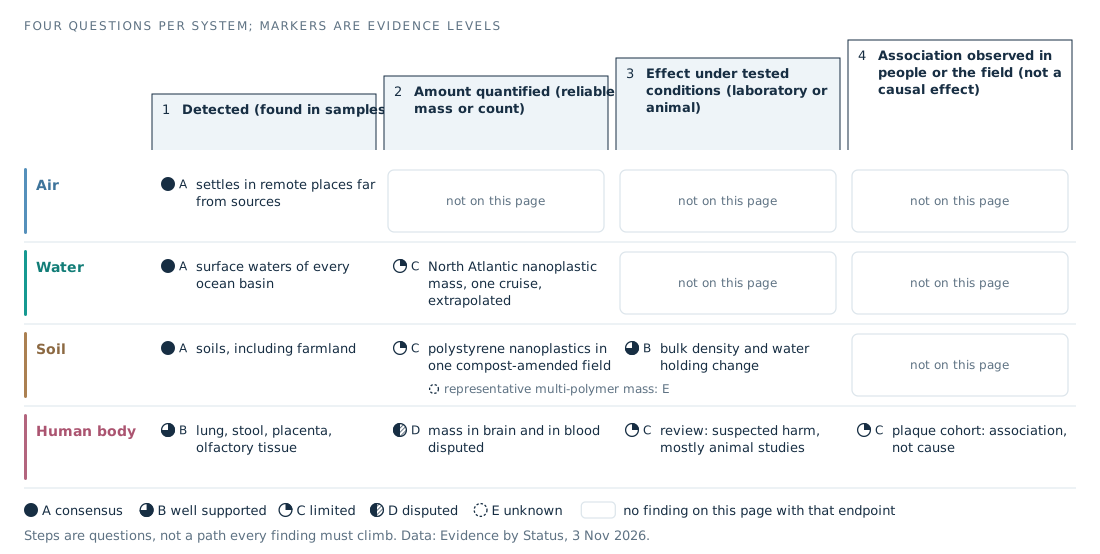
Where each system stands on four questions Data graphic
- Credit
- Nanoplastics Observatory
- License
- Site original terms pending
- Data
- S-021
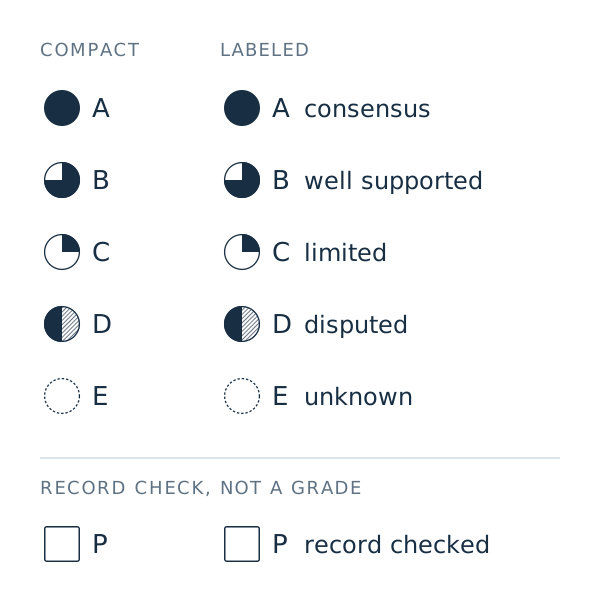
Evidence glyphs A to E and the provenance mark P Data graphic
- Credit
- Nanoplastics Observatory
- License
- Site original terms pending
- Data
- site-original

Particles in focus, out of focus and in darkness (illustration) Illustration · AI generated
- Credit
- Site illustration (AI-generated, Flux)
- License
- Site original terms pending
- Made with
- FLUX.1-schnell (fp8, Comfy-Org/Flux-1-Schnell) · ComfyUI (local), tools/content/generate_l3.py
Evidence by System
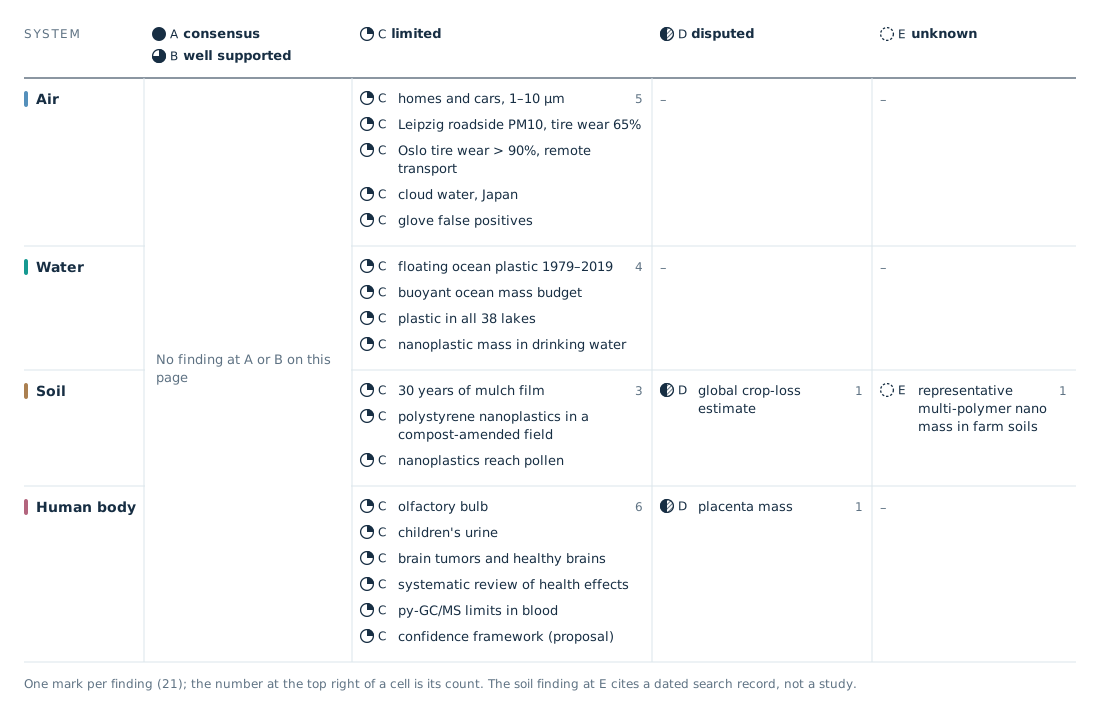
The findings on this page by system and evidence level Data graphic
- Credit
- Nanoplastics Observatory
- License
- Site original terms pending
- Data
- S-063
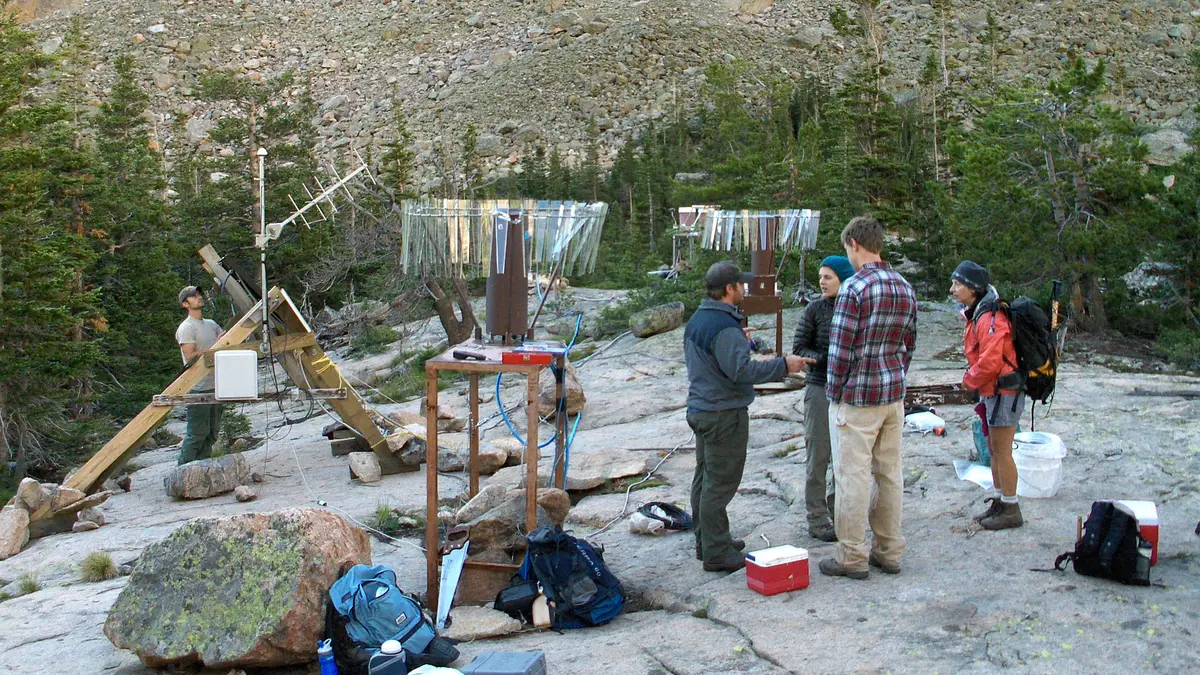
Atmospheric deposition monitoring site visit Real image
- Credit
- U.S. Geological Survey, Water Resources Mission Area
- License
- Public domain (US Gov)
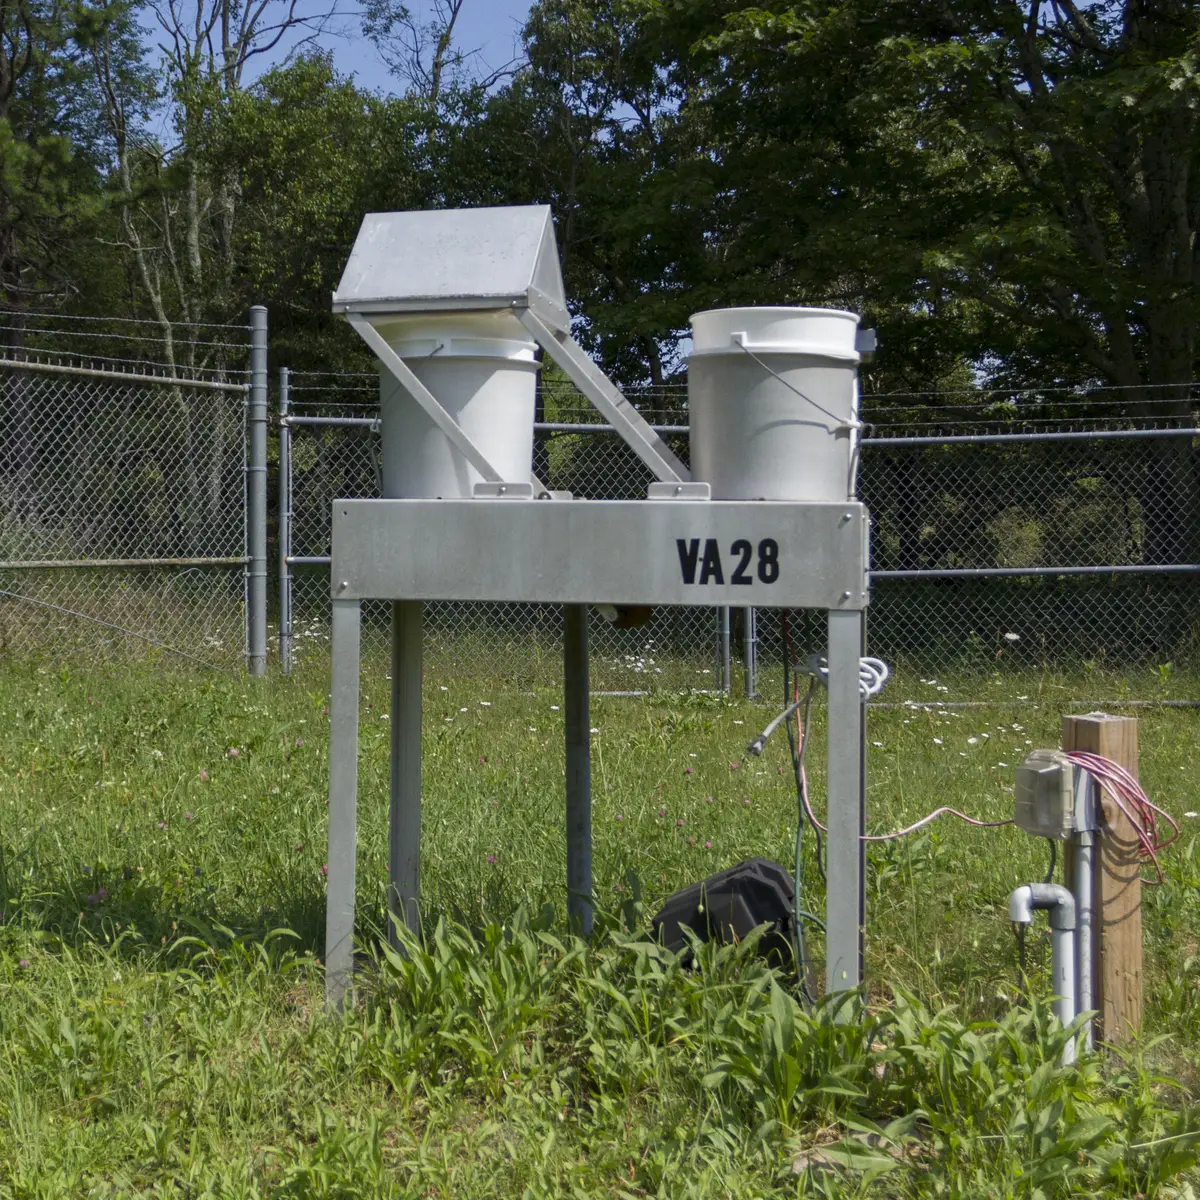
Atmospheric Wet Deposition Sampler (NADP.jpg) Real image
- Credit
- Mary O'Neill, National Park Service (NPGallery)
- License
- Public domain (US Gov)
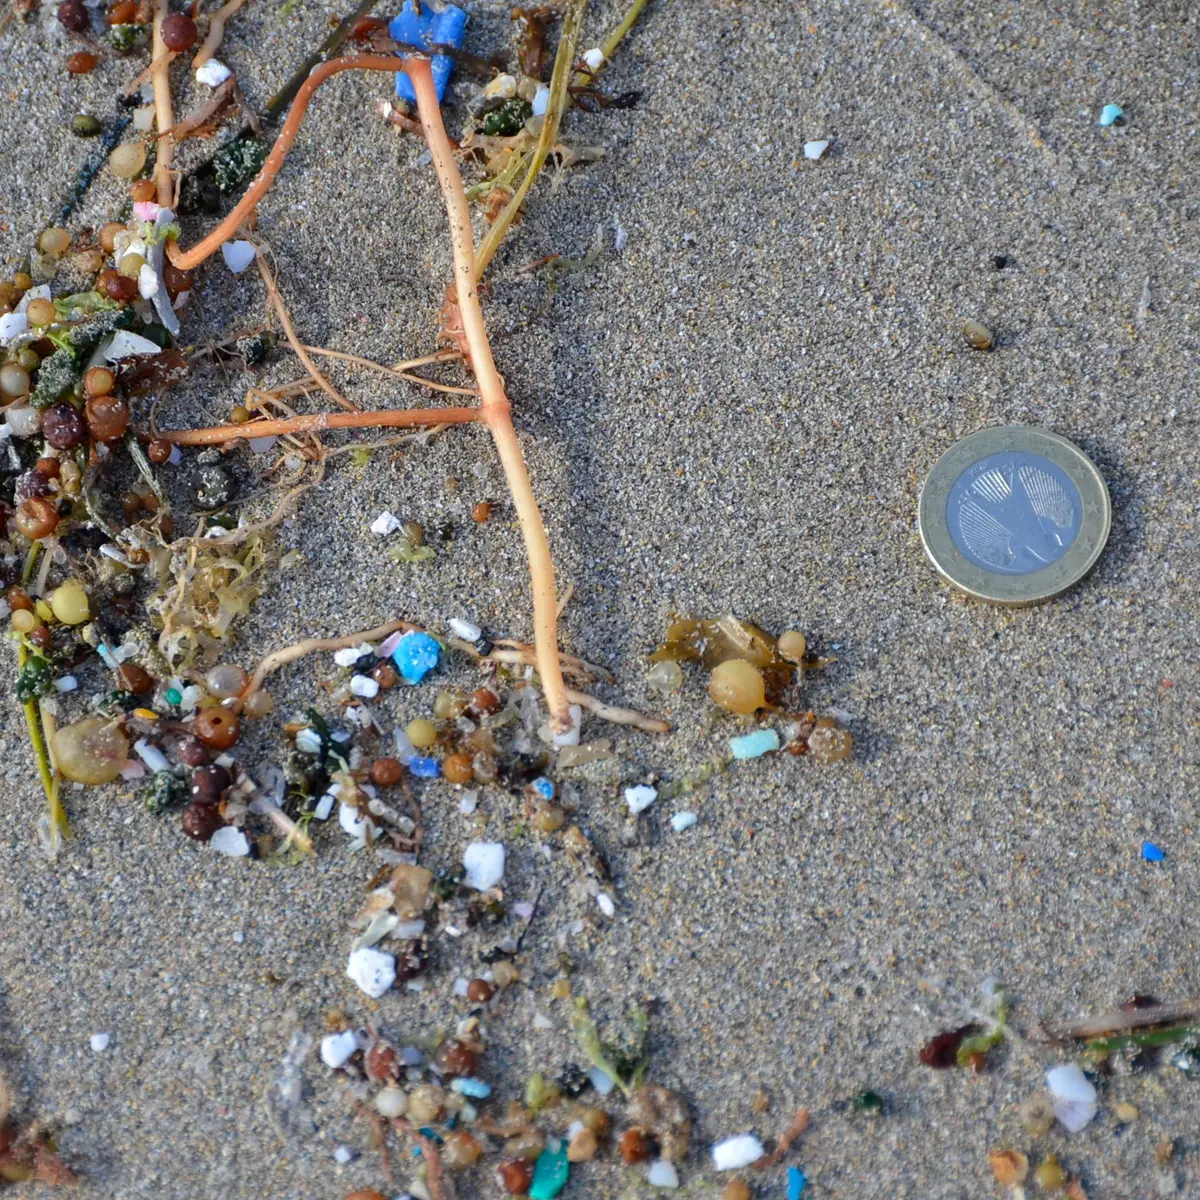
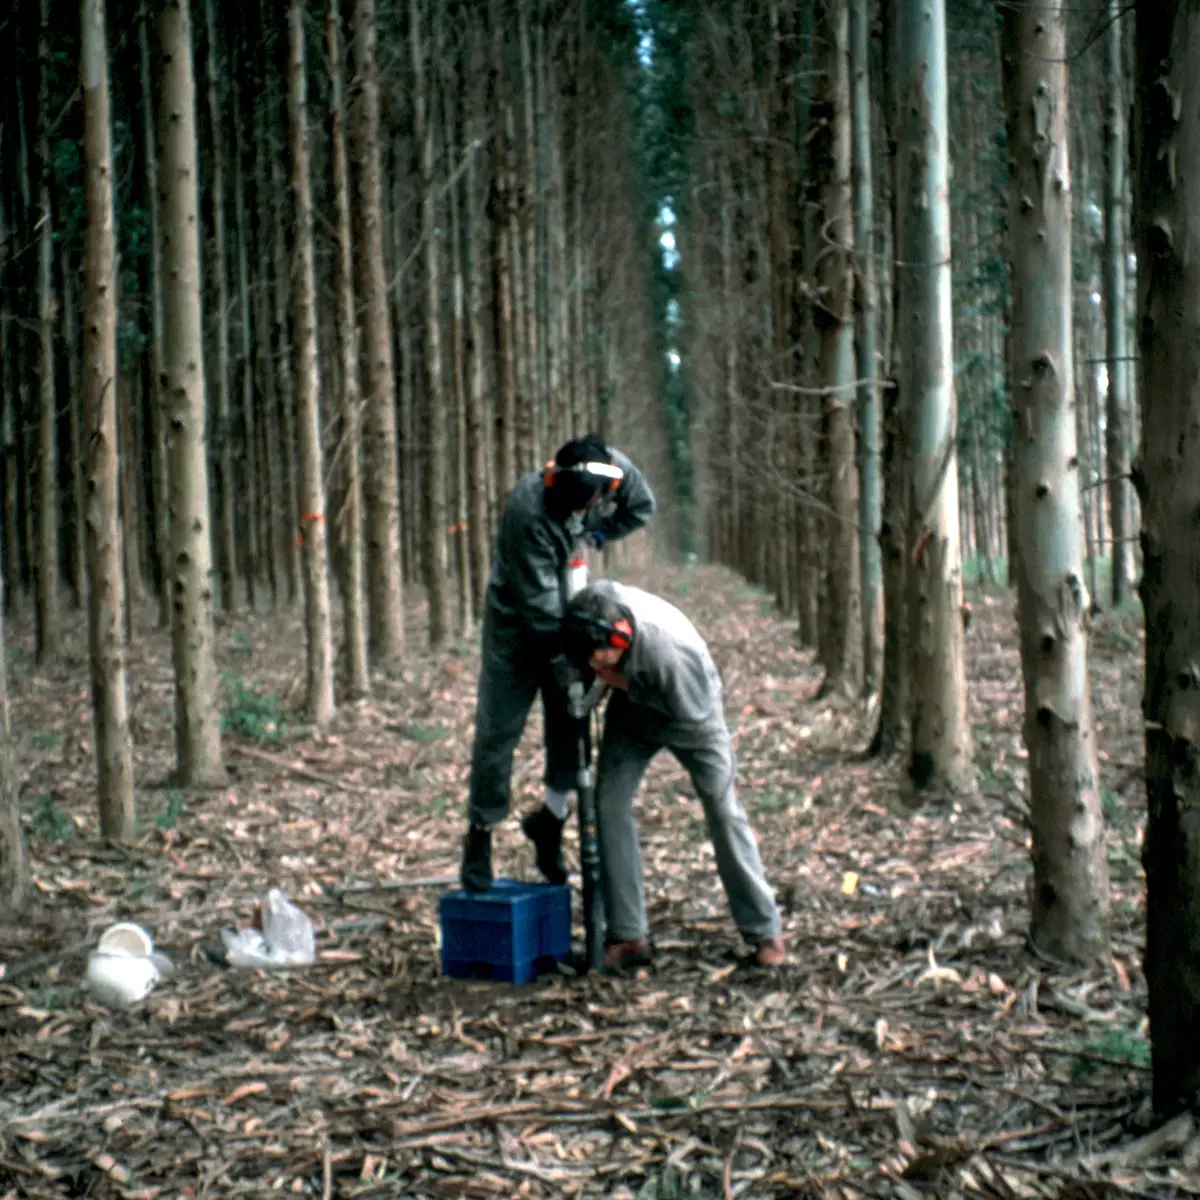
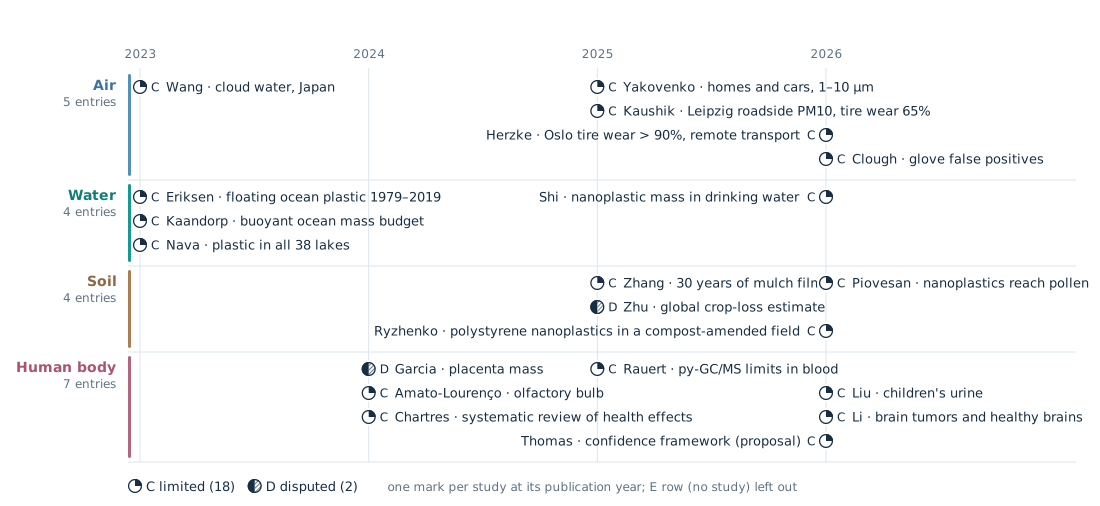
The studies on this page by year and system Data graphic
- Credit
- Nanoplastics Observatory
- License
- Site original terms pending
- Data
- S-063
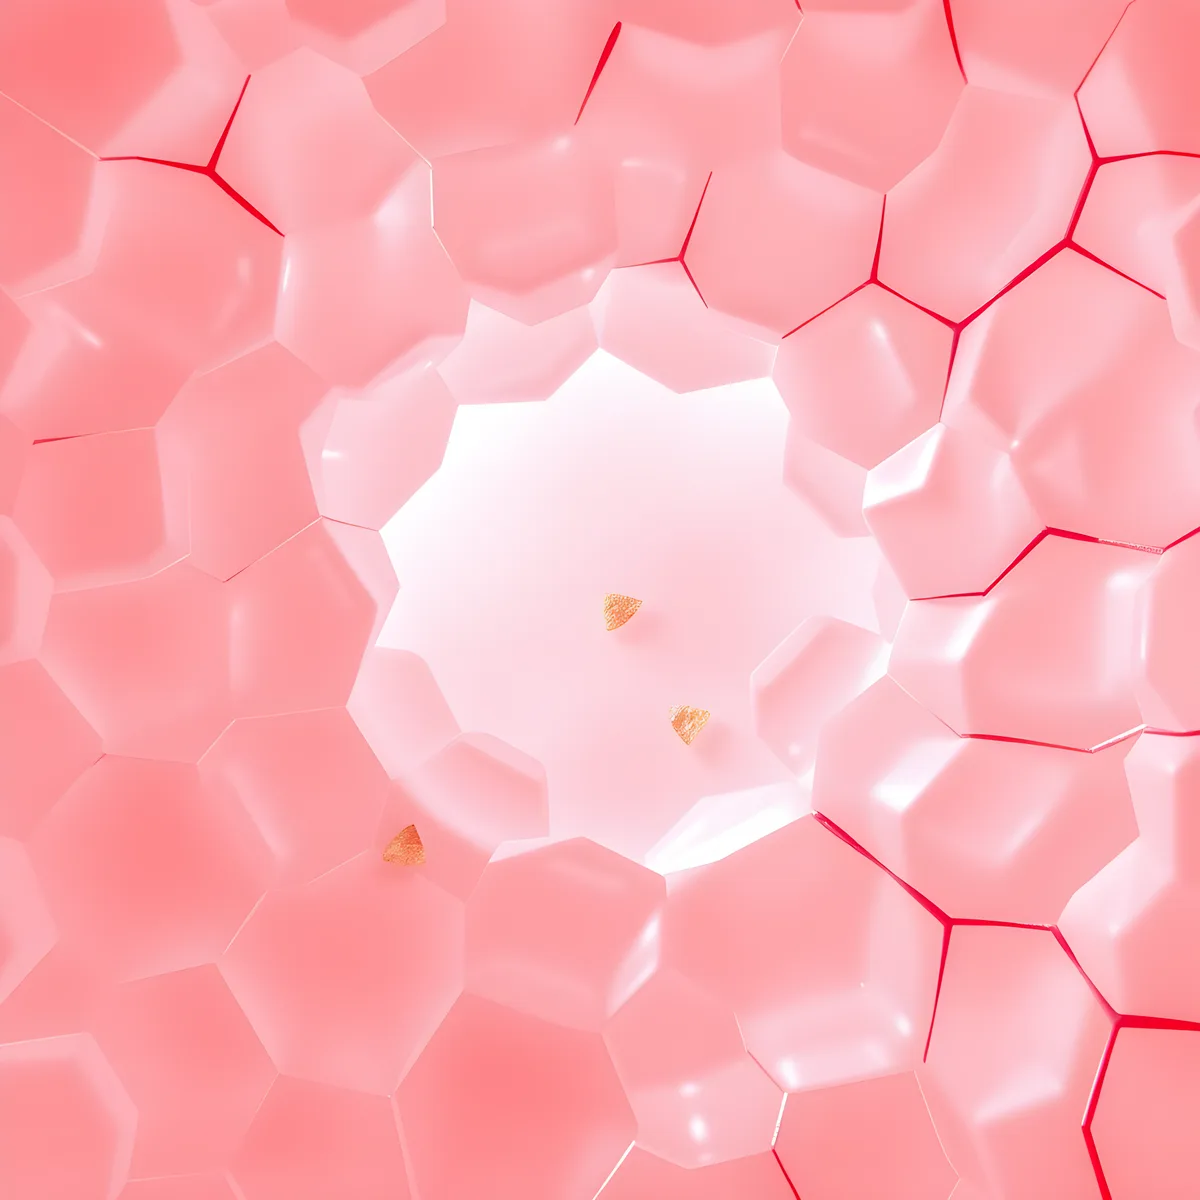
Lung air sacs with a few plastic fragments (illustration) Illustration · AI generated
- Credit
- Site illustration (AI-generated, Flux)
- License
- Site original terms pending
- Made with
- FLUX.1-schnell (fp8, Comfy-Org/Flux-1-Schnell) · ComfyUI (local), tools/content/generate_l3.py
Flows & Model
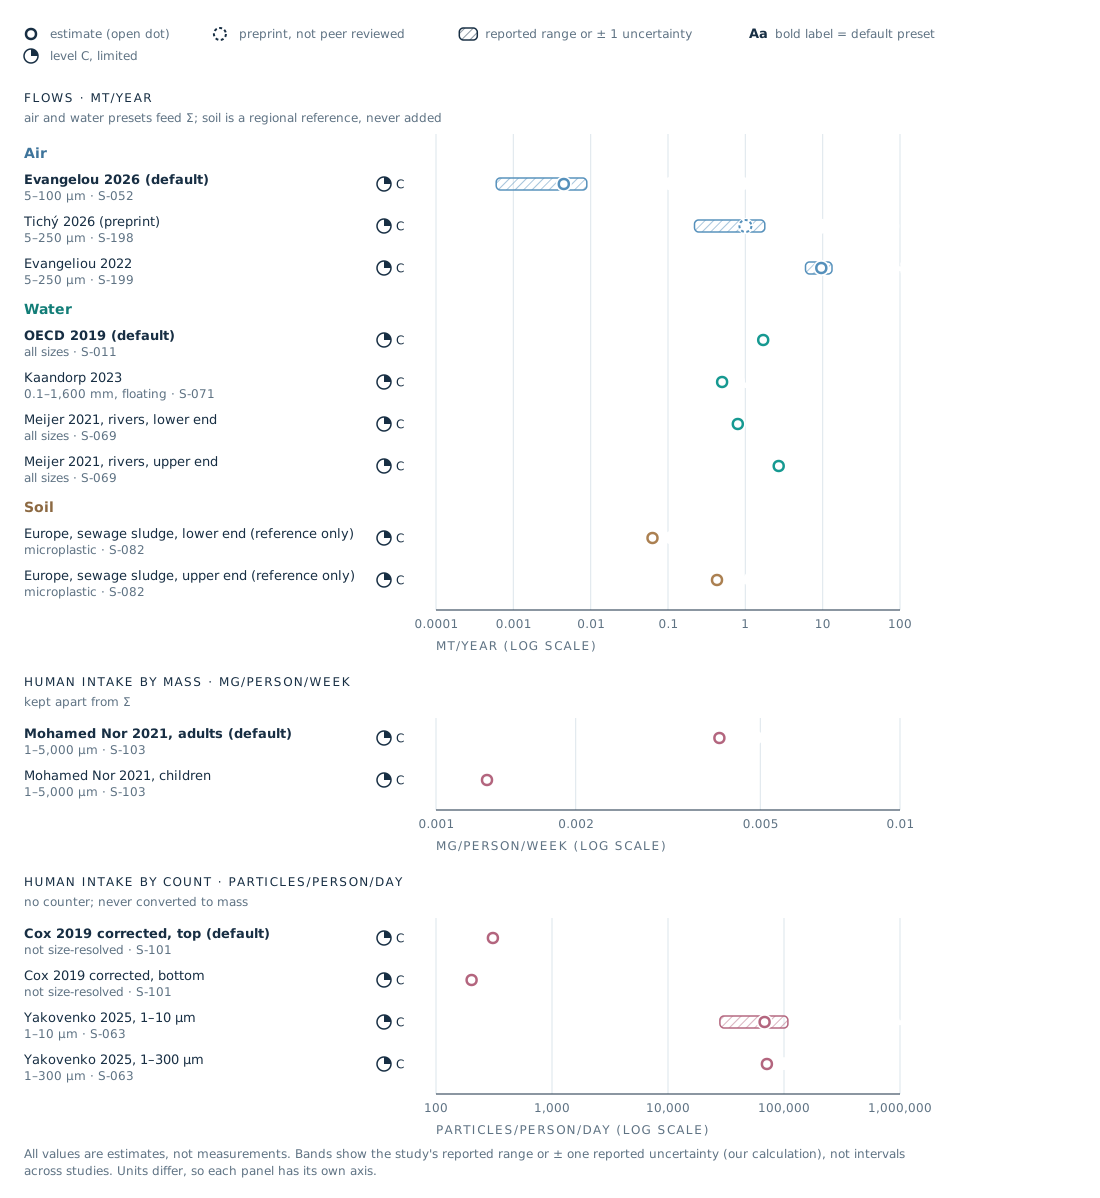
Every v7 preset on its own scale (log) Data graphic
- Credit
- Nanoplastics Observatory
- License
- Site original terms pending
- Data
- S-052
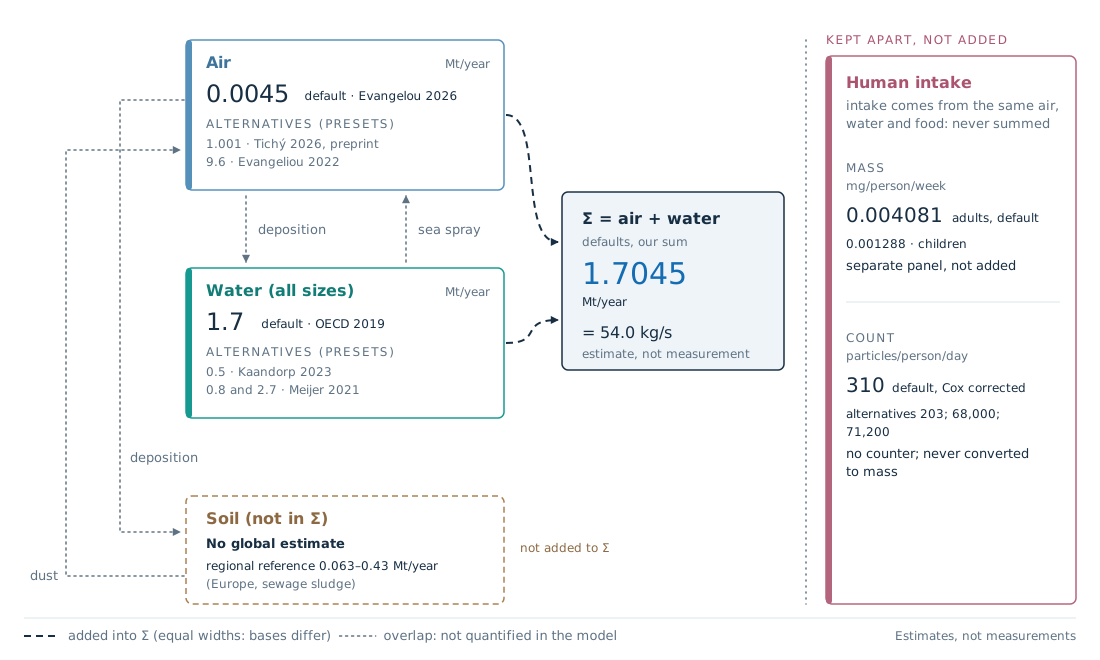
What the v7 counters add, and what they keep apart Data graphic
- Credit
- Nanoplastics Observatory
- License
- Site original terms pending
- Data
- S-011
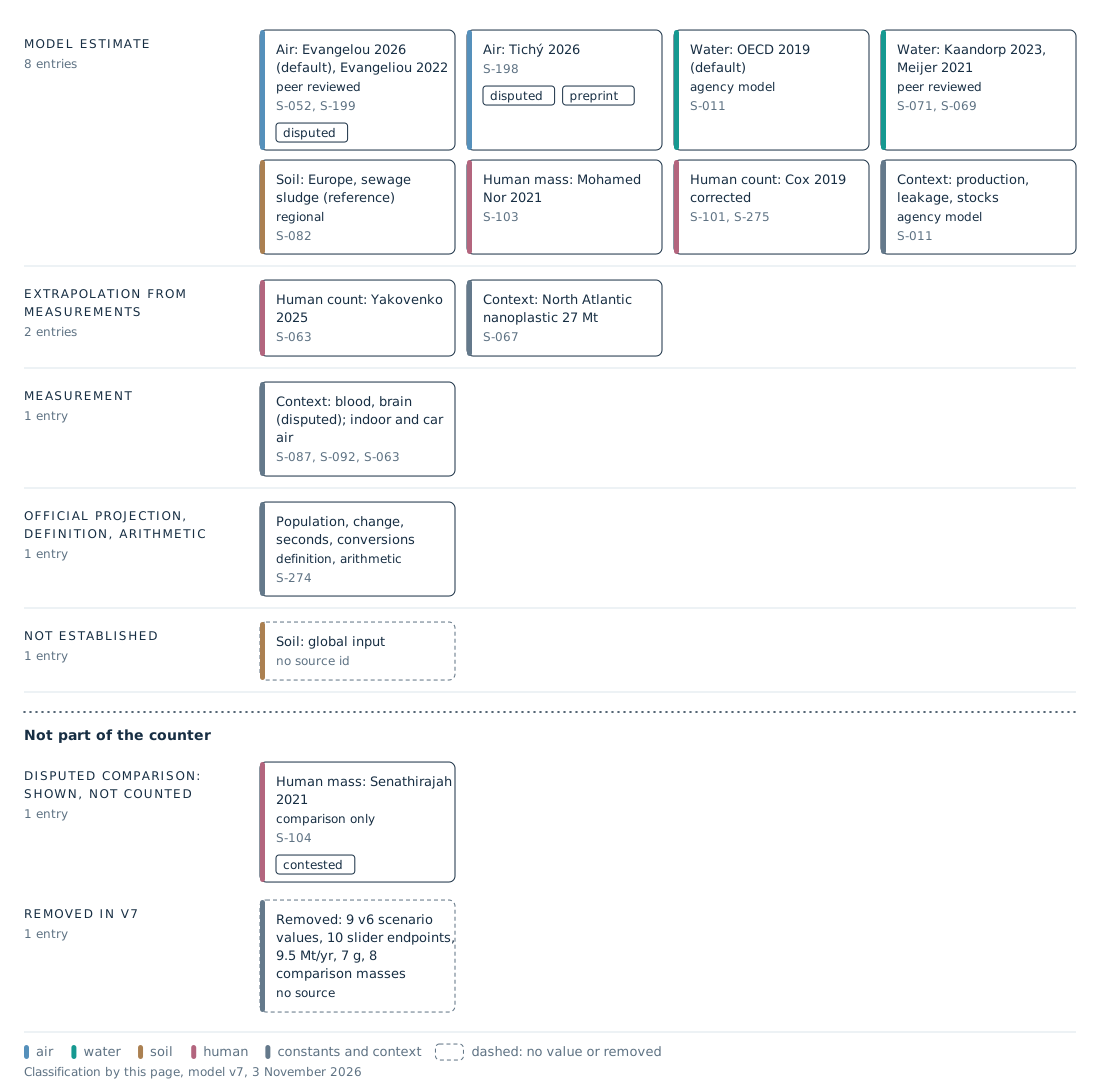
What kind of number is each v7 entry? Data graphic
- Credit
- Nanoplastics Observatory
- License
- Site original terms pending
- Data
- S-011
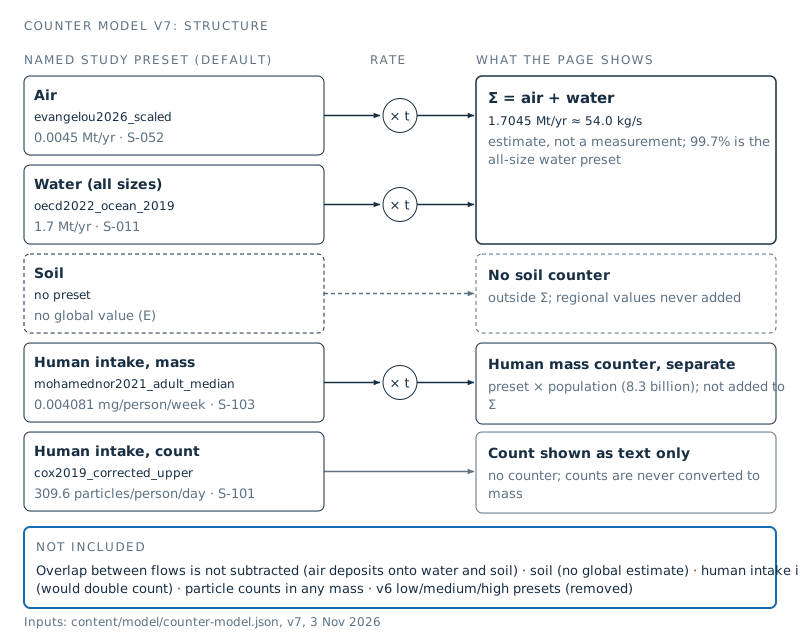
Structure of counter model v7 Data graphic
- Credit
- Nanoplastics Observatory
- License
- Site original terms pending
- Data
- S-276
Four Microworlds
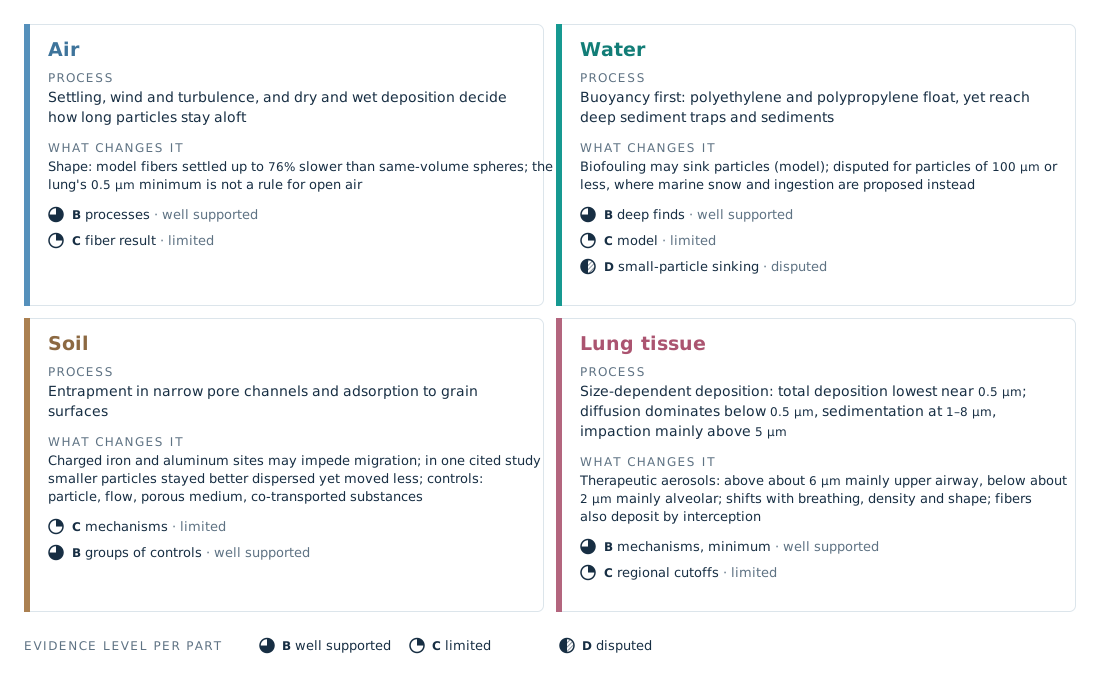
What controls particles in each microworld Data graphic
- Credit
- Nanoplastics Observatory
- License
- Site original terms pending
- Data
- S-281

Fibers and fragments in daylight air (illustration) Illustration · AI generated
- Credit
- Site illustration (AI-generated, Flux)
- License
- Site original terms pending
- Made with
- FLUX.1-schnell (fp8, Comfy-Org/Flux-1-Schnell) · ComfyUI (local), tools/content/generate_l3.py
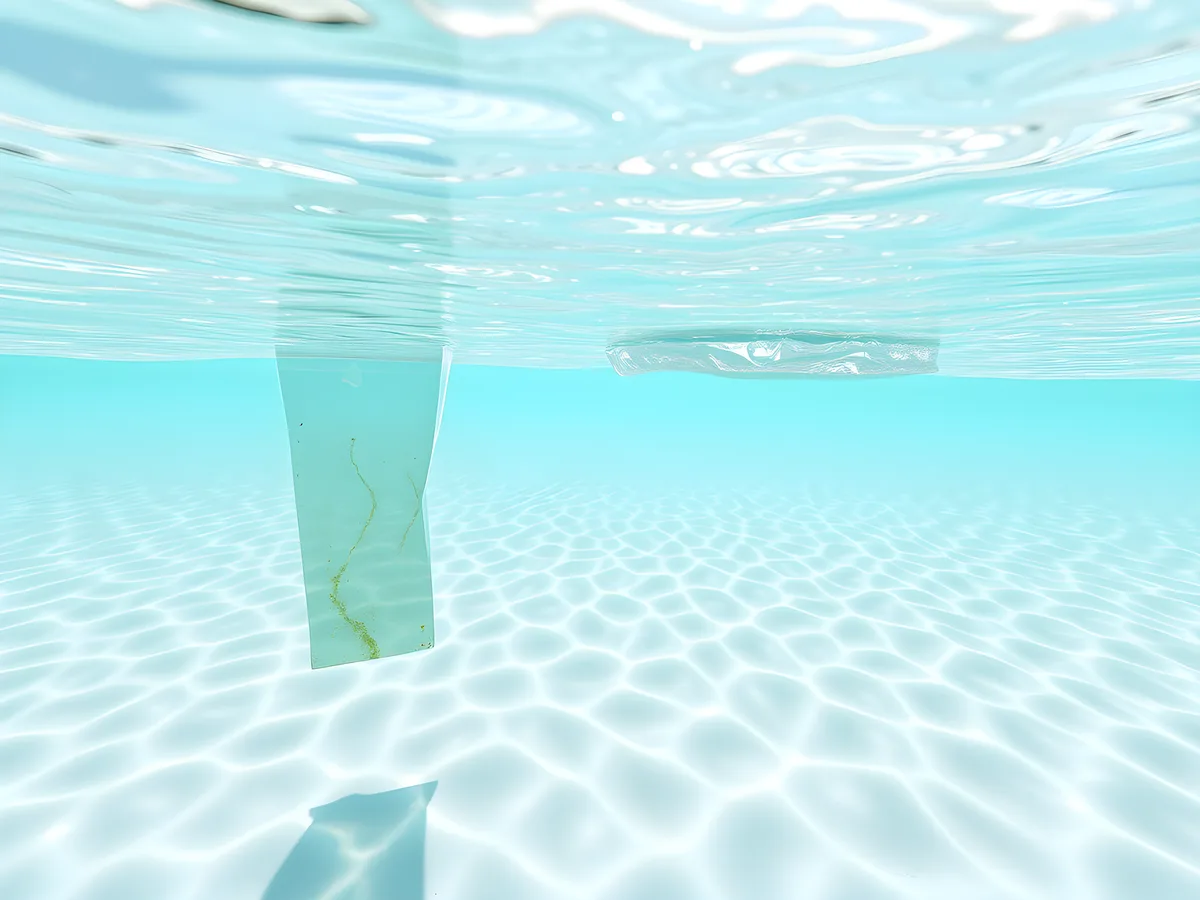
Floating and sinking films in sunlit shallows (illustration) Illustration · AI generated
- Credit
- Site illustration (AI-generated, Flux)
- License
- Site original terms pending
- Made with
- FLUX.1-schnell (fp8, Comfy-Org/Flux-1-Schnell) · ComfyUI (local), tools/content/generate_l3.py
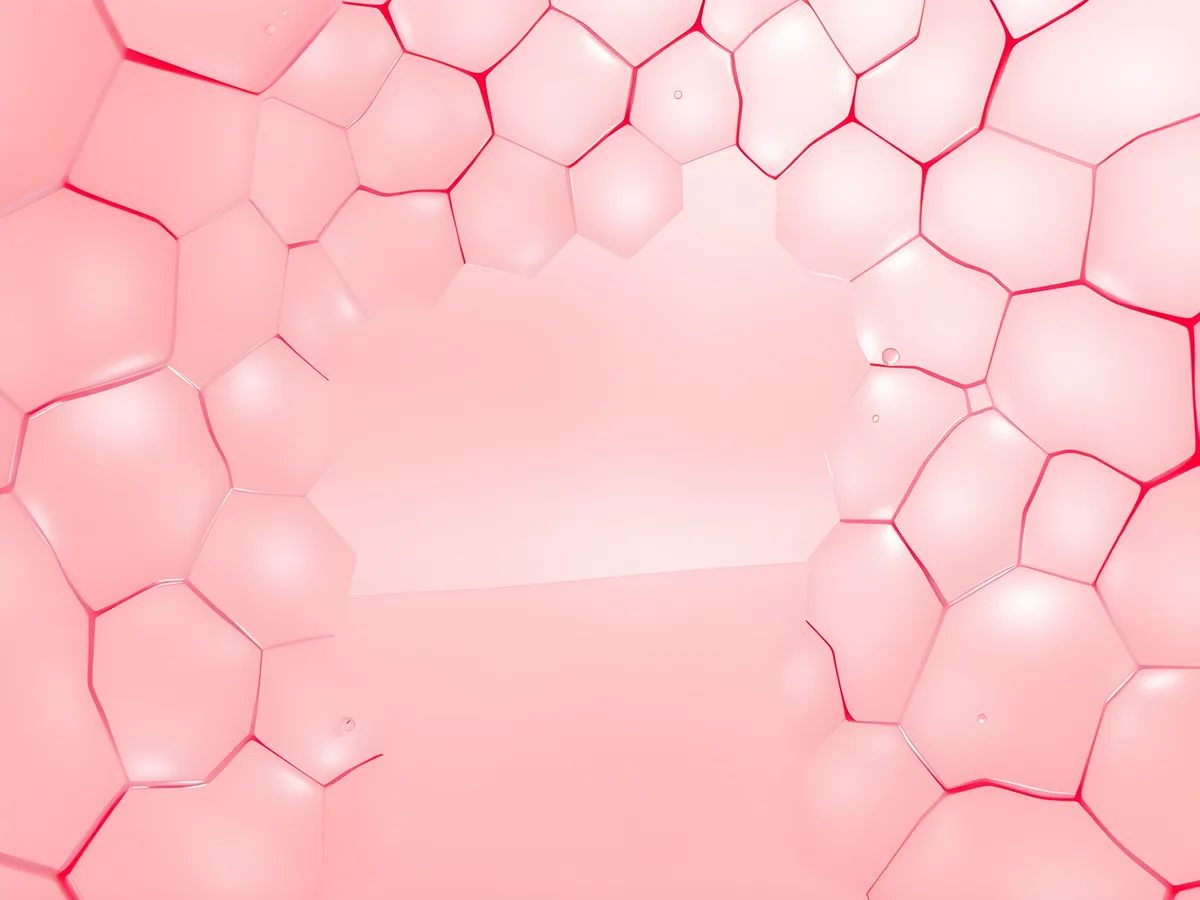
Lung air sacs with capillaries (illustration) Illustration · AI generated
- Credit
- Site illustration (AI-generated, Flux)
- License
- Site original terms pending
- Made with
- FLUX.1-schnell (fp8, Comfy-Org/Flux-1-Schnell) · ComfyUI (local), tools/content/generate_l3.py
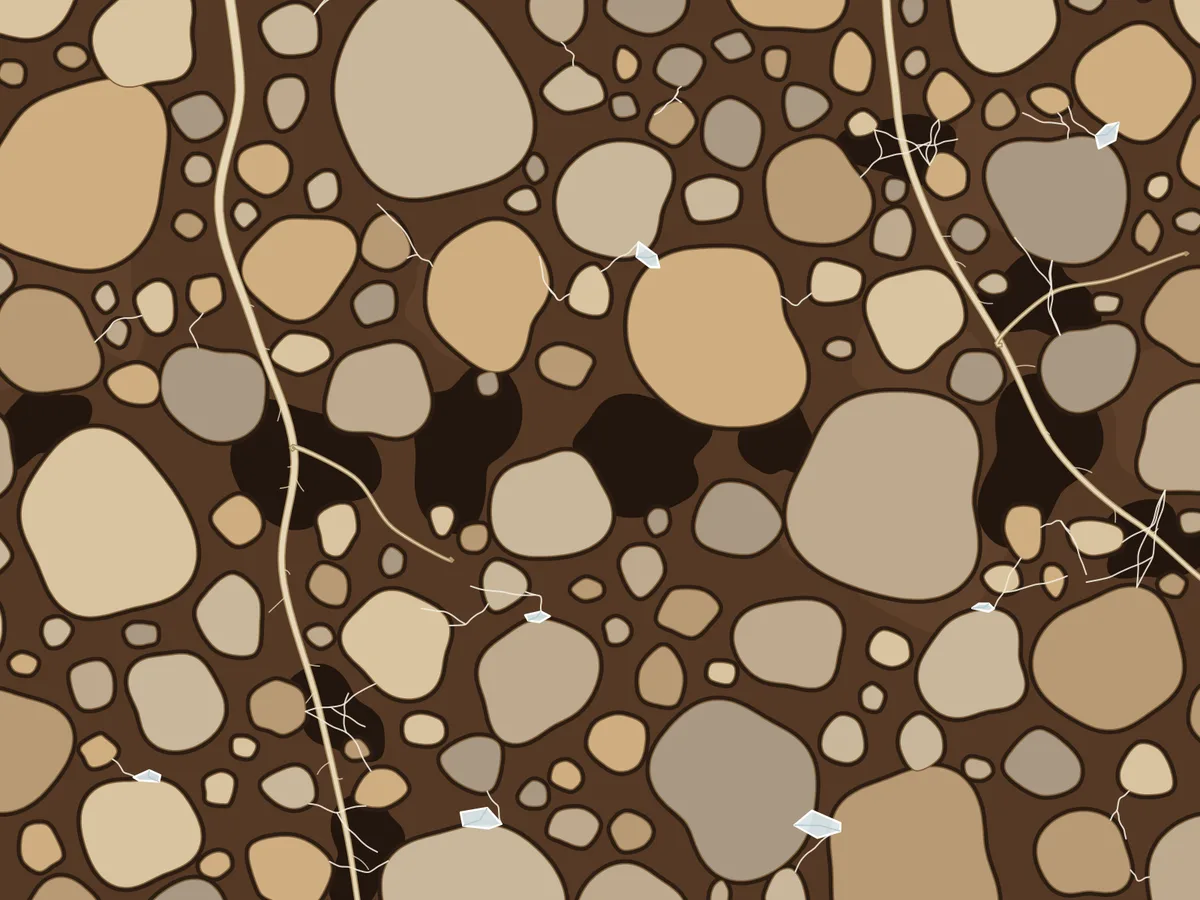
Soil cross-section: fragments held in pores between grains, roots and fungal threads Illustration
- Credit
- Graphic: Nanoplastics Observatory
- License
- Site original terms pending
- Data
- site-original
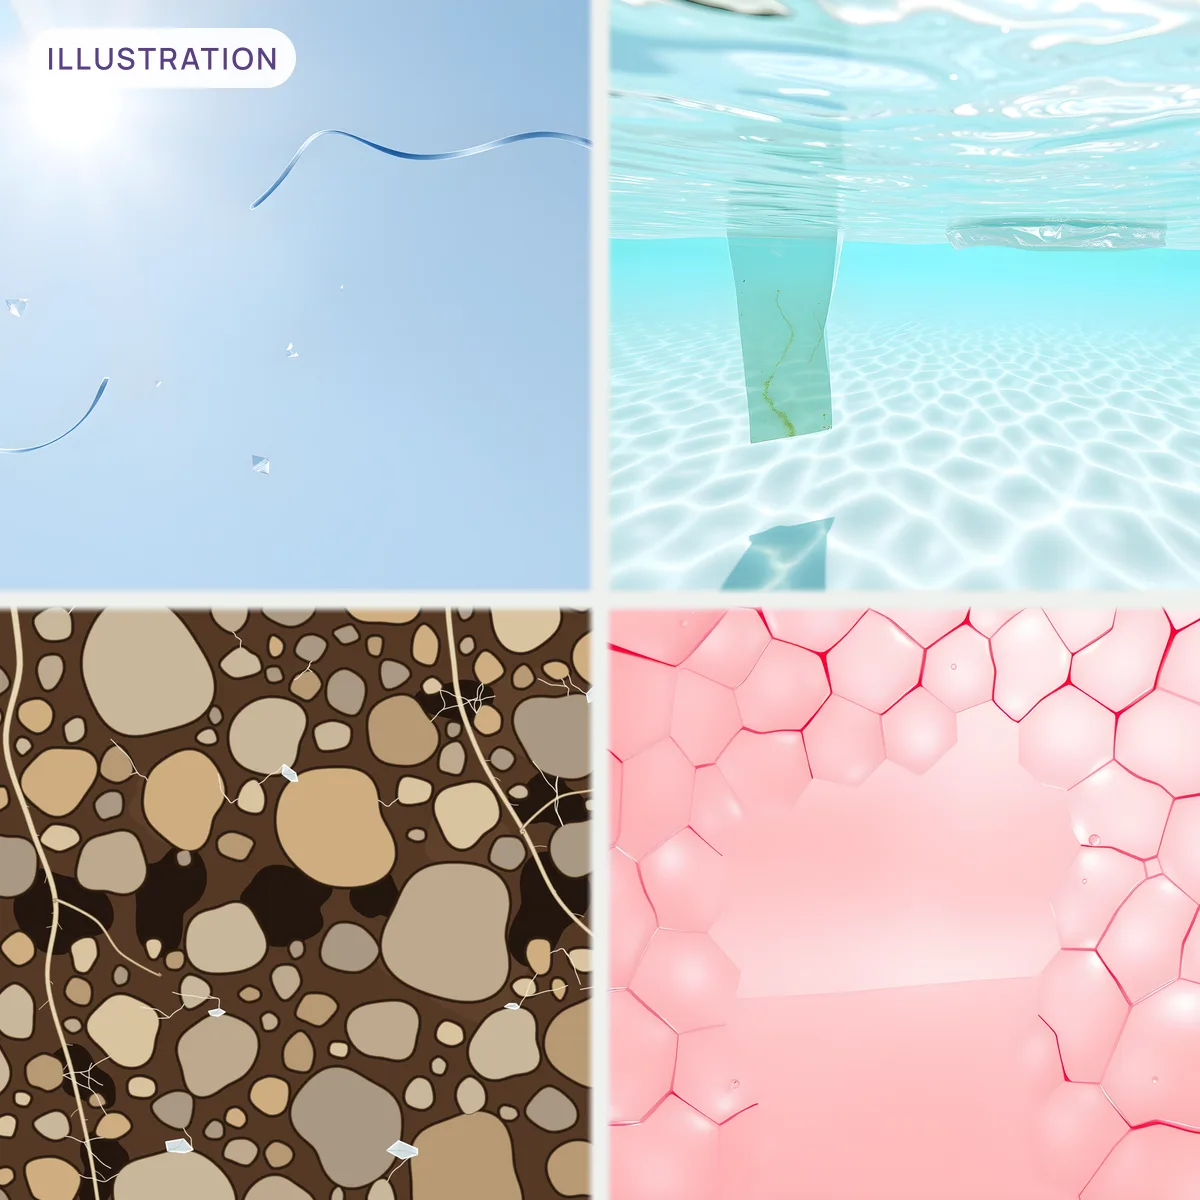
The four microworlds (card) Illustration · AI generated
- Credit
- Air, water and lung tiles: Site illustration (AI-generated, Flux). Soil tile: Graphic: Nanoplastics Observatory. Card: Nanoplastics Observatory.
- License
- Site original terms pending
- Made with
- FLUX.1-schnell (fp8) for the air, water and lung tiles; the soil tile is a vector diagram (no model)
Knowledge Gaps
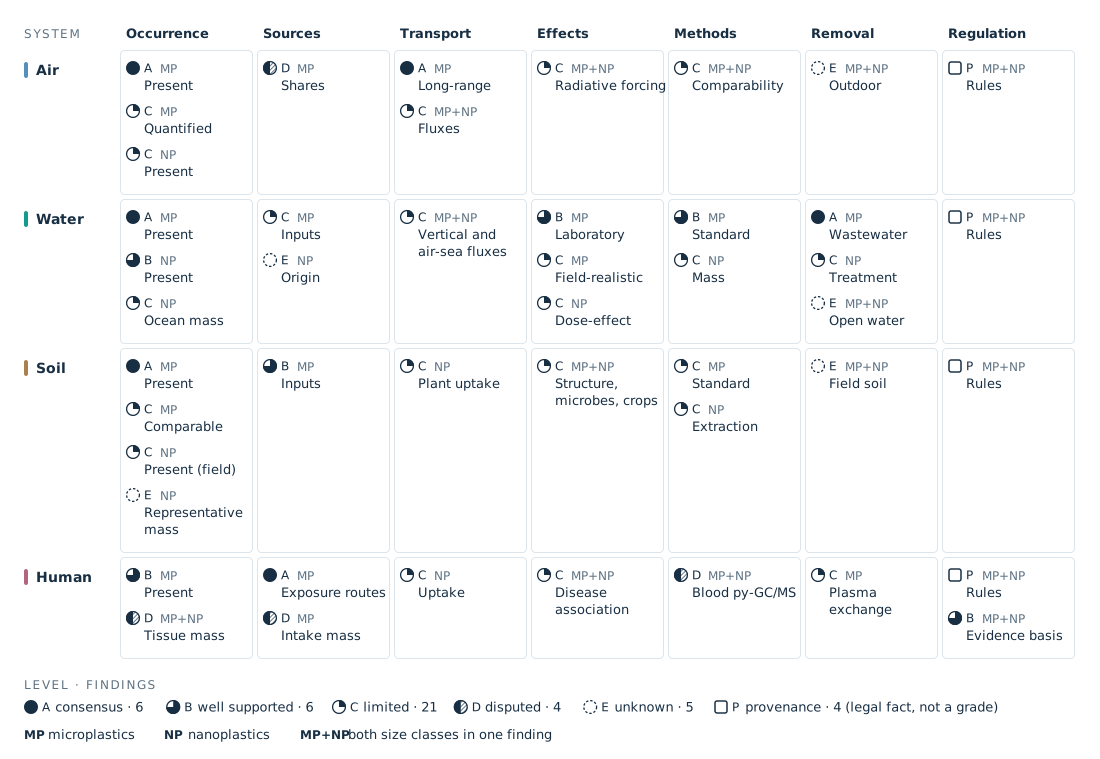
Knowledge map: evidence level of each finding, by system and question Data graphic
- Credit
- Nanoplastics Observatory
- License
- Site original terms pending
- Data
- S-021
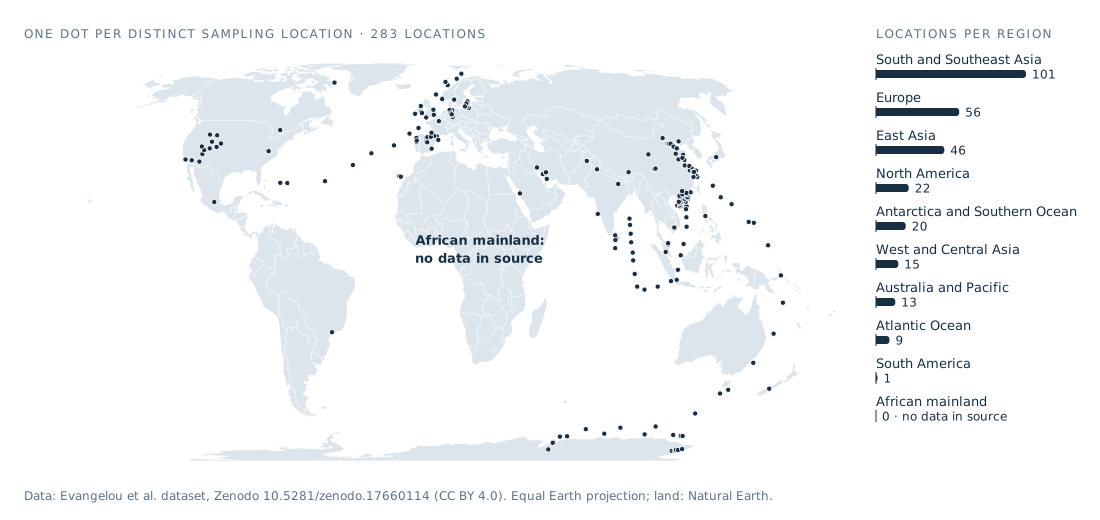
Where airborne microplastics have been measured Data graphic
- Credit
- Nanoplastics Observatory
- License
- Site original terms pending
- Data
- S-285
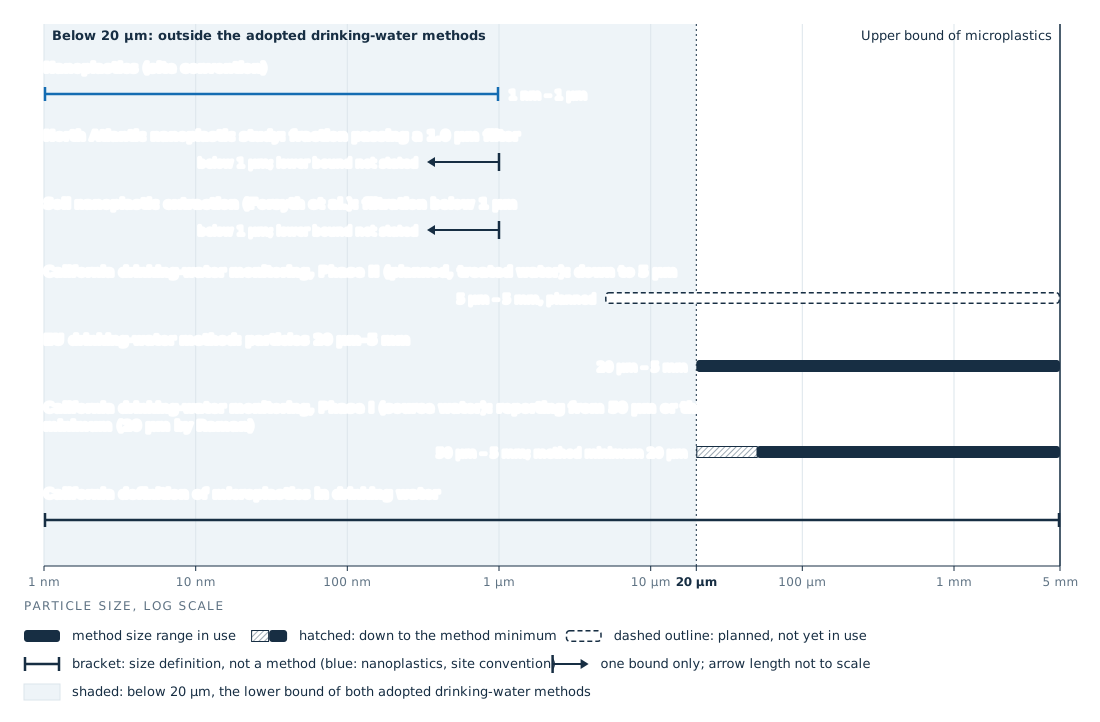
Which particle sizes current methods and rules cover Data graphic
- Credit
- Nanoplastics Observatory
- License
- Site original terms pending
- Data
- S-132
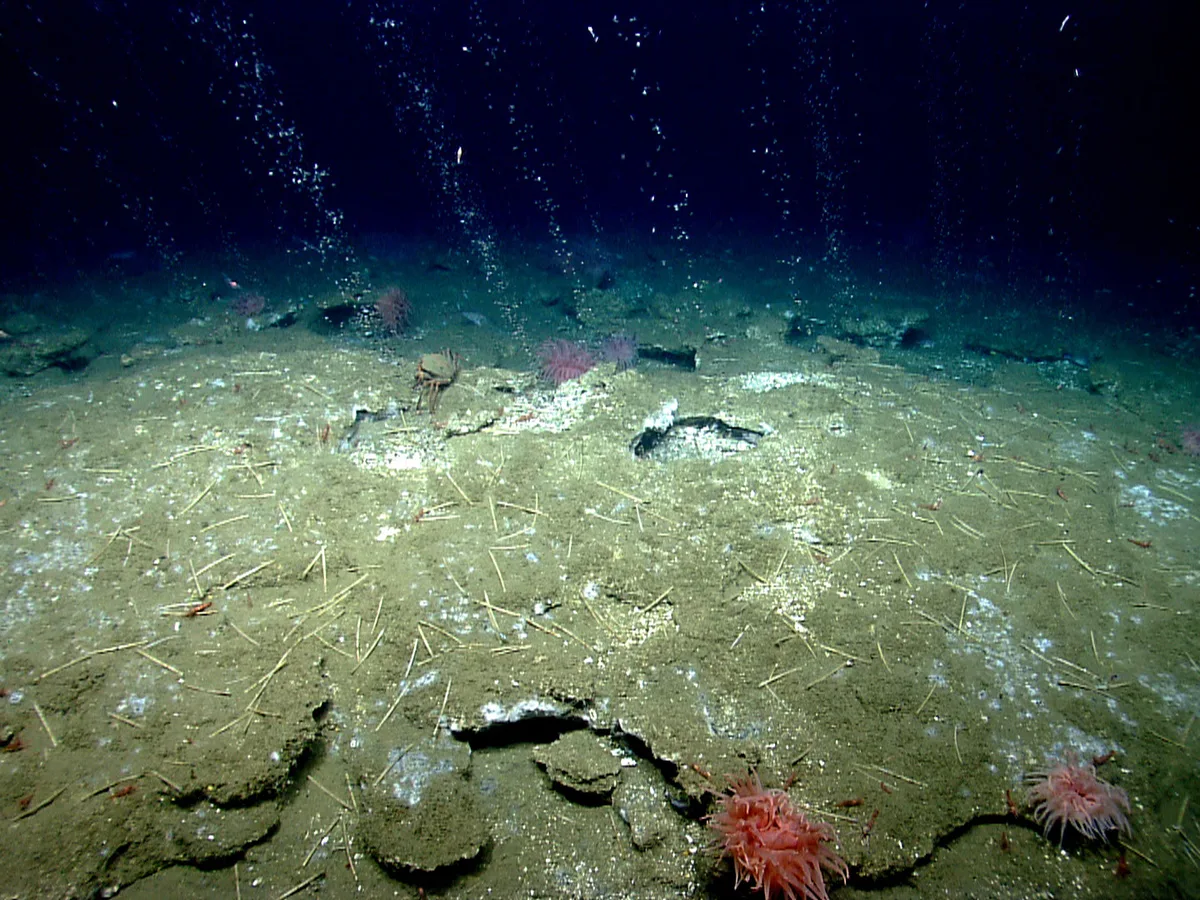

A narrow beam in a dark volume of particles (illustration) Illustration · AI generated
- Credit
- Site illustration (AI-generated, Flux)
- License
- Site original terms pending
- Made with
- FLUX.1-schnell (fp8, Comfy-Org/Flux-1-Schnell) · ComfyUI (local), tools/content/generate_l3.py

Particles above and below a detection threshold (illustration) Illustration · AI generated
- Credit
- Site illustration (AI-generated, Flux)
- License
- Site original terms pending
- Made with
- FLUX.1-schnell (fp8, Comfy-Org/Flux-1-Schnell) · ComfyUI (local), tools/content/generate_l3.py
Human Body
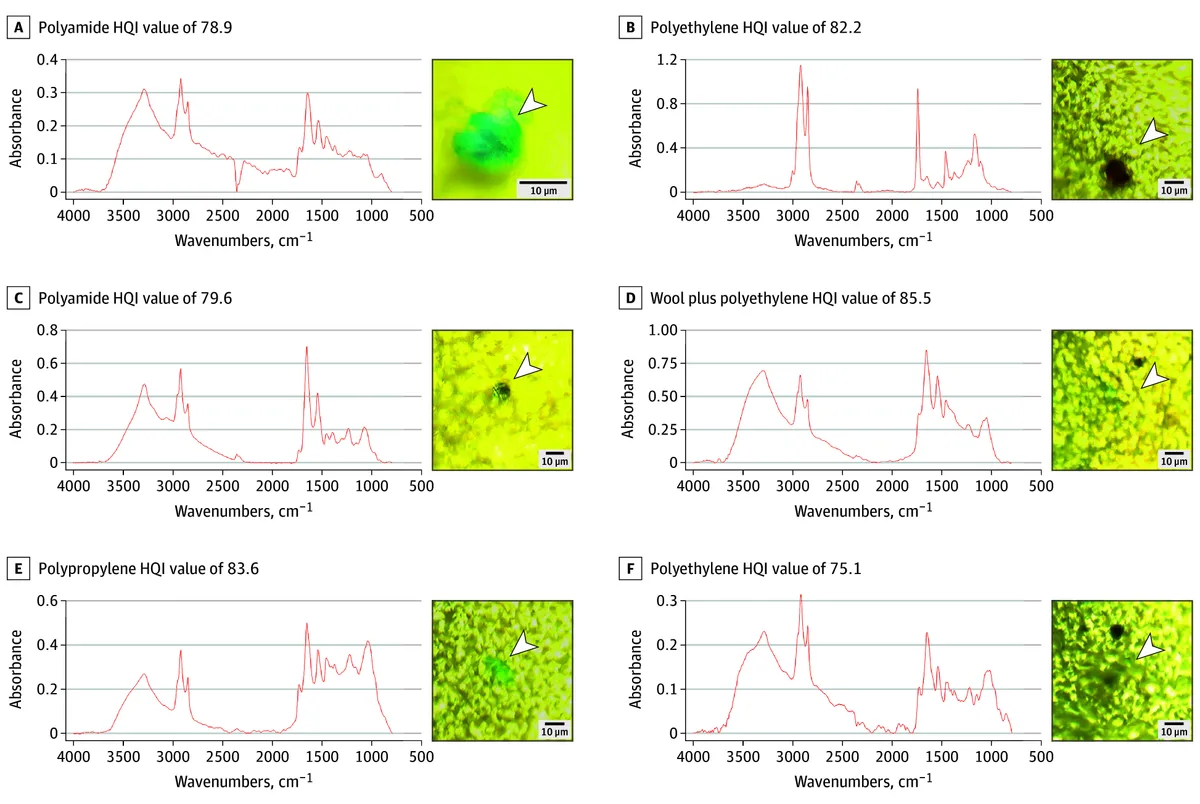
Microphotographs and μFTIR spectra of the main microplastics found in the digested olfactory bulb (Figure 2) Real image
- Credit
- Figure 2 from Amato-Lourenço LF et al. (2024), Microplastics in the Olfactory Bulb of the Human Brain, JAMA Network Open 7(9):e2440018, https://doi.org/10.1001/jamanetworkopen.2024.40018 · CC BY 4.0
- License
- CC BY 4.0
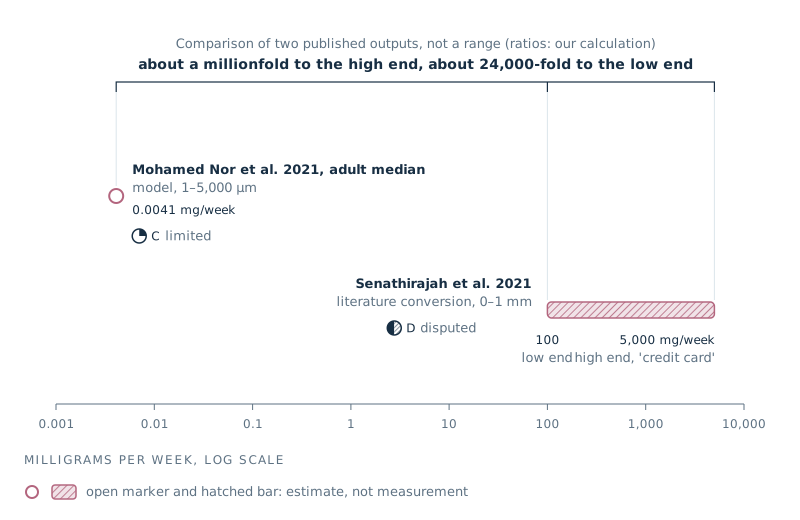
Weekly intake estimates for one adult, log scale Data graphic
- Credit
- Nanoplastics Observatory
- License
- Site original terms pending
- Data
- S-103
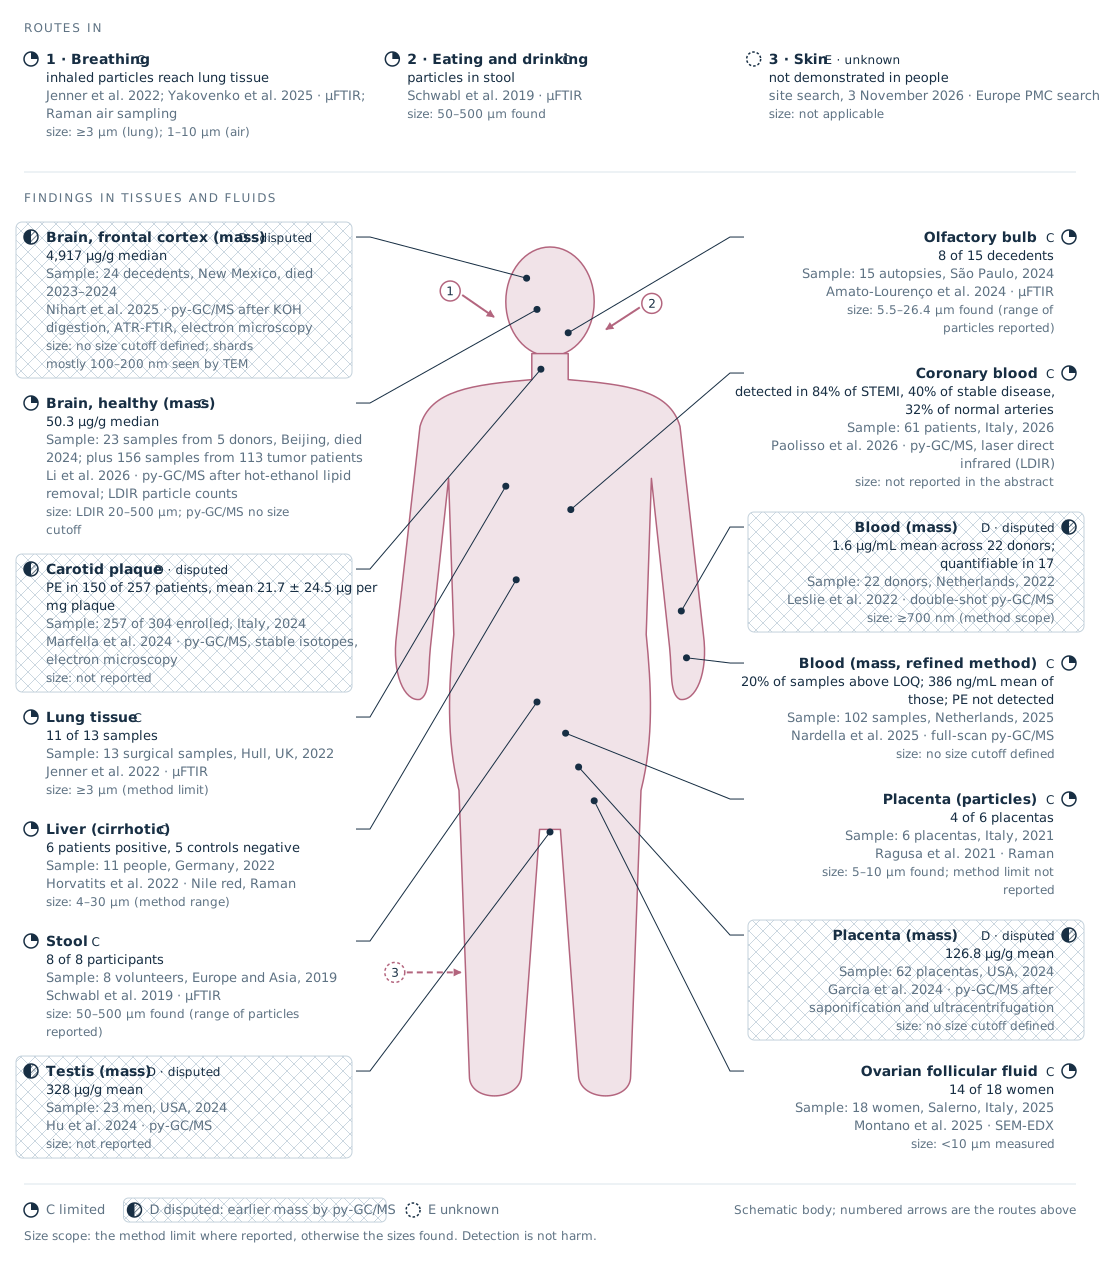
Where plastic particles have been reported in the human body Data graphic
- Credit
- Nanoplastics Observatory
- License
- Site original terms pending
- Data
- S-090
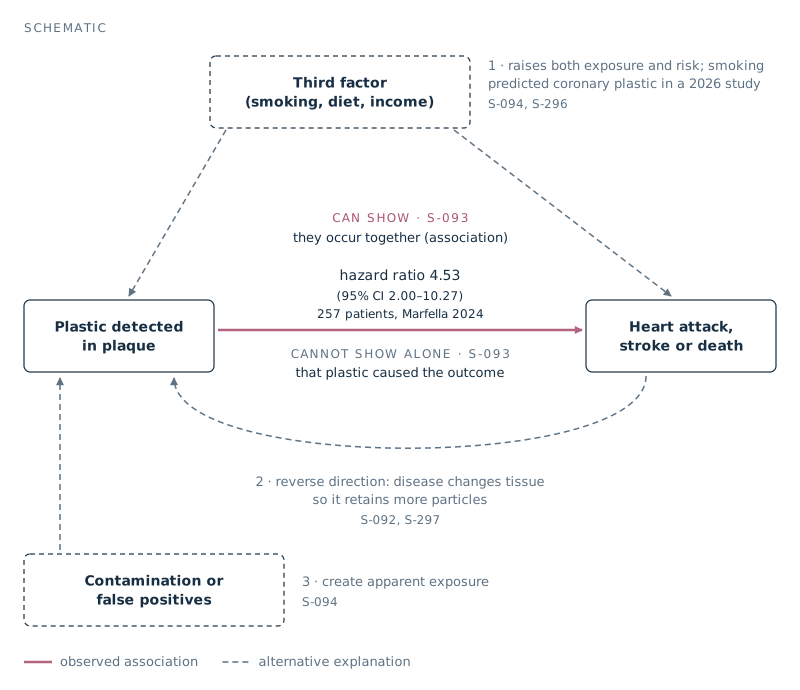
What an observational study can and cannot show Data graphic
- Credit
- Nanoplastics Observatory
- License
- Site original terms pending
- Data
- S-093
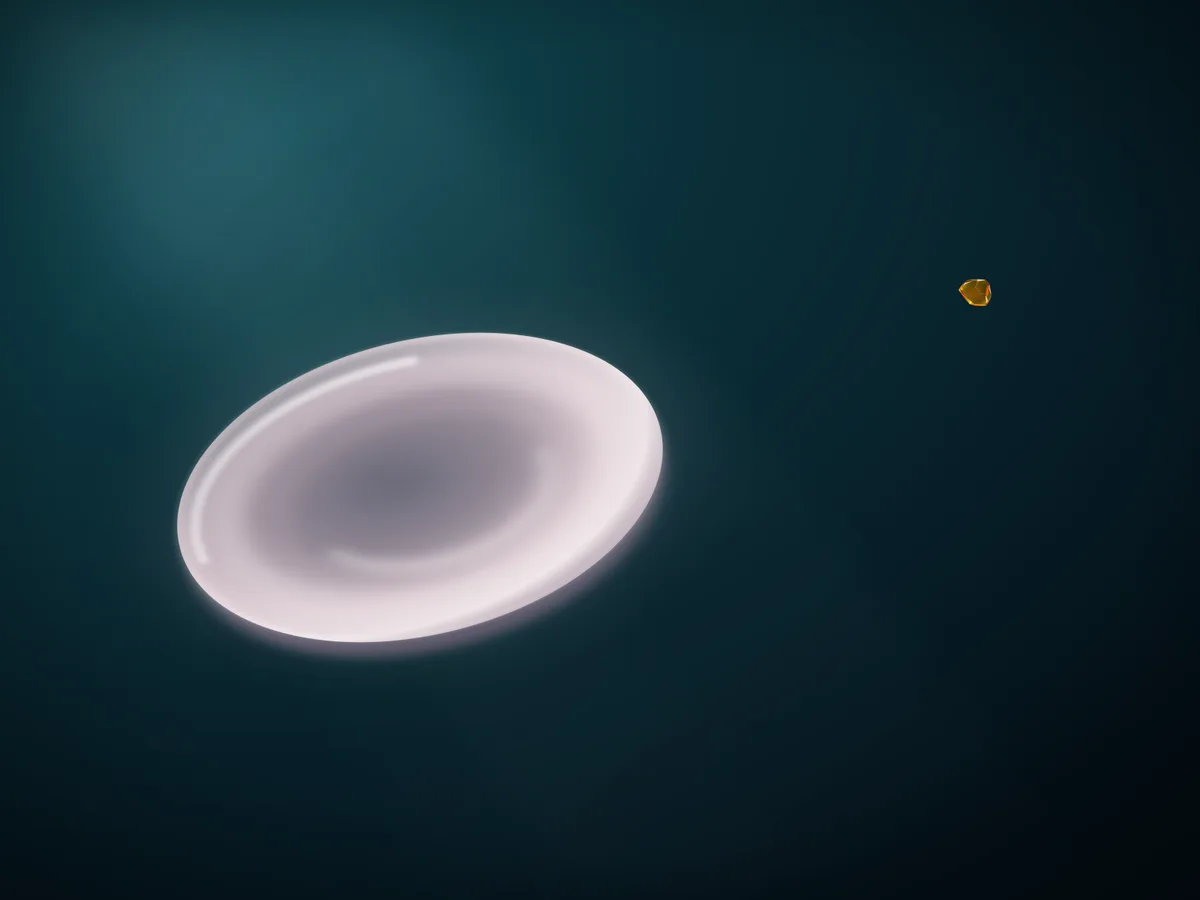
A plastic fragment beside a blood cell Illustration
- Credit
- Fragment: Site illustration (AI-generated, Flux). Cell drawing and composite: Nanoplastics Observatory.
- License
- Site original terms pending
- Data
- site-original
From Planet to Cell
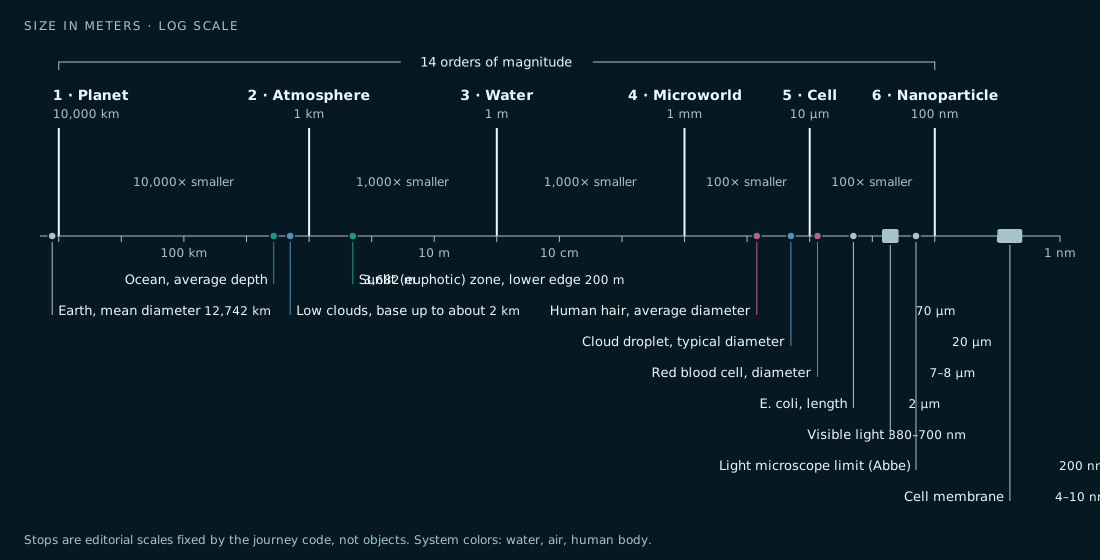
From planet to cell: six stops and reference sizes on one logarithmic ruler Data graphic
- Credit
- Nanoplastics Observatory
- License
- Site original terms pending
- Data
- S-222
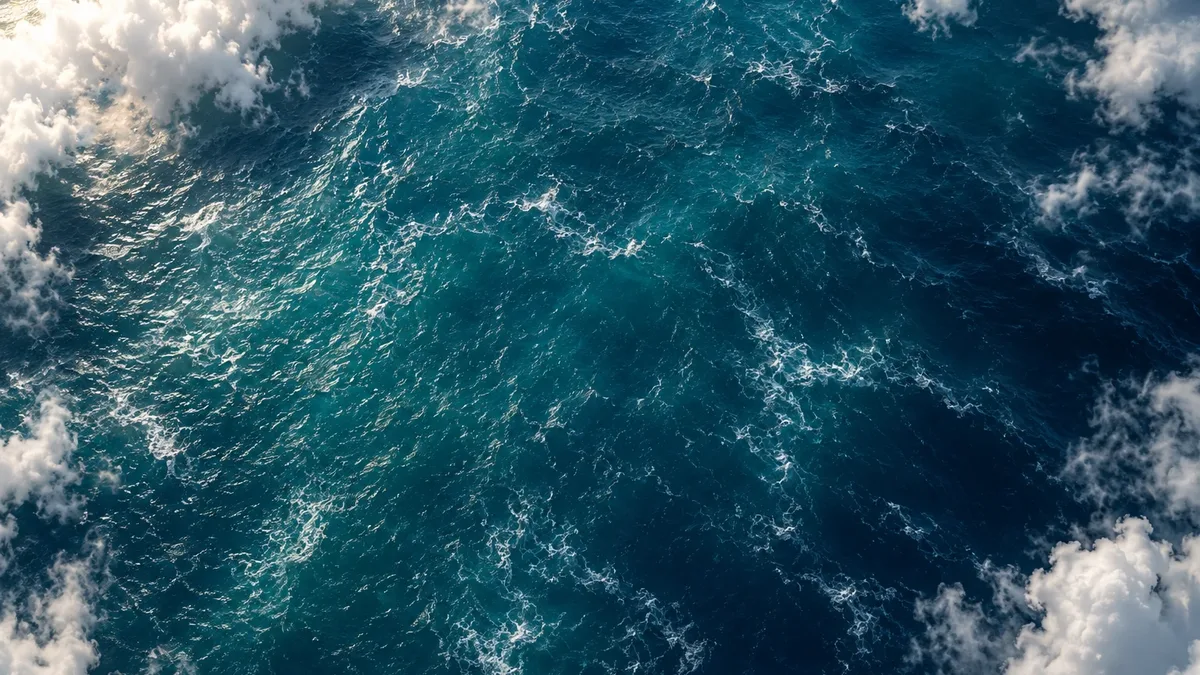
Journey frame: ocean through clouds (v6) Illustration · AI generated
- Credit
- Site illustration (AI-generated, OpenAI image model via Codex)
- License
- Site original terms pending
- Made with
- OpenAI gpt-image (version not stated), via Codex Desktop, 14 October 2026 · Codex Desktop (OpenAI)
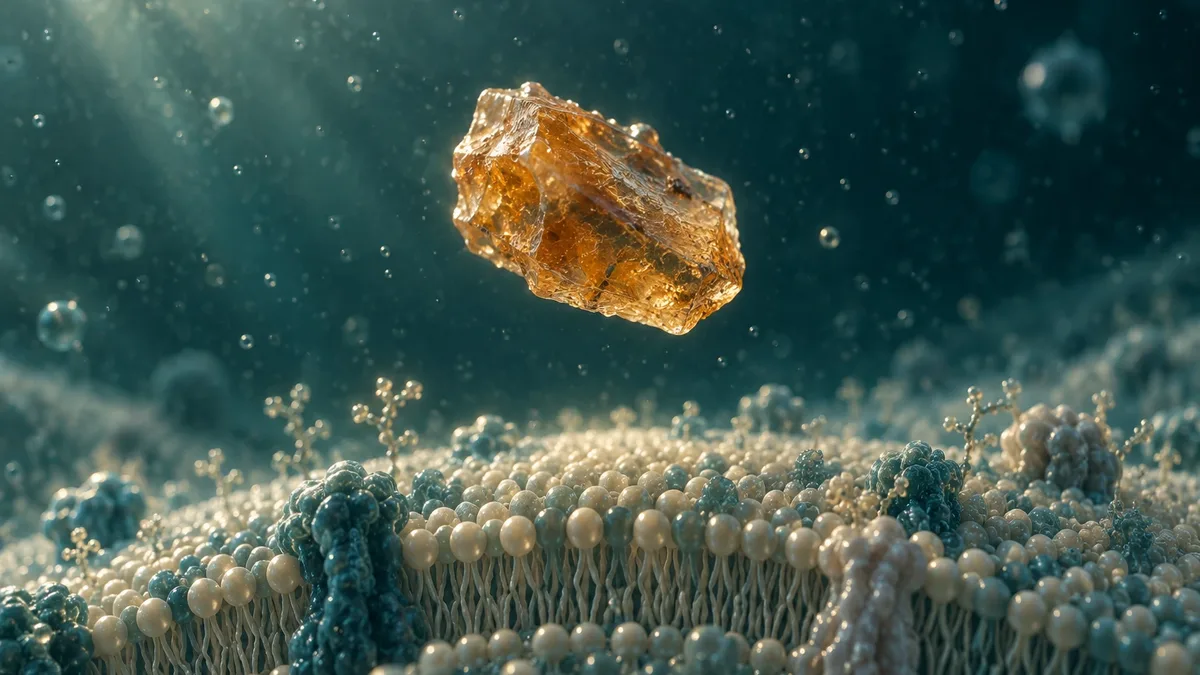
Journey frame: particle above a membrane (v6) Illustration · AI generated
- Credit
- Site illustration (AI-generated, OpenAI image model via Codex)
- License
- Site original terms pending
- Made with
- OpenAI gpt-image (version not stated), via Codex Desktop, 14 October 2026 · Codex Desktop (OpenAI)
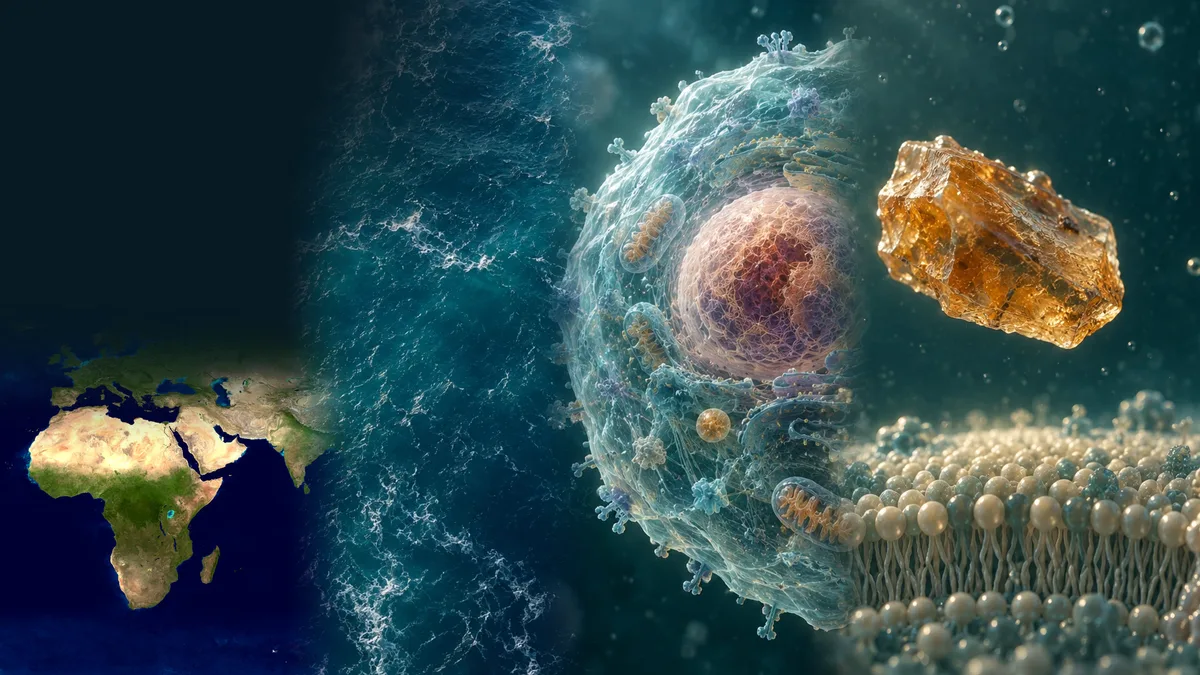
From planet to particle: four stops of the journey Illustration
- Credit
- Earth: NASA Goddard Space Flight Center. Image by Reto Stöckli (land surface, shallow water, clouds). Enhancements by Robert Simmon (ocean color, compositing, 3D globes, animation). Ocean, cell and particle: Site illustration (AI-generated, OpenAI image model via Codex). Composite: Nanoplastics Observatory.
- License
- NASA (Earth frame); Site original (illustrations and composition) terms pending
- Data
- site-original
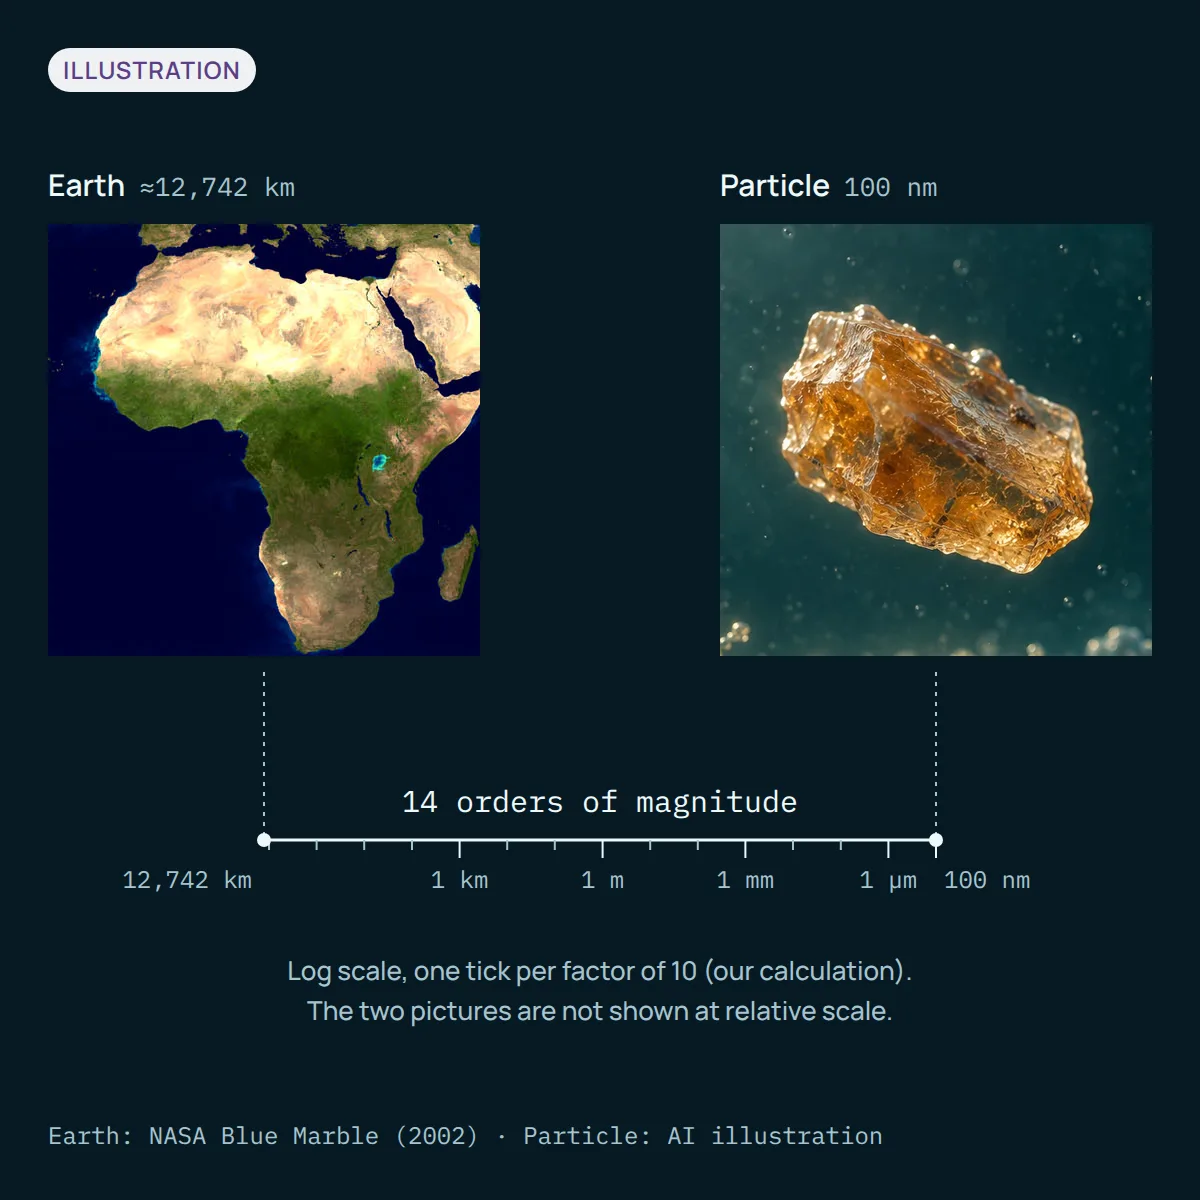
From Earth to a 100 nm particle: 14 orders of magnitude Illustration
- Credit
- Earth: NASA Goddard Space Flight Center. Image by Reto Stöckli (land surface, shallow water, clouds). Enhancements by Robert Simmon (ocean color, compositing, 3D globes, animation). Particle: Site illustration (AI-generated, OpenAI image model via Codex). Card: Nanoplastics Observatory.
- License
- NASA (Earth frame); Site original (illustrations and composition) terms pending
- Data
- S-300
Landmark Studies
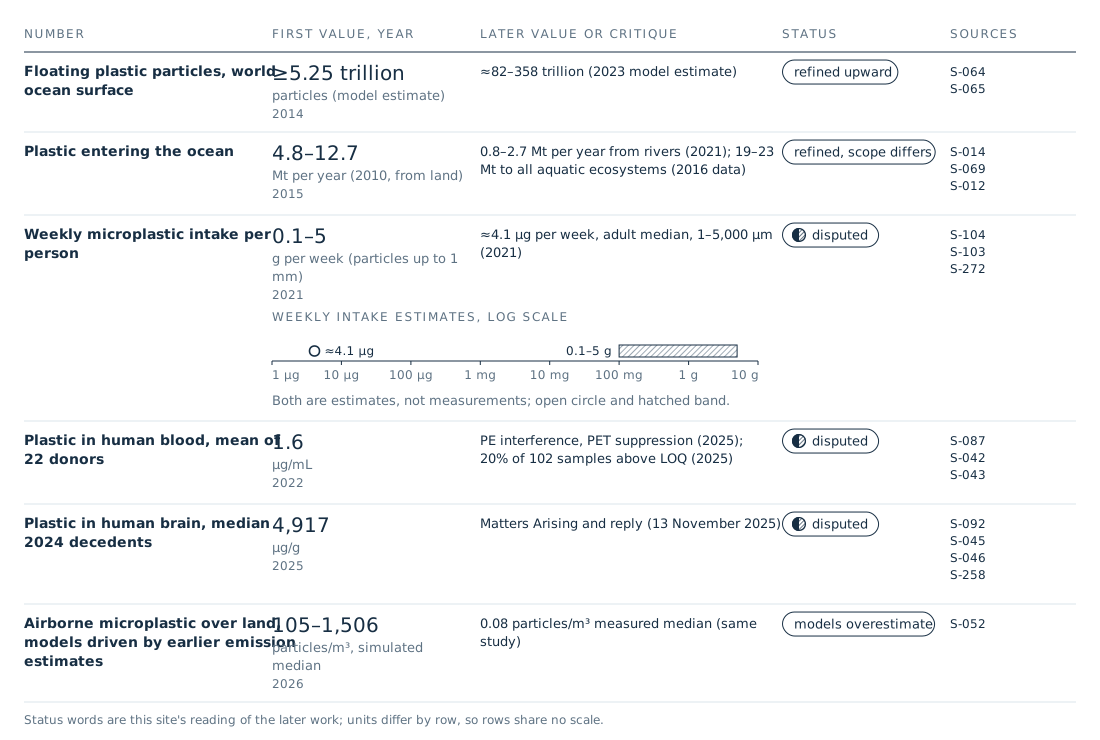
How six famous numbers aged Data graphic
- Credit
- Nanoplastics Observatory
- License
- Site original terms pending
- Data
- S-104
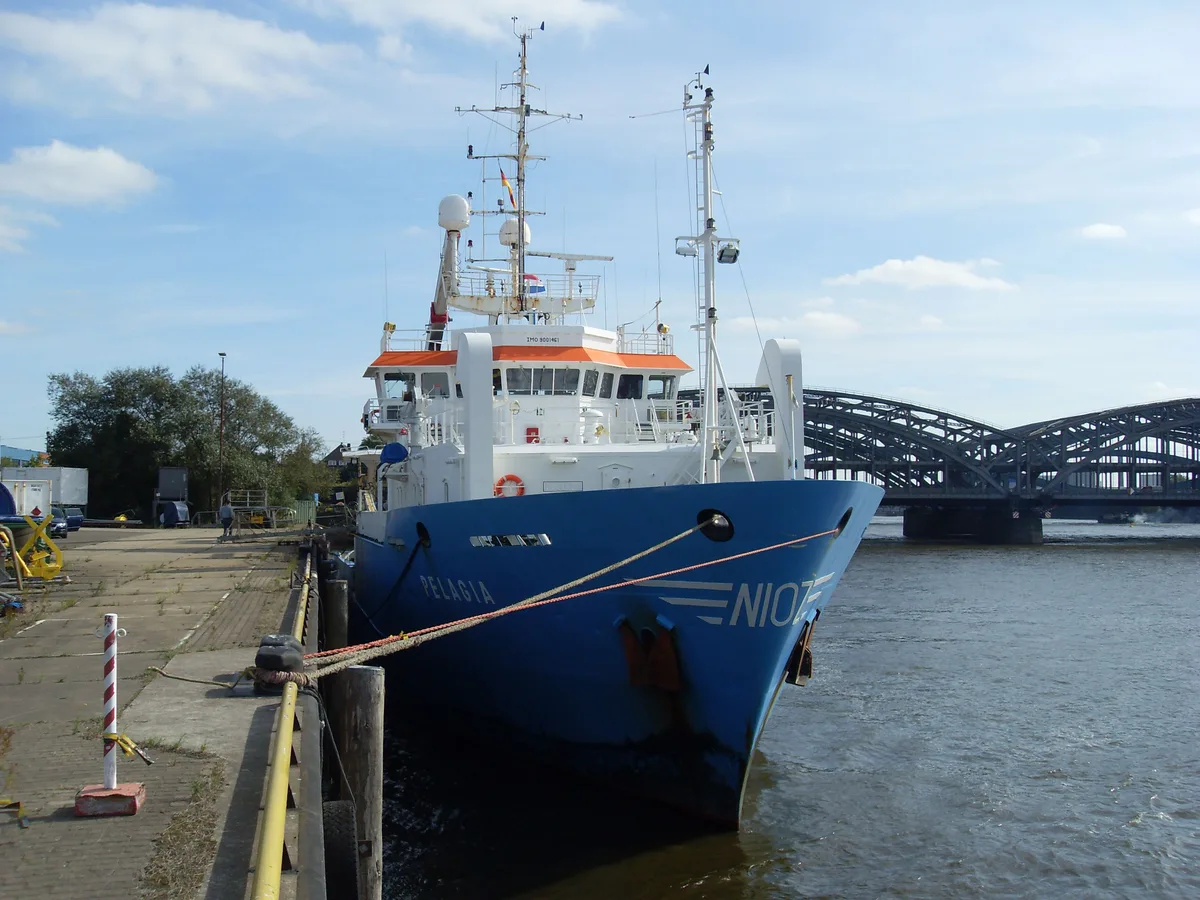
RV Pelagia Real image
- Credit
- "RV Pelagia" by Wusel007, via Wikimedia Commons · CC BY-SA 3.0
- License
- CC BY-SA 3.0
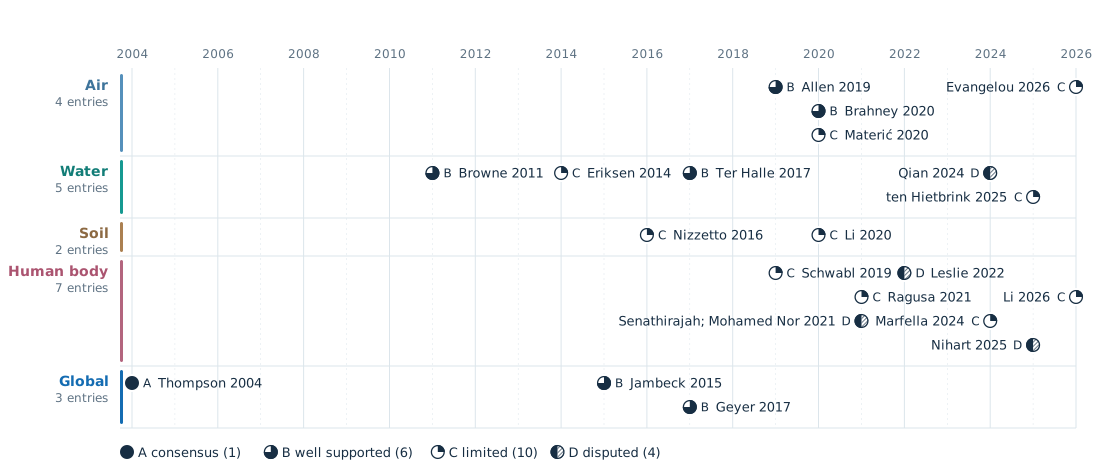
Landmark studies 2004 to 2026 by system and evidence level Data graphic
- Credit
- Nanoplastics Observatory
- License
- Site original terms pending
- Data
- S-001
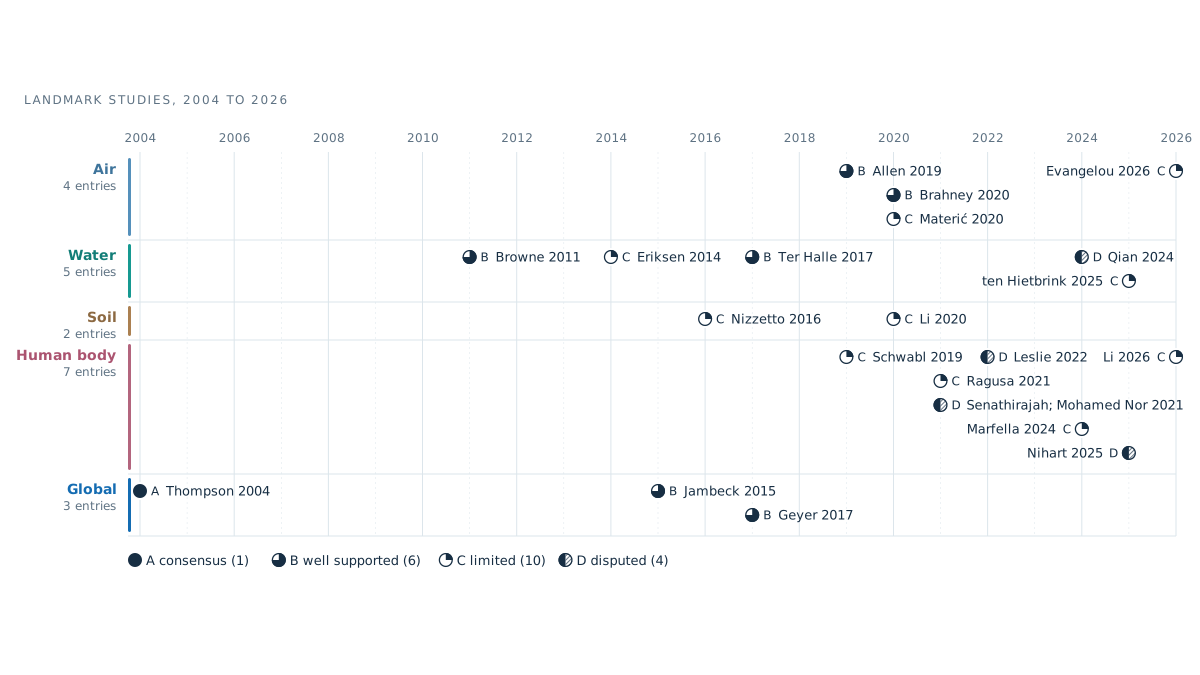
Landmark studies 2004 to 2026 by system and evidence level Data graphic
- Credit
- Nanoplastics Observatory
- License
- Site original terms pending
- Data
- S-001
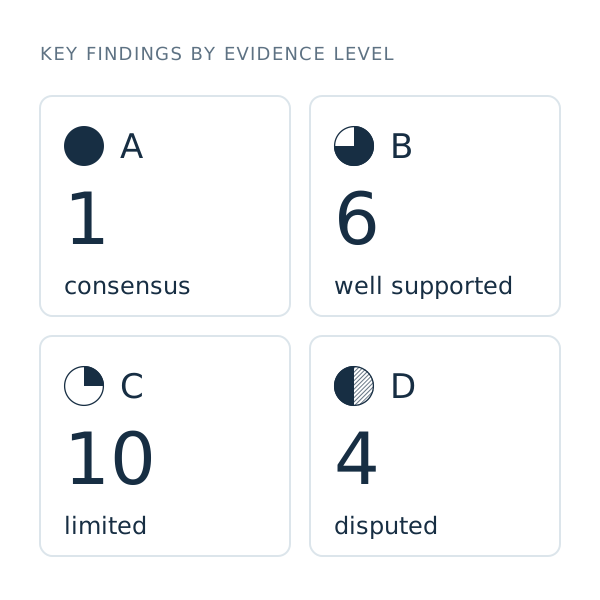
Key findings of the 21 entries by evidence level Data graphic
- Credit
- Nanoplastics Observatory
- License
- Site original terms pending
- Data
- site-original
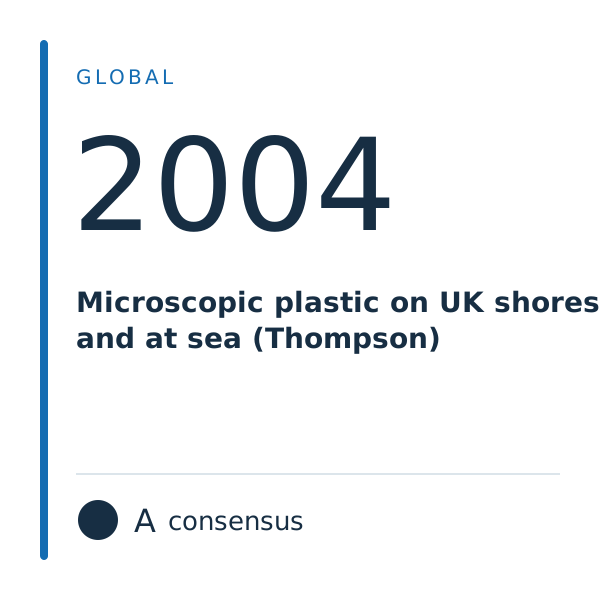
Study card template (example: Thompson 2004) Data graphic
- Credit
- Nanoplastics Observatory
- License
- Site original terms pending
- Data
- S-001
Evidence Levels
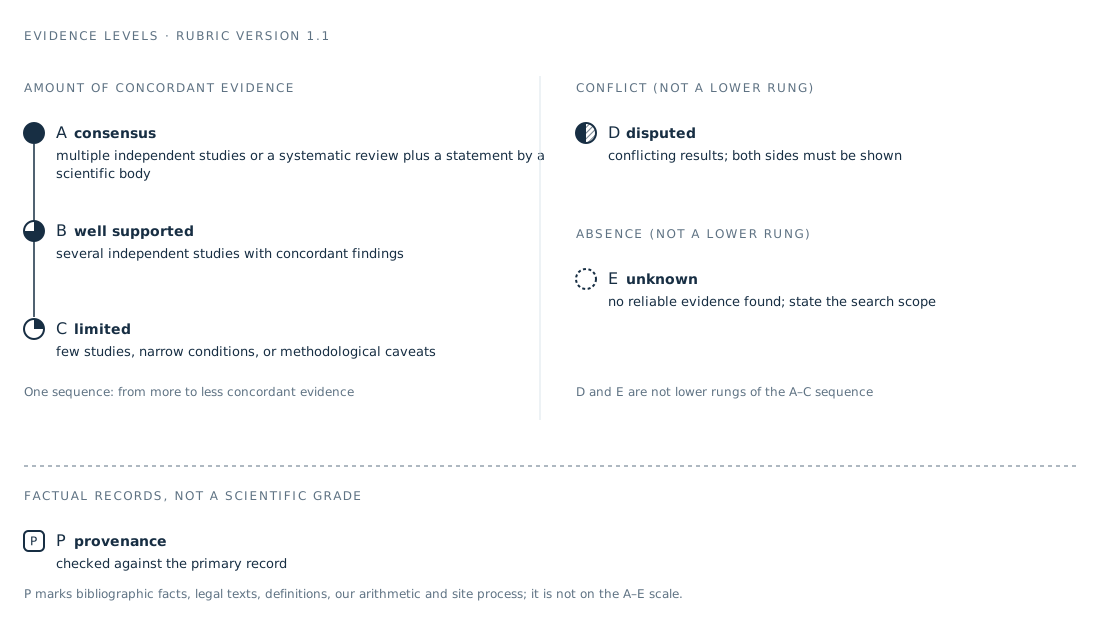
The evidence levels of this site (rubric version 1.1) and the separate provenance mark Data graphic
- Credit
- Nanoplastics Observatory
- License
- Site original
- Data
- site-original
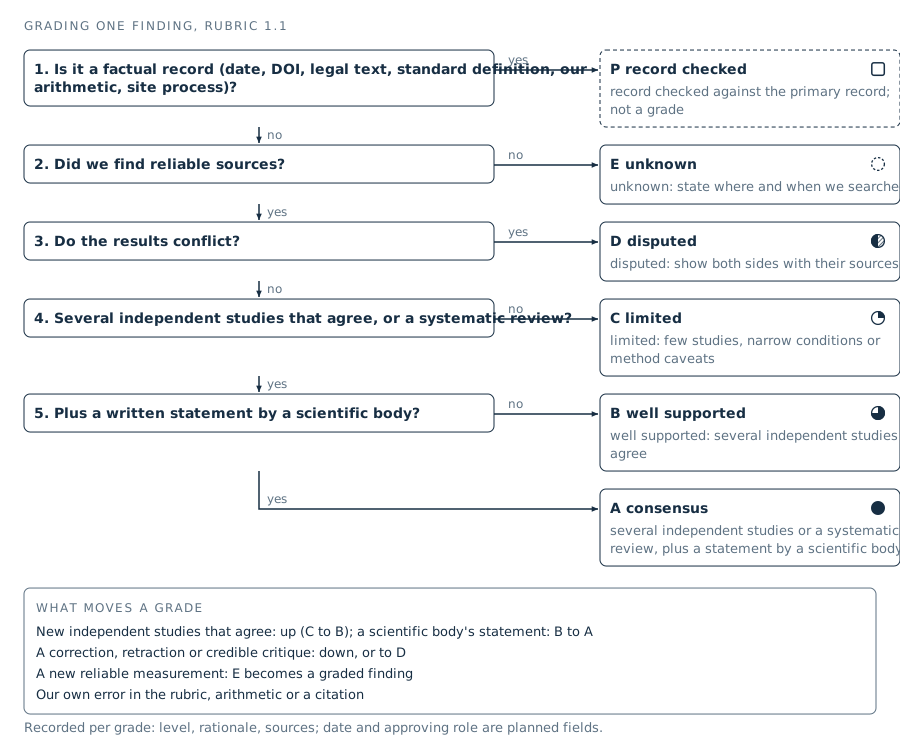
Decision flow for grading one finding Data graphic
- Credit
- Nanoplastics Observatory
- License
- Site original
- Data
- S-392
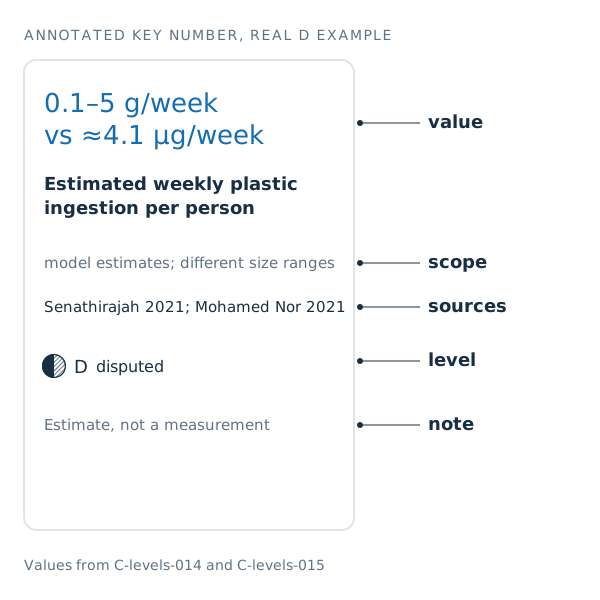
Annotated graded key number Data graphic
- Credit
- Nanoplastics Observatory
- License
- Site original
- Data
- S-104
How We Measure It
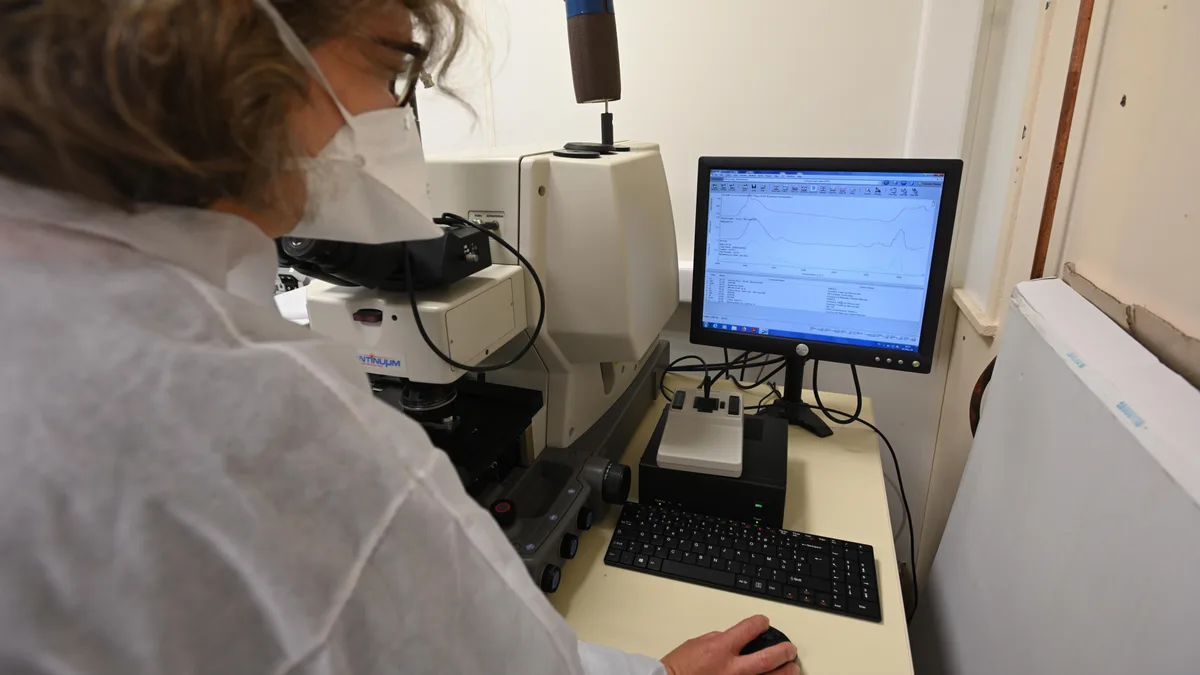
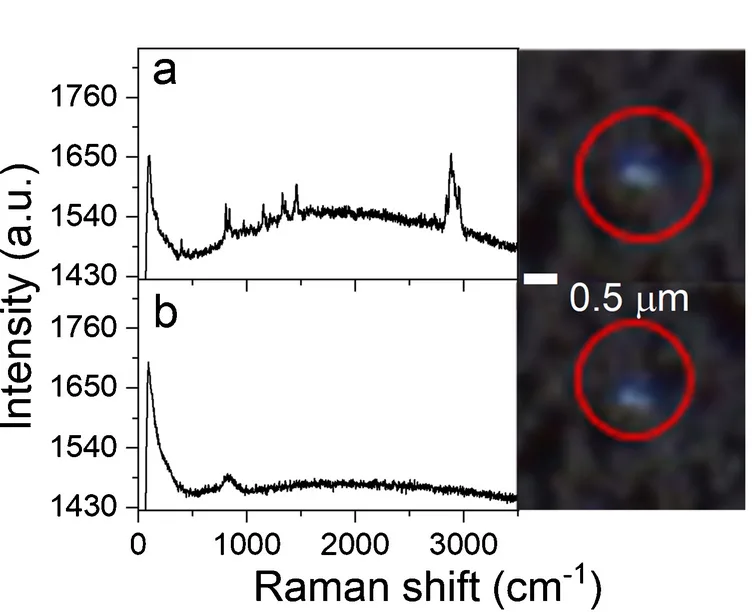
Fig. 6 (left): small polypropylene particle on Al-coated PC filter and Raman spectra depending on laser focus Real image
- Credit
- Figure 6 (left panel) from Jüngling I.S., Schmitt L., De Franceschi F., Da Costa Filho P.A., Lei L., Coic L., Benismail N., Dubascoux S., Ambühl M.E., Ivleva N.P. (2026), Analytical and Bioanalytical Chemistry 418:5283–5302, https://doi.org/10.1007/s00216-026-06567-2 · CC BY 4.0 · cropped
- License
- CC BY 4.0
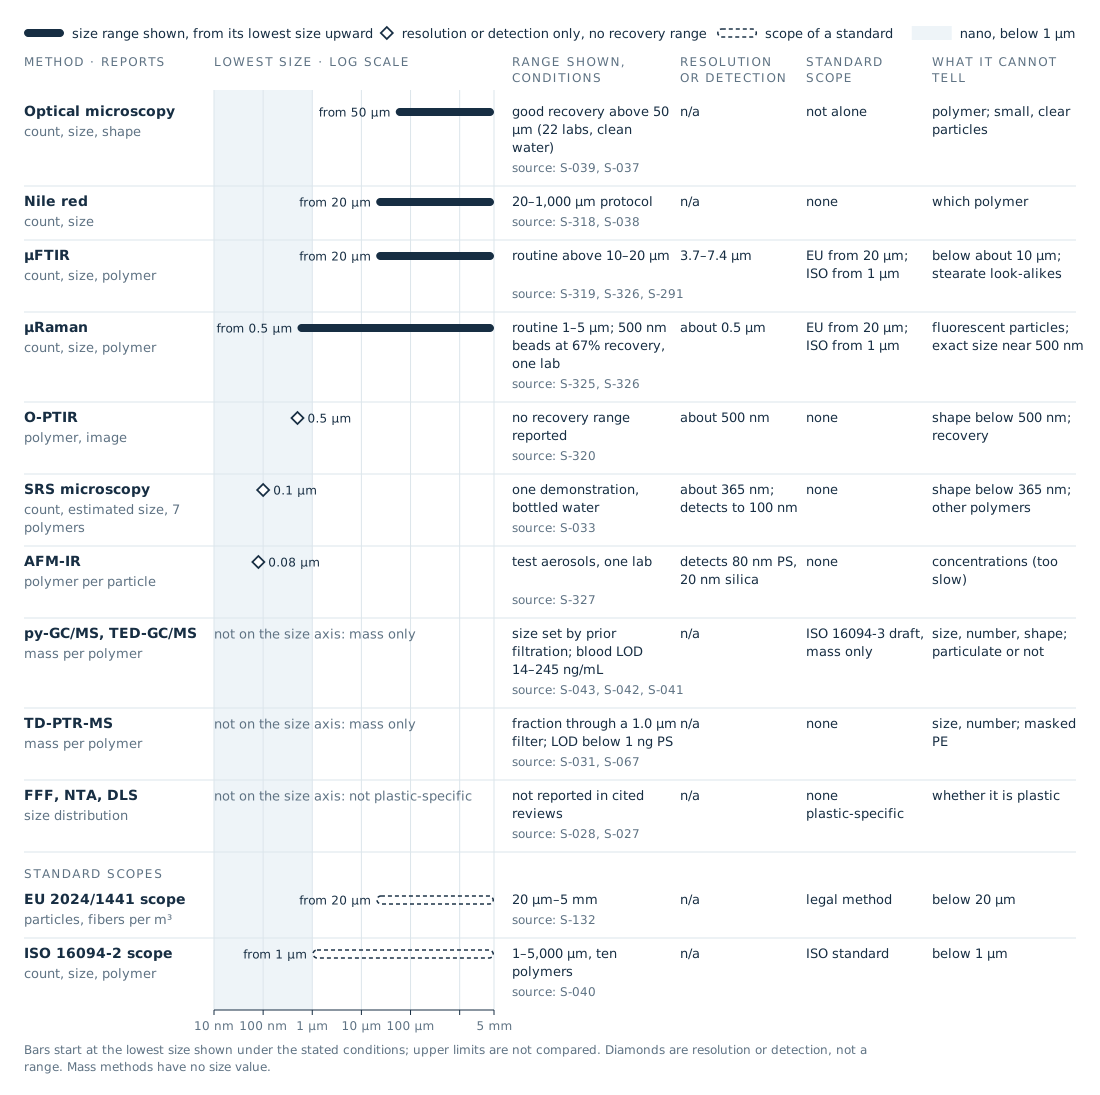
What each method can tell, and what it cannot Data graphic
- Credit
- Nanoplastics Observatory
- License
- Site original terms pending
- Data
- S-039
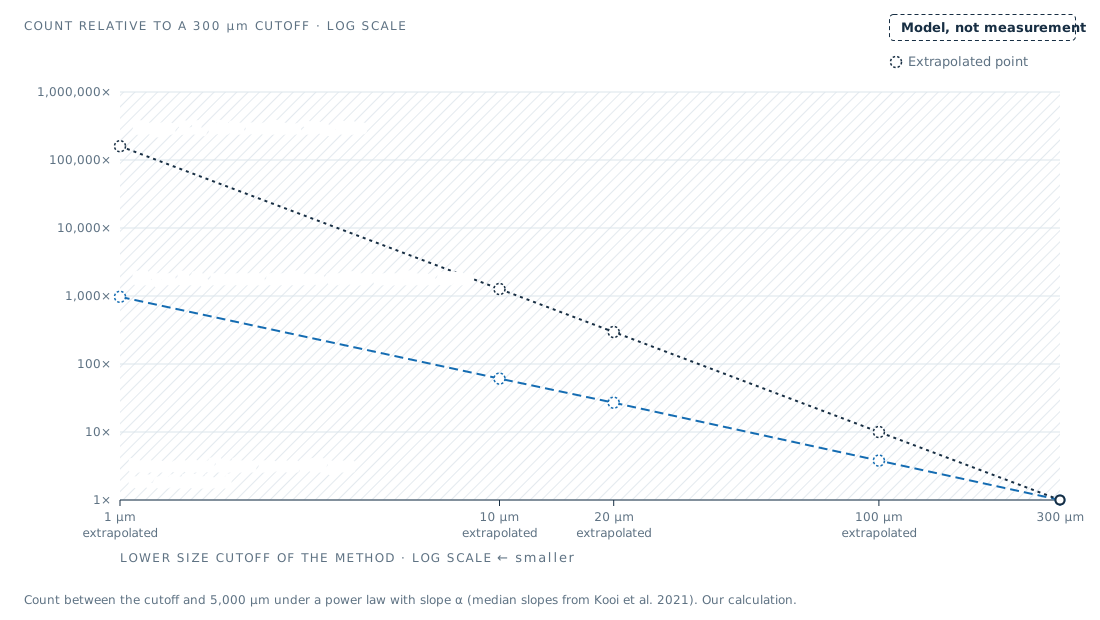
Same water, different cutoff: modeled count relative to a 300 µm cutoff Data graphic
- Credit
- Nanoplastics Observatory
- License
- Site original terms pending
- Data
- S-314
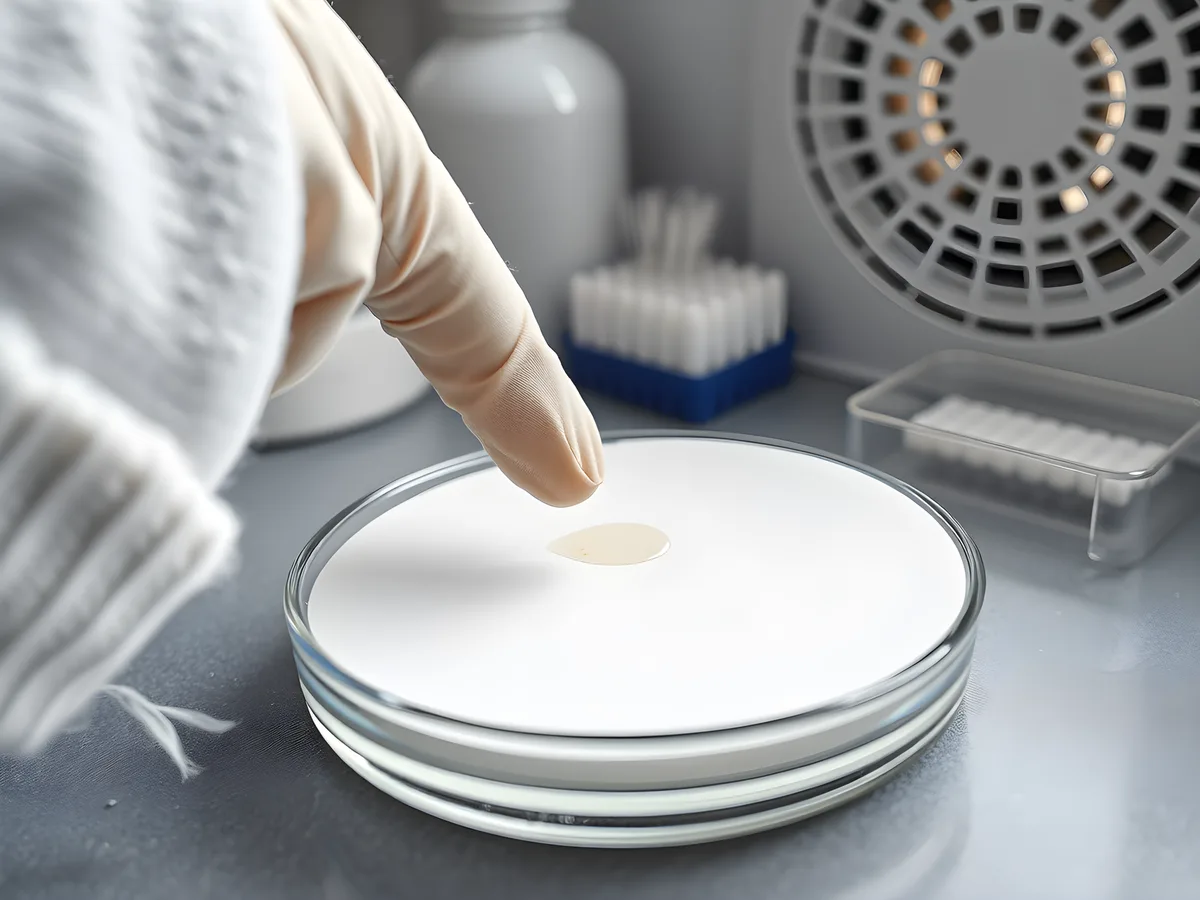
Where plastic can enter a sample at the lab bench (illustration) Illustration · AI generated
- Credit
- Site illustration (AI-generated, Flux)
- License
- Site original terms pending
- Made with
- FLUX.1-schnell (fp8, Comfy-Org/Flux-1-Schnell) · ComfyUI (local), tools/content/generate_l3.py
How to Read the Numbers
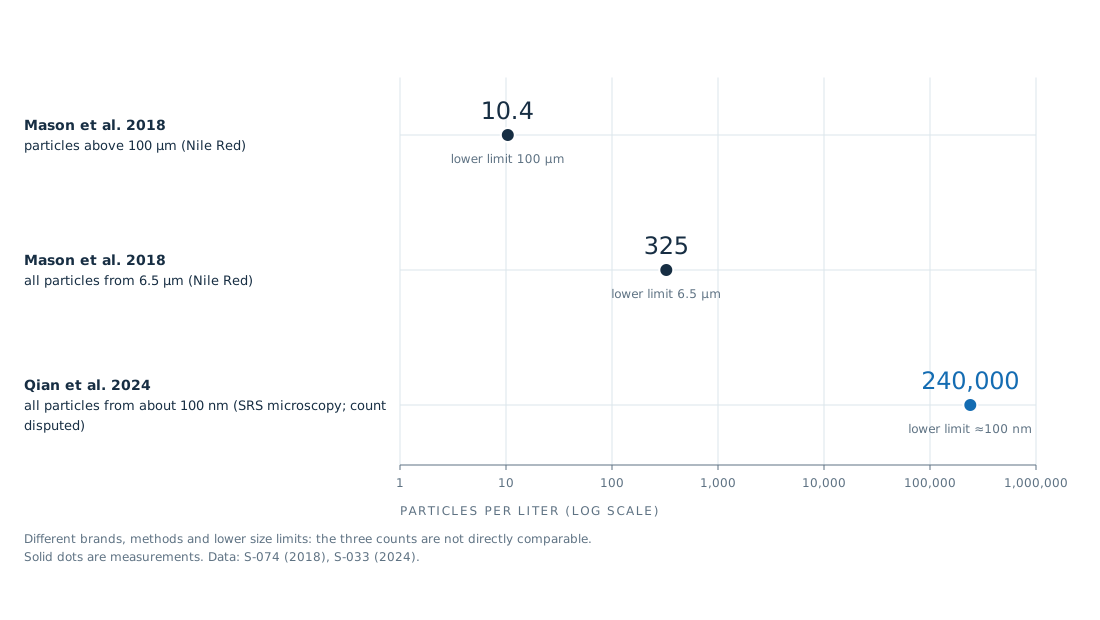
Bottled water: reported particles per liter and the smallest size each count includes Data graphic
- Credit
- Nanoplastics Observatory
- License
- Site original
- Data
- S-074
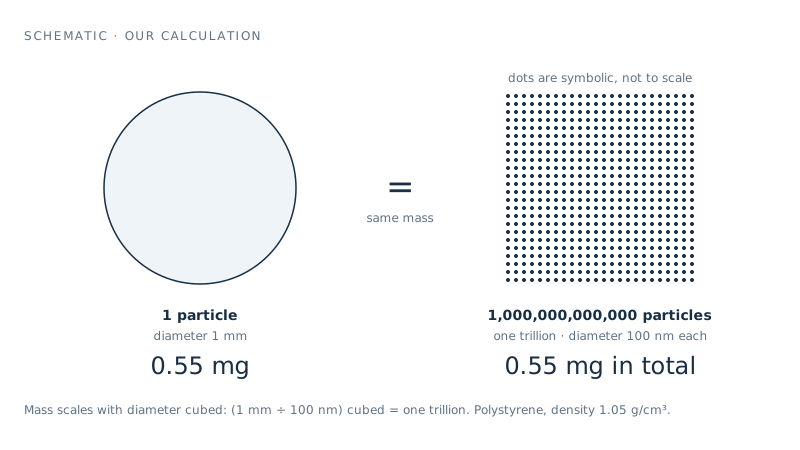
Same mass, different count: one 1 mm sphere versus 100 nm spheres Data graphic
- Credit
- Nanoplastics Observatory
- License
- Site original
- Data
- S-016
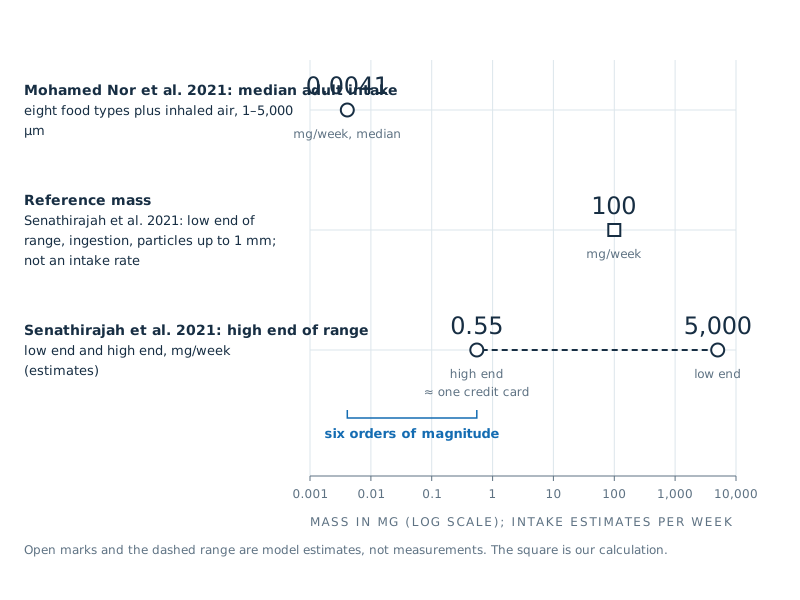
Mass equivalent of one week's modeled intake for adults (mg), log scale, with reference objects shown apart Data graphic
- Credit
- Nanoplastics Observatory
- License
- Site original
- Data
- S-103
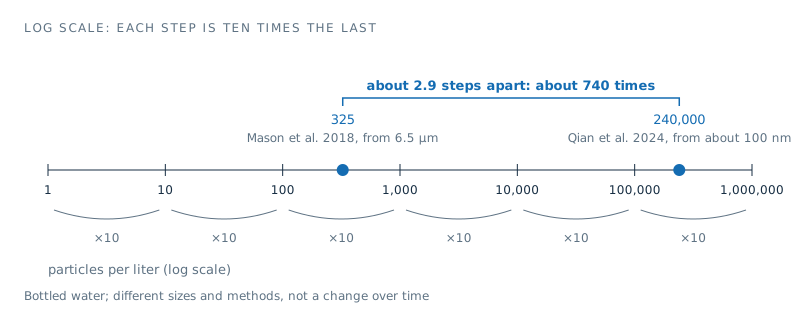
How to read a log scale Data graphic
- Credit
- Nanoplastics Observatory
- License
- Site original
- Data
- S-074
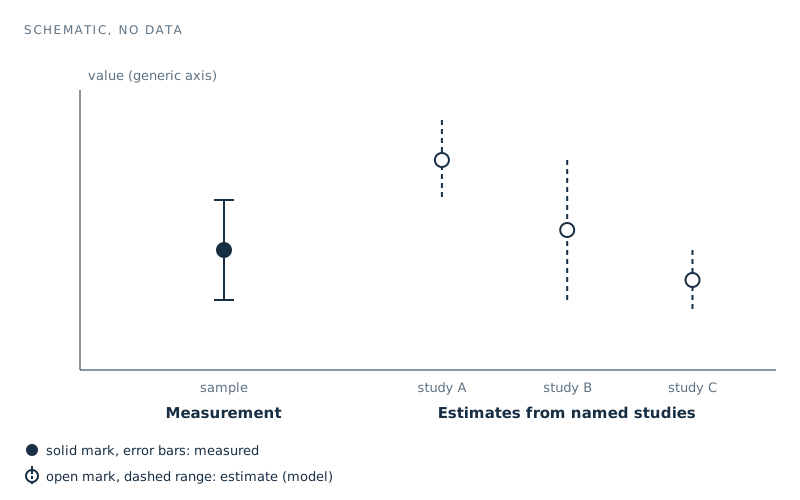
How this site draws measurements and estimates Data graphic
- Credit
- Nanoplastics Observatory
- License
- Site original
- Data
- site-original
Oceans
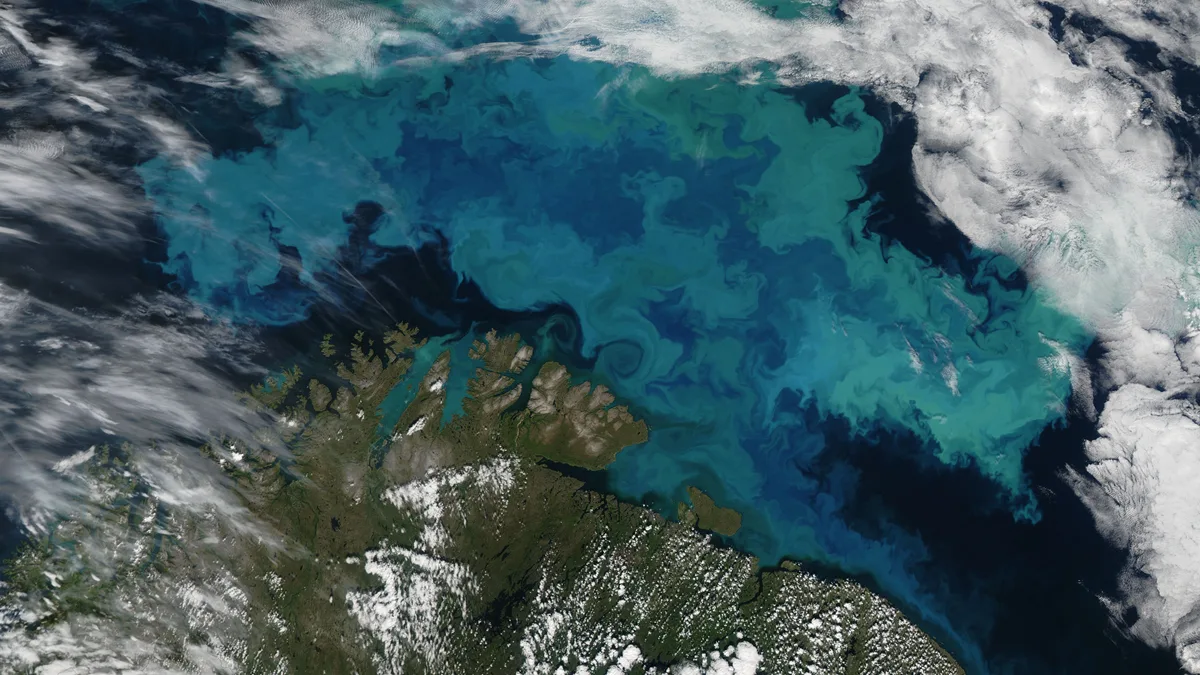
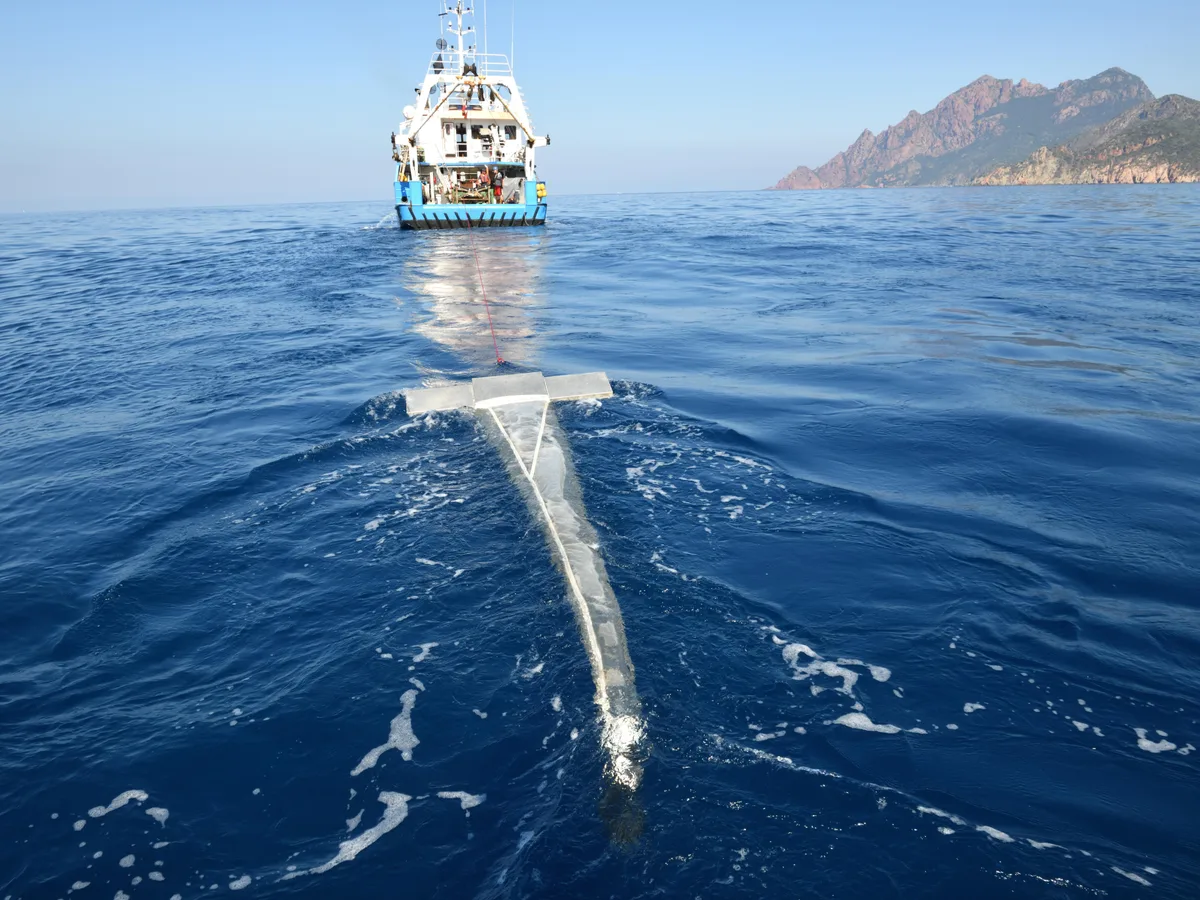
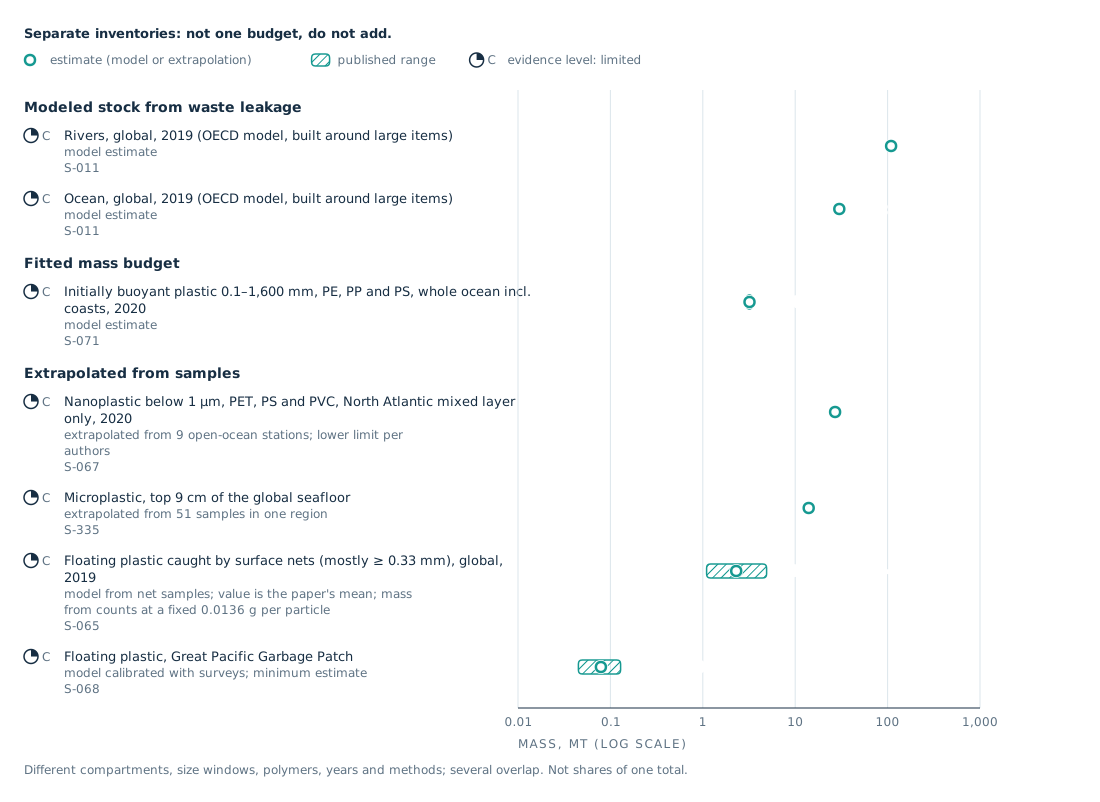
Separate published estimates of plastic mass in rivers and the ocean, not one budget Data graphic
- Credit
- Nanoplastics Observatory
- License
- Site original terms pending
- Data
- S-011
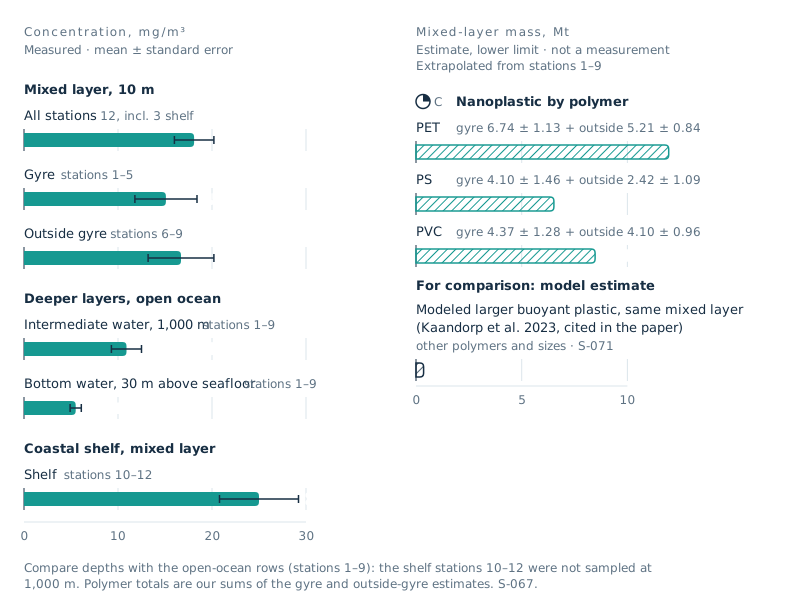
Nanoplastics in the North Atlantic, November 2020: concentration by depth and estimated mass by polymer Data graphic
- Credit
- Nanoplastics Observatory
- License
- Site original terms pending
- Data
- S-067
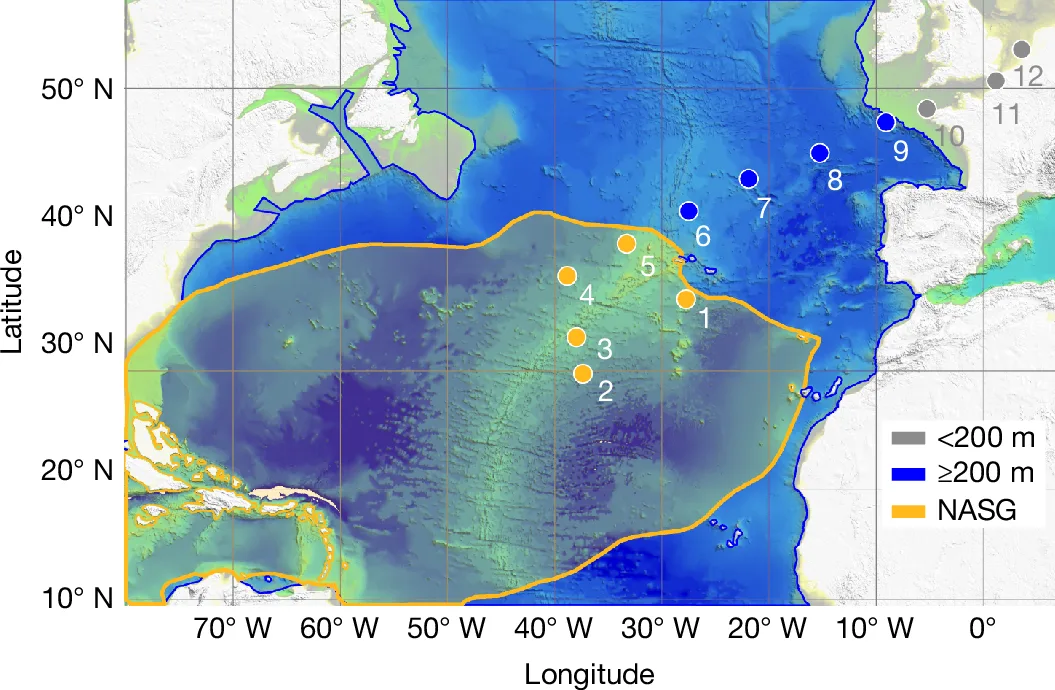
Map of the 12 hydrocast stations along a transect crossing the North Atlantic (Figure 1) Real image
- Credit
- Figure 1 from ten Hietbrink S, Materić D, Holzinger R, Groeskamp S, Niemann H (2025), Nanoplastic concentrations across the North Atlantic, Nature 643:412–416, https://doi.org/10.1038/s41586-025-09218-1 · CC BY 4.0 · unmodified
- License
- CC BY 4.0

A plastic fragment sinking in marine snow (illustration) Illustration · AI generated
- Credit
- Site illustration (AI-generated, Flux)
- License
- Site original terms pending
- Made with
- FLUX.1-schnell (fp8, Comfy-Org/Flux-1-Schnell) · ComfyUI (local), tools/content/generate_l3.py
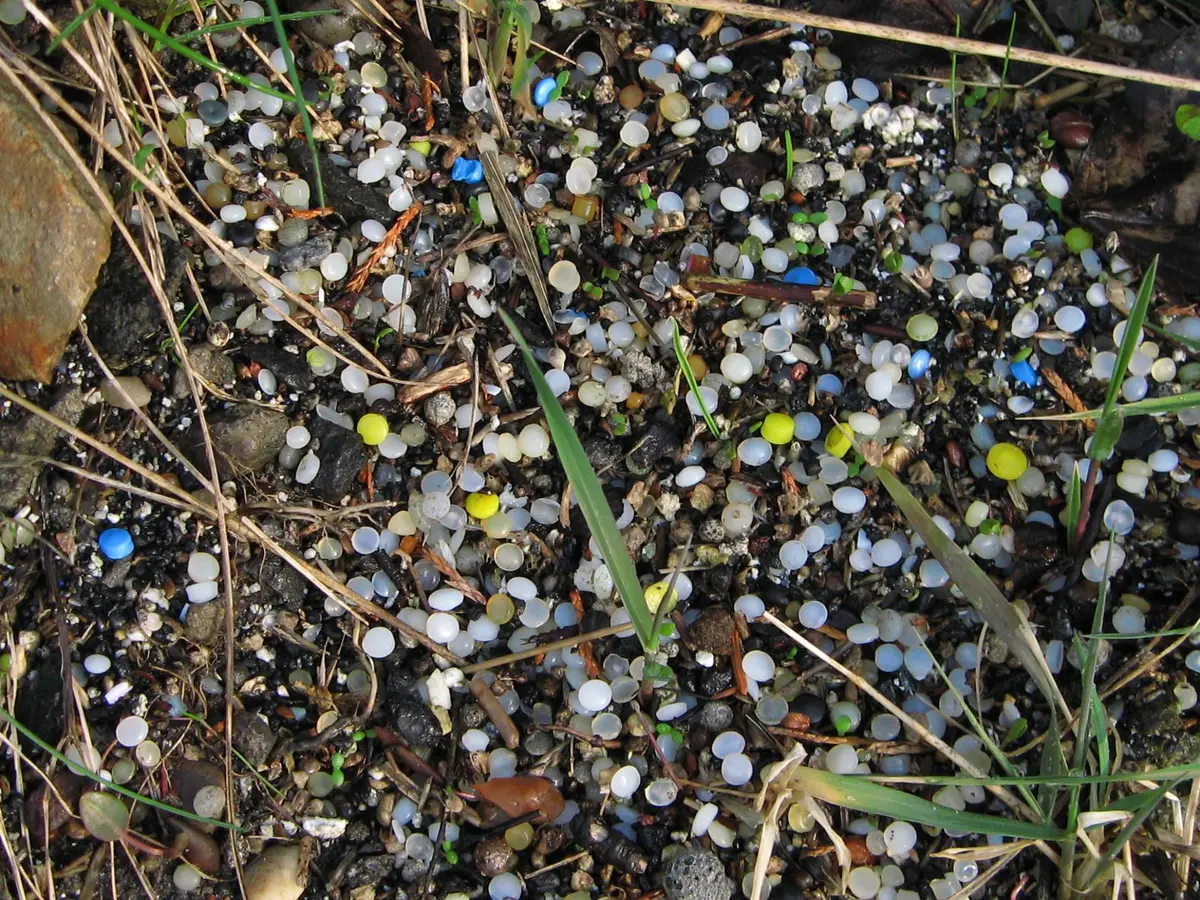
Nurdles - plastic "gravel" Real image
- Credit
- "Nurdles - plastic 'gravel'" by hockadilly, via Flickr and Wikimedia Commons, CC BY-SA 2.0
- License
- CC BY-SA 2.0
Planet Overview
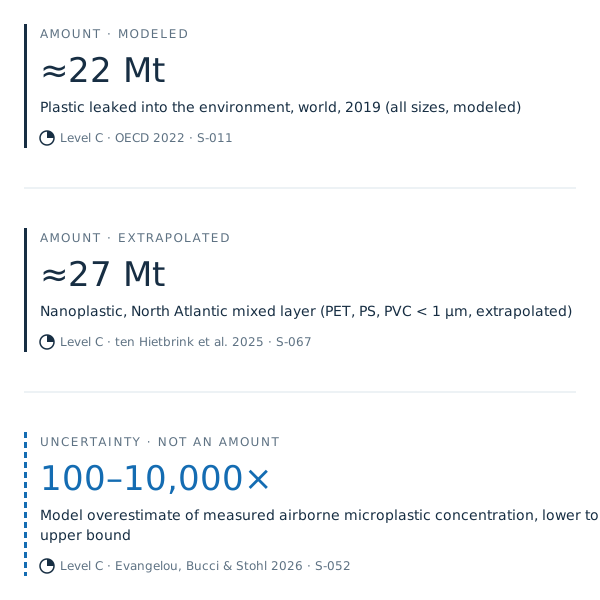
Three numbers at three scales Data graphic
- Credit
- Nanoplastics Observatory
- License
- Site original terms pending
- Data
- S-011
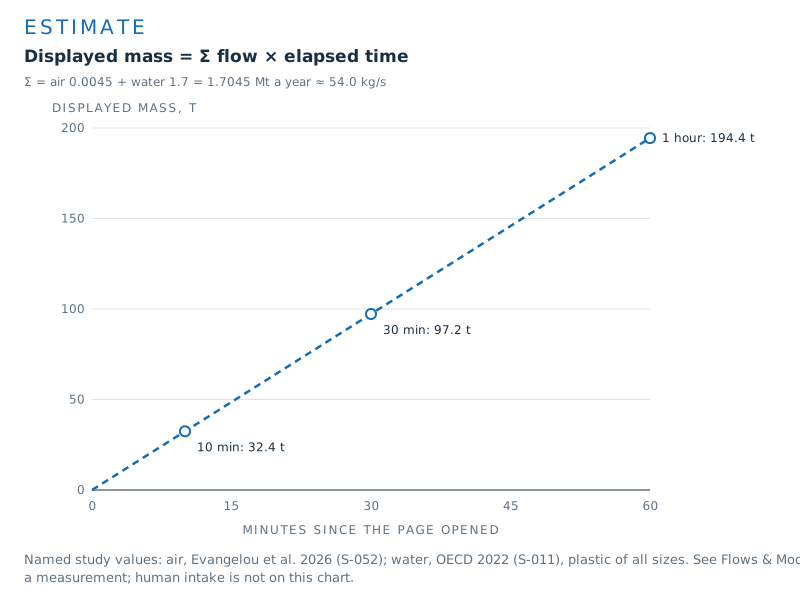
How the counters run: flow × elapsed time Data graphic
- Credit
- Nanoplastics Observatory
- License
- Site original terms pending
- Data
- S-052
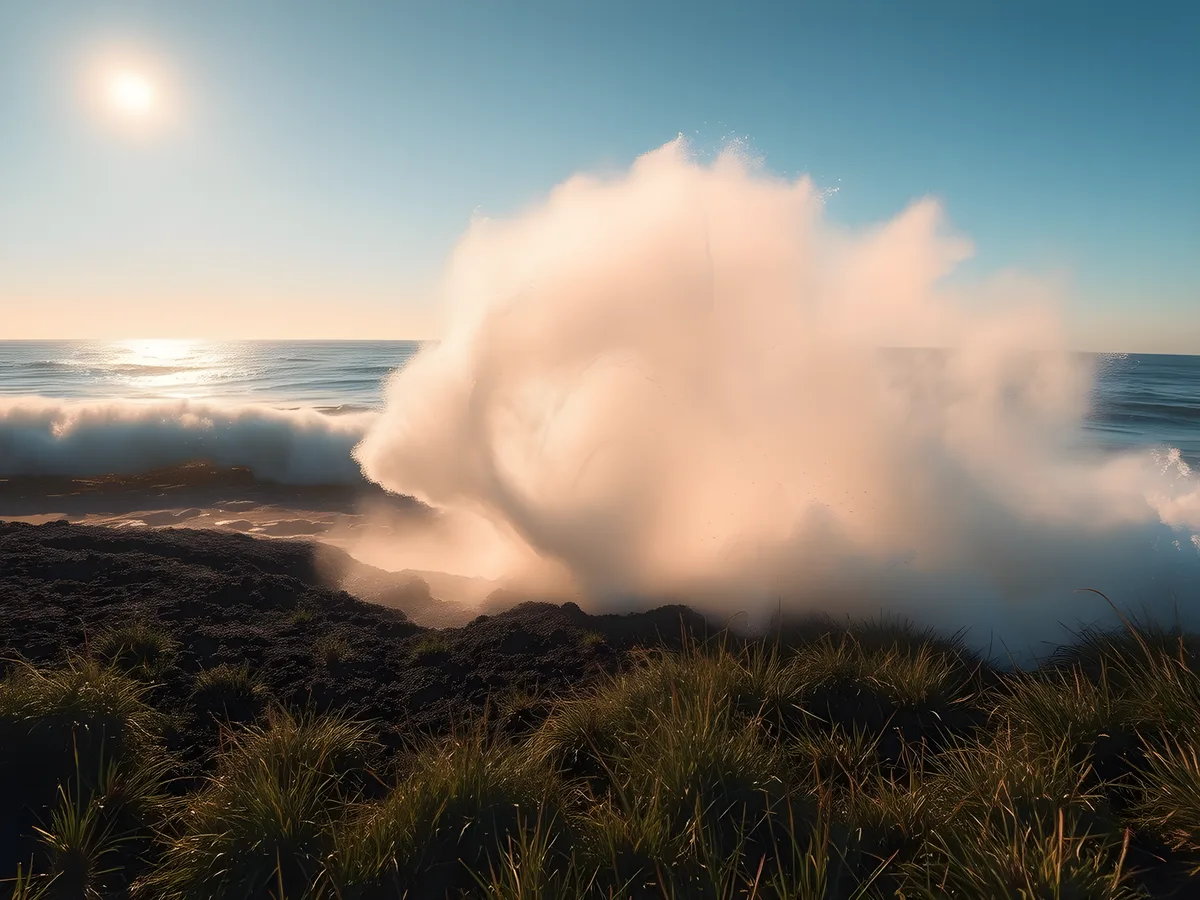
Sea spray drifting over a coastal soil bank (illustration) Illustration · AI generated
- Credit
- Site illustration (AI-generated, Flux)
- License
- Site original terms pending
- Made with
- FLUX.1-schnell (fp8, Comfy-Org/Flux-1-Schnell) · ComfyUI (local), tools/content/generate_l3.py
Picture Credits

Lane legend: real image, data graphic, illustration Data graphic
- Credit
- Nanoplastics Observatory
- License
- Site original
- Data
- site-original
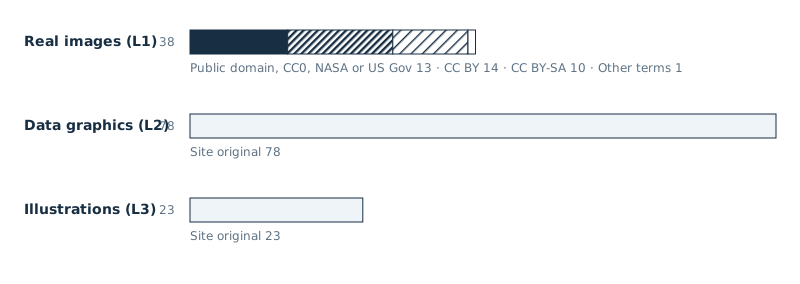
Images on this site by lane and license Data graphic
- Credit
- Nanoplastics Observatory
- License
- Site original terms pending
- Data
- site-derived
Policy & Regulation
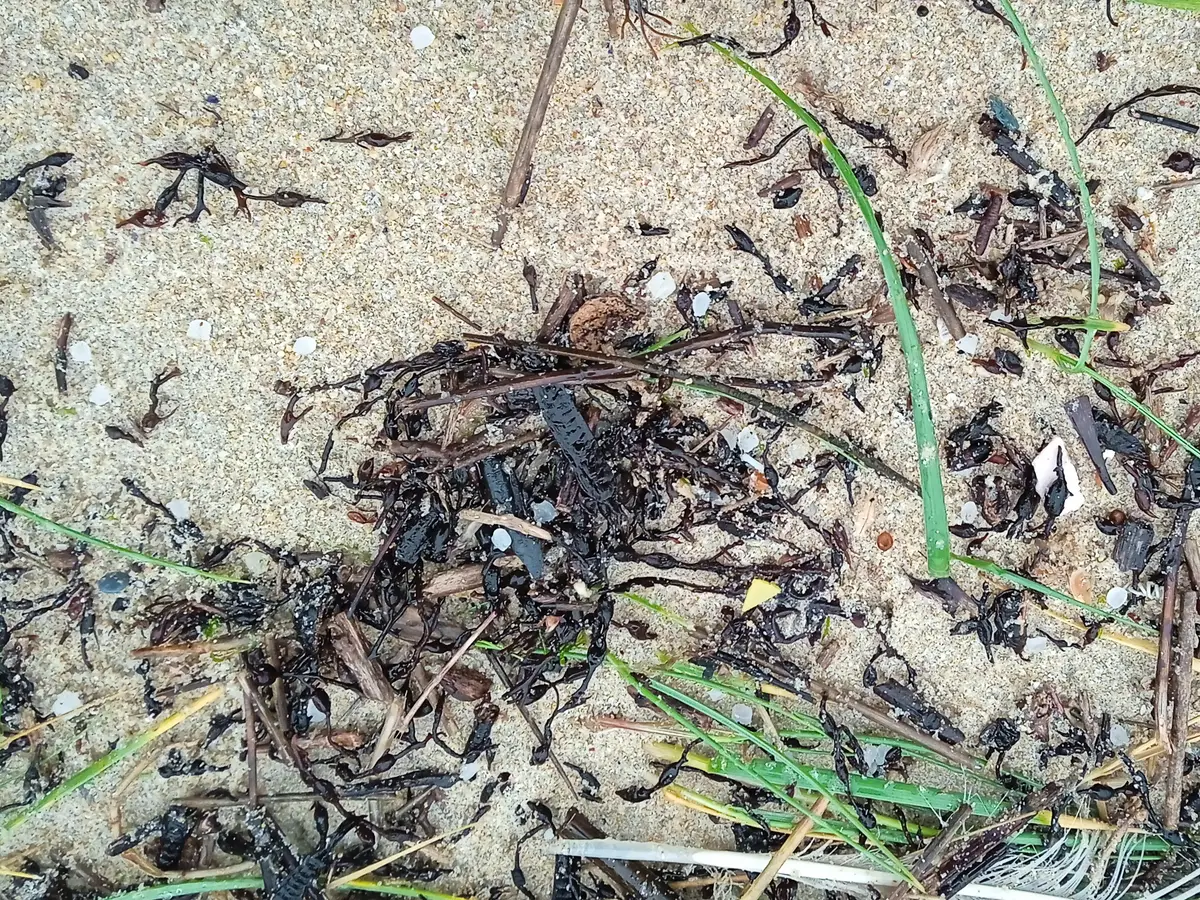
Plastic pellets on Ladeira beach, Corrubedo Real image
- Credit
- "Granulado na praia de Ladeira, Corrubedo" by Estevoaei, via Wikimedia Commons, CC BY-SA 4.0
- License
- CC BY-SA 4.0
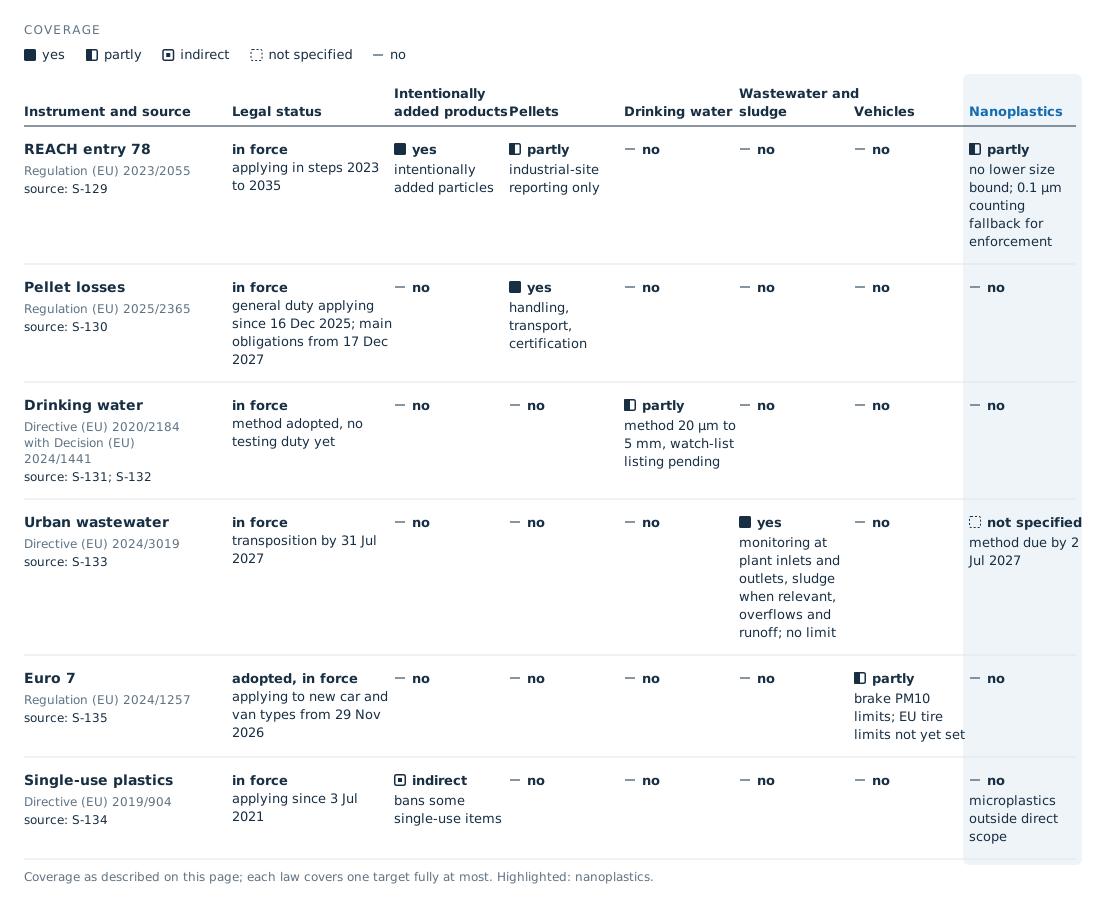
What each EU instrument covers Data graphic
- Credit
- Nanoplastics Observatory
- License
- Site original terms pending
- Data
- S-129
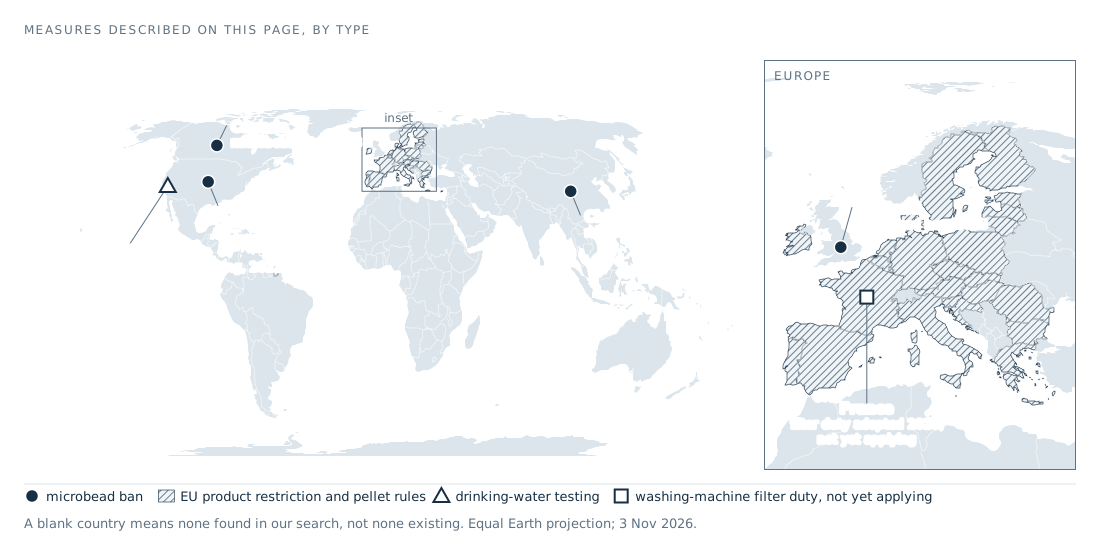
Where the measures on this page apply, by type Data graphic
- Credit
- Nanoplastics Observatory
- License
- Site original terms pending
- Data
- S-129
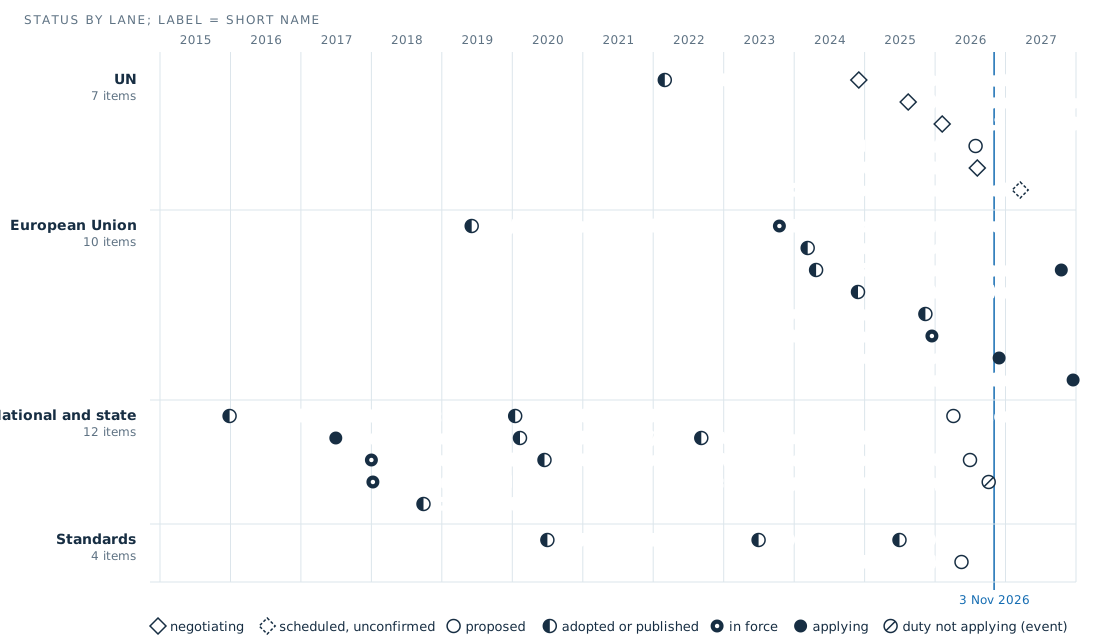
Rules and treaty sessions on micro- and nanoplastics, 2015 to 2027 Data graphic
- Credit
- Nanoplastics Observatory
- License
- Site original terms pending
- Data
- S-129
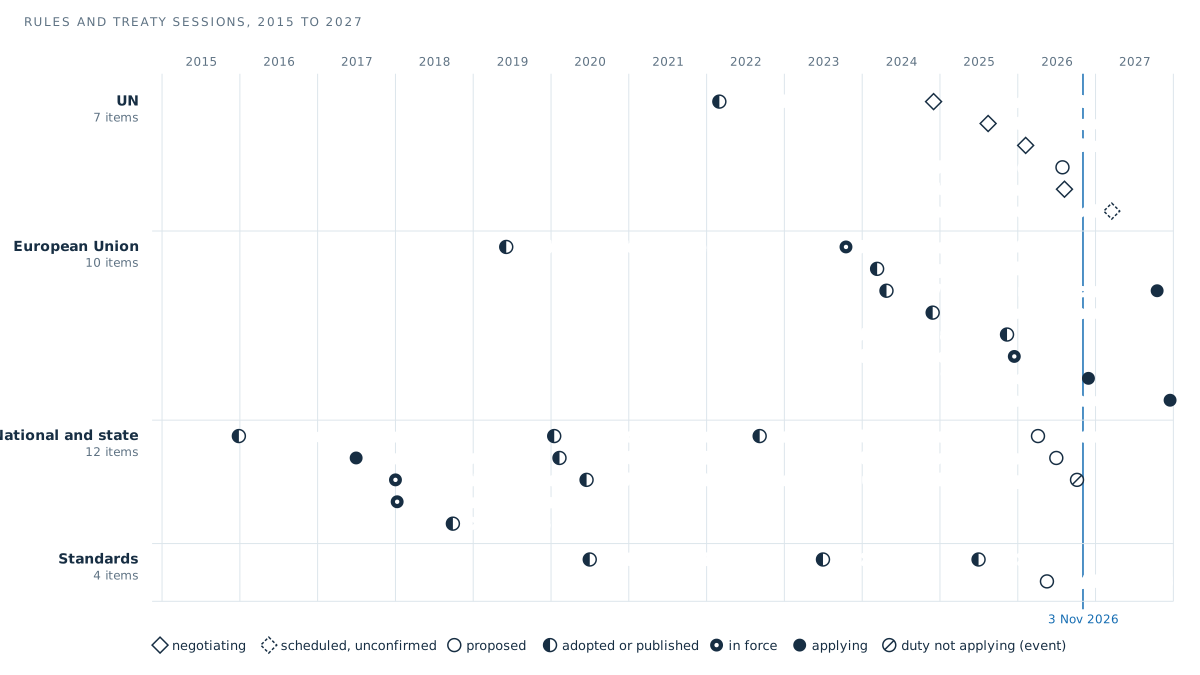
Rules and treaty sessions on micro- and nanoplastics, 2015 to 2027 Data graphic
- Credit
- Nanoplastics Observatory
- License
- Site original terms pending
- Data
- S-129
Soil
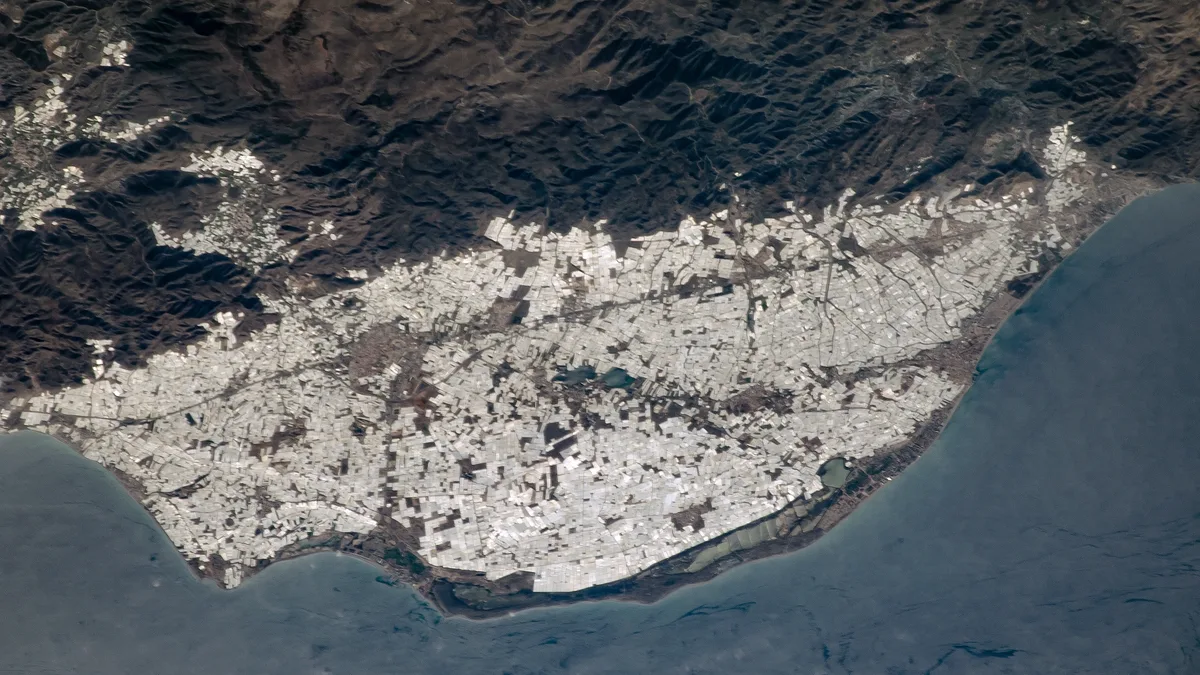
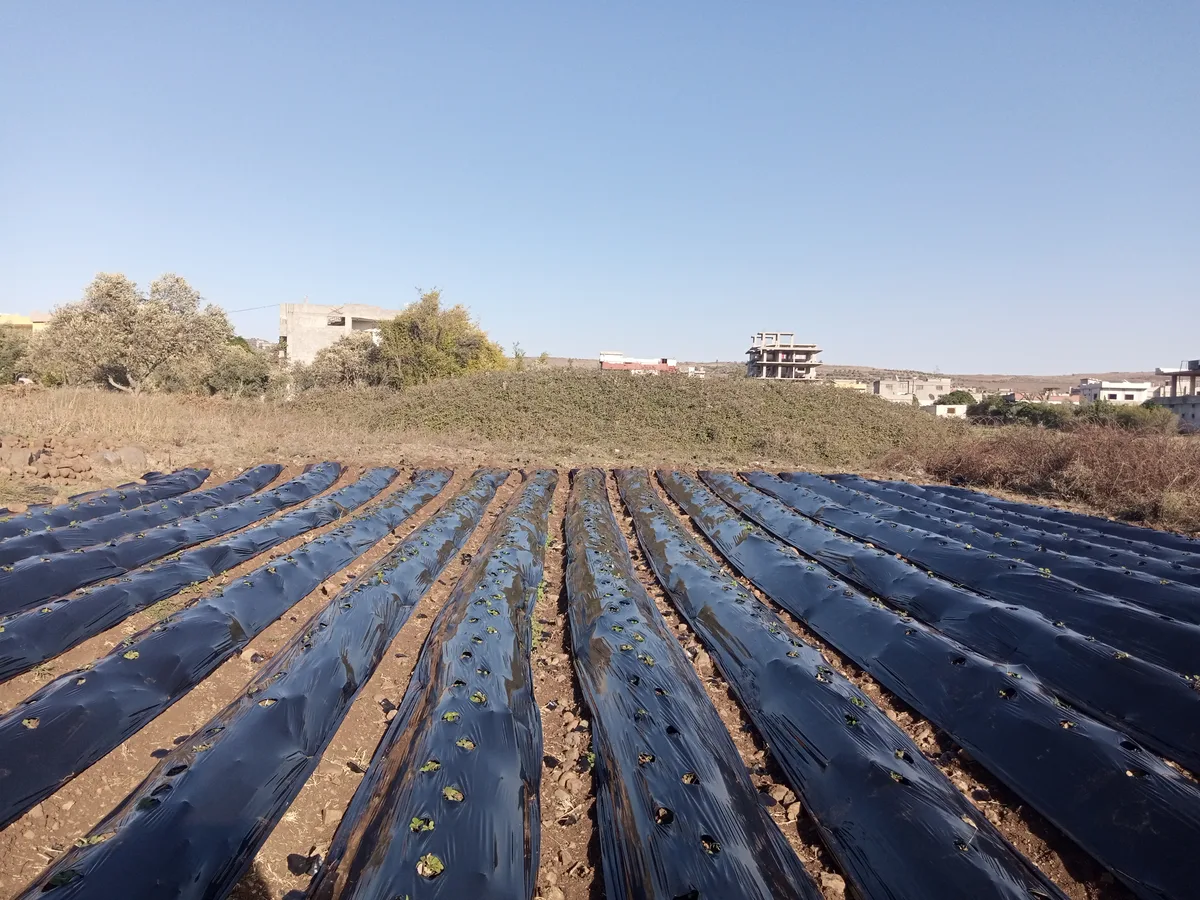
Strawberry field with black plastic mulching in Umm Haratayn al-Gharbiyah Real image
- Credit
- "Strawberry field with black plastic mulching in Umm Haratayn al-Gharbiyah" by Hayan Alhasan, via Wikimedia Commons, CC BY-SA 4.0
- License
- CC BY-SA 4.0
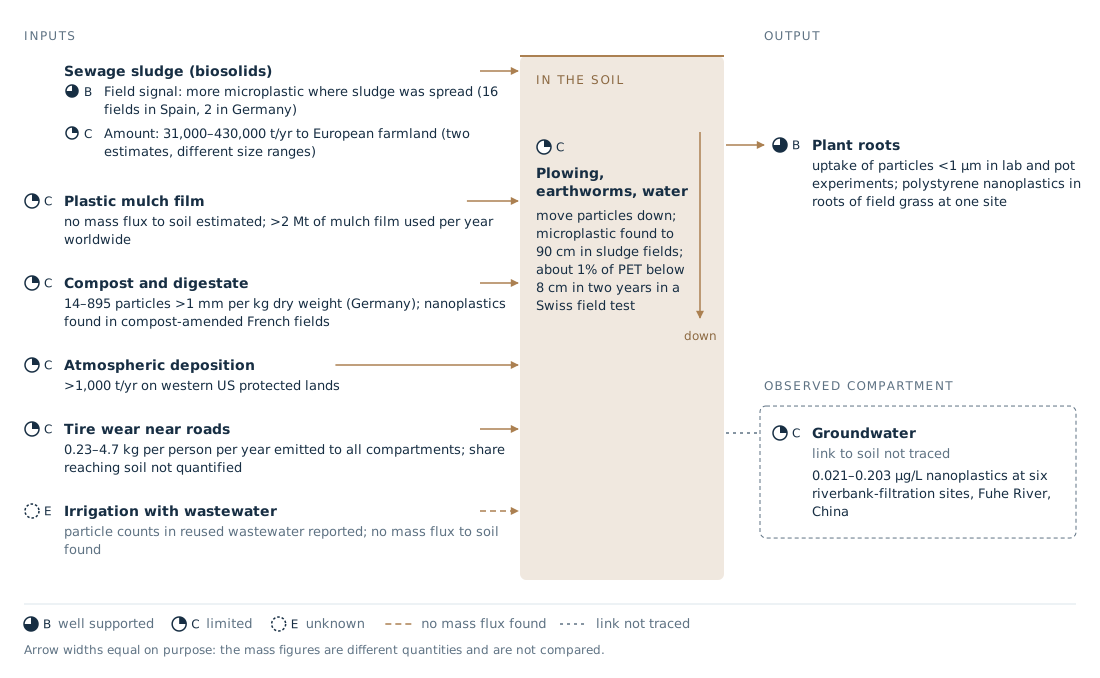
How plastic gets into soil, and what we know about each route Data graphic
- Credit
- Nanoplastics Observatory
- License
- Site original terms pending
- Data
- S-256
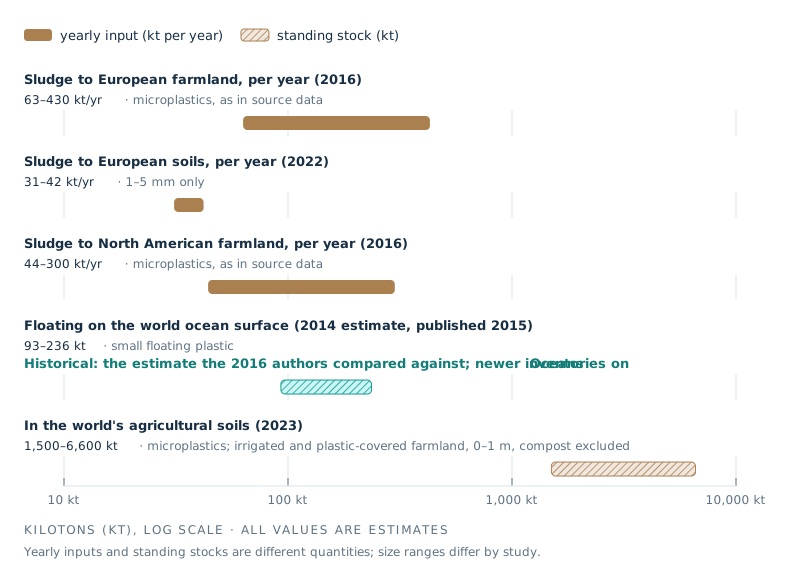
Estimates of microplastic going to soil, and the ocean surface for scale Data graphic
- Credit
- Nanoplastics Observatory
- License
- Site original terms pending
- Data
- S-082
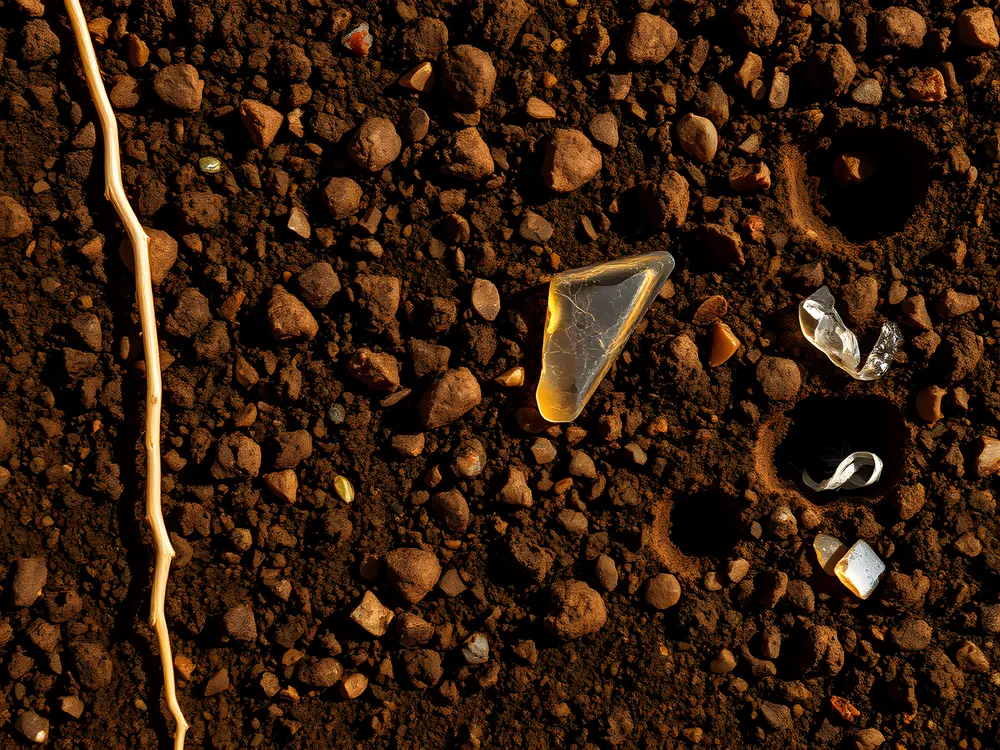
Plastic pieces among topsoil grains (illustration) Illustration · AI generated
- Credit
- Site illustration (AI-generated, Flux)
- License
- Site original terms pending
- Made with
- FLUX.1-schnell (fp8, Comfy-Org/Flux-1-Schnell) · ComfyUI (local), tools/content/generate_l3.py
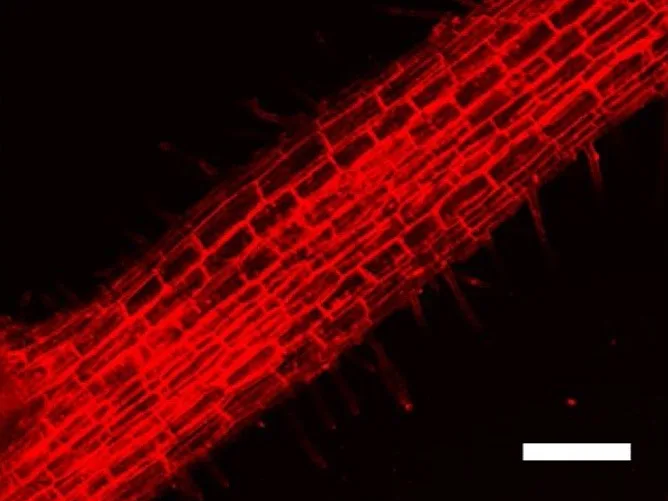
Nile-blue-labelled polystyrene beads (0.2 um) in a wheat root, confocal red channel, laboratory exposure (Li et al. 2020, MethodsX, Fig. 1K) Real image
- Credit
- Figure 1 (panel K) from Li et al. (2020), MethodsX 7: 100750, https://doi.org/10.1016/j.mex.2019.11.023 · CC BY 4.0 · cropped
- License
- CC BY 4.0
Solutions by System
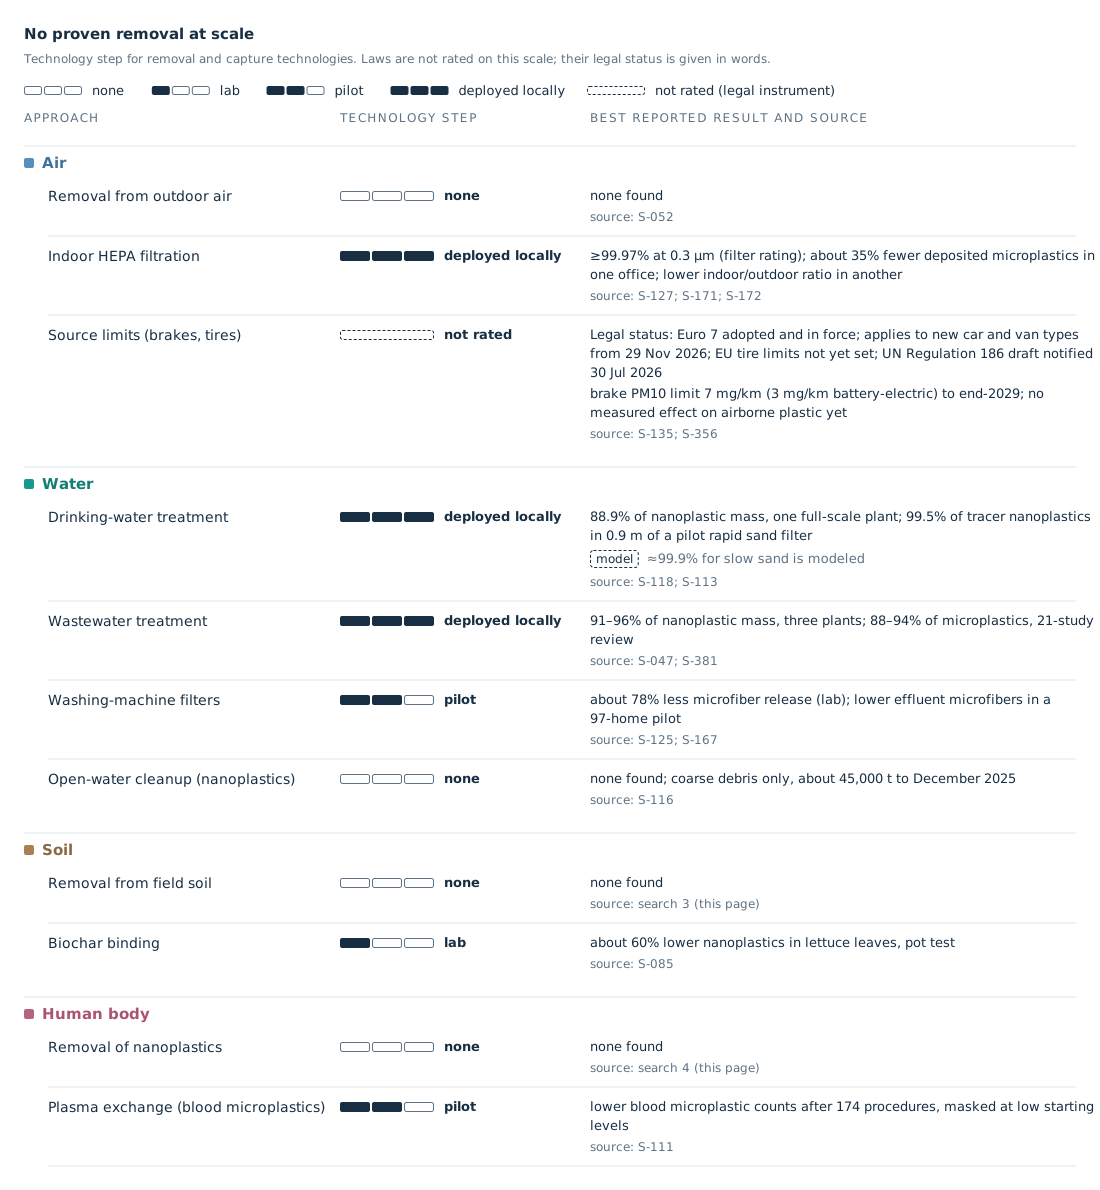
Solution status by system: how far each approach has got Data graphic
- Credit
- Nanoplastics Observatory
- License
- Site original terms pending
- Data
- S-127
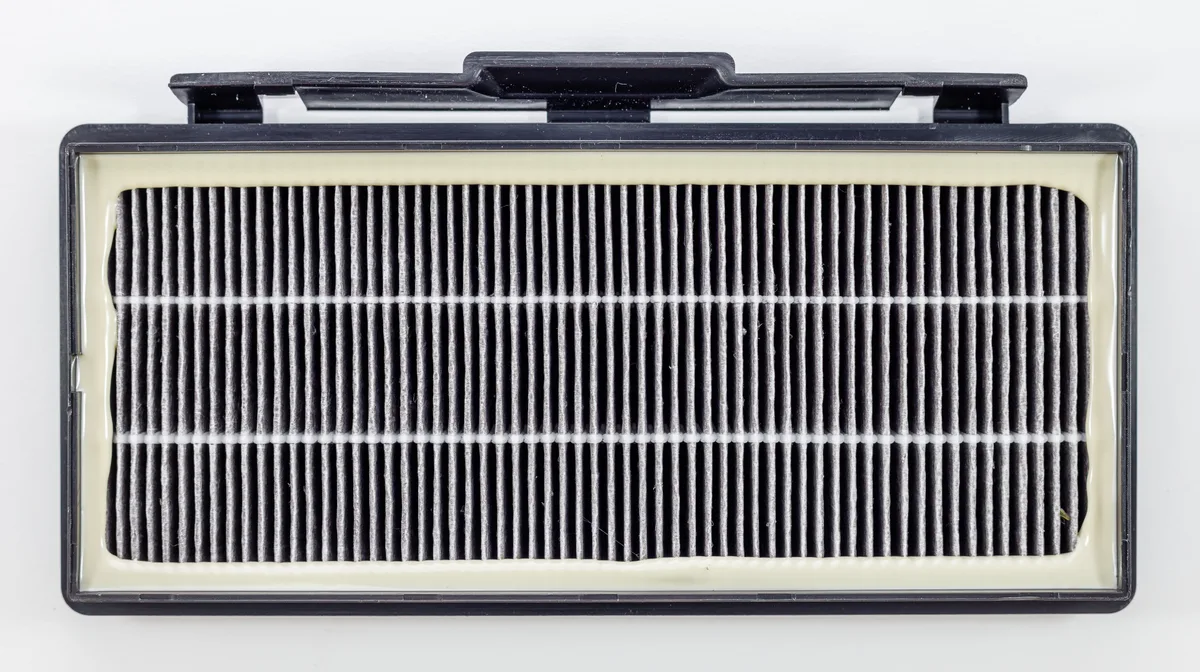
Particulates in a HEPA filter Real image
- Credit
- © Friedrich Haag / Wikimedia Commons / “Staub 003 2024 08 10” / CC BY-SA 4.0
- License
- CC BY-SA 4.0
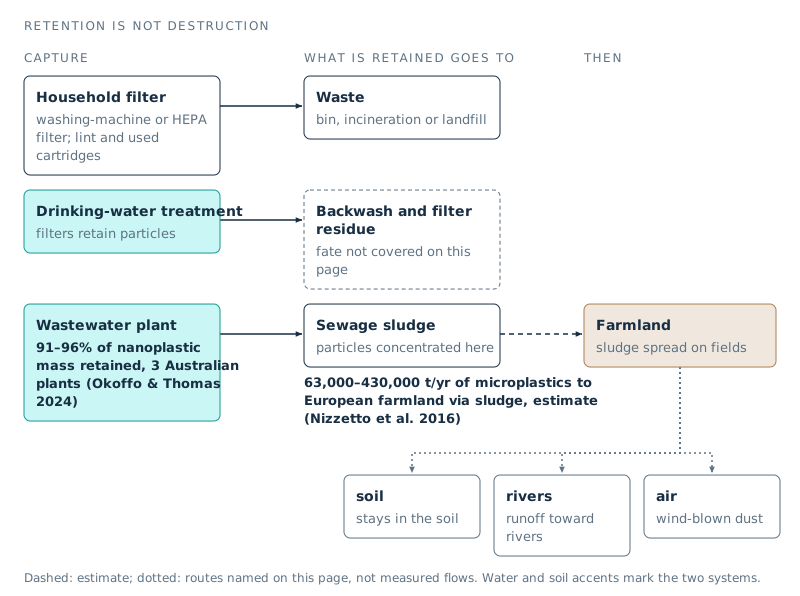
Where captured particles go Data graphic
- Credit
- Nanoplastics Observatory
- License
- Site original terms pending
- Data
- S-047
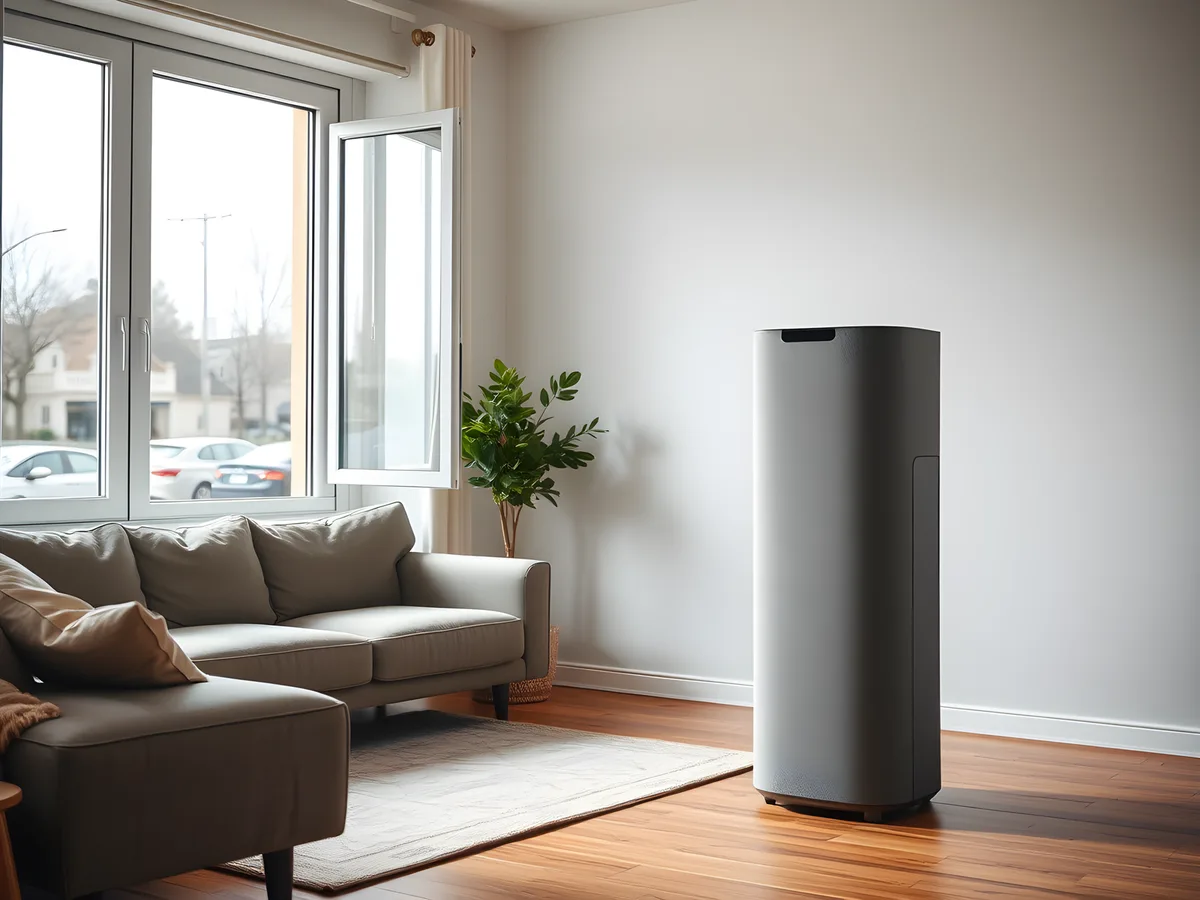
Living room with an air purifier and a window open onto a street (illustration) Illustration · AI generated
- Credit
- Site illustration (AI-generated, Flux)
- License
- Site original terms pending
- Made with
- FLUX.1-schnell (fp8, Comfy-Org/Flux-1-Schnell) · ComfyUI (local), tools/content/generate_l3.py
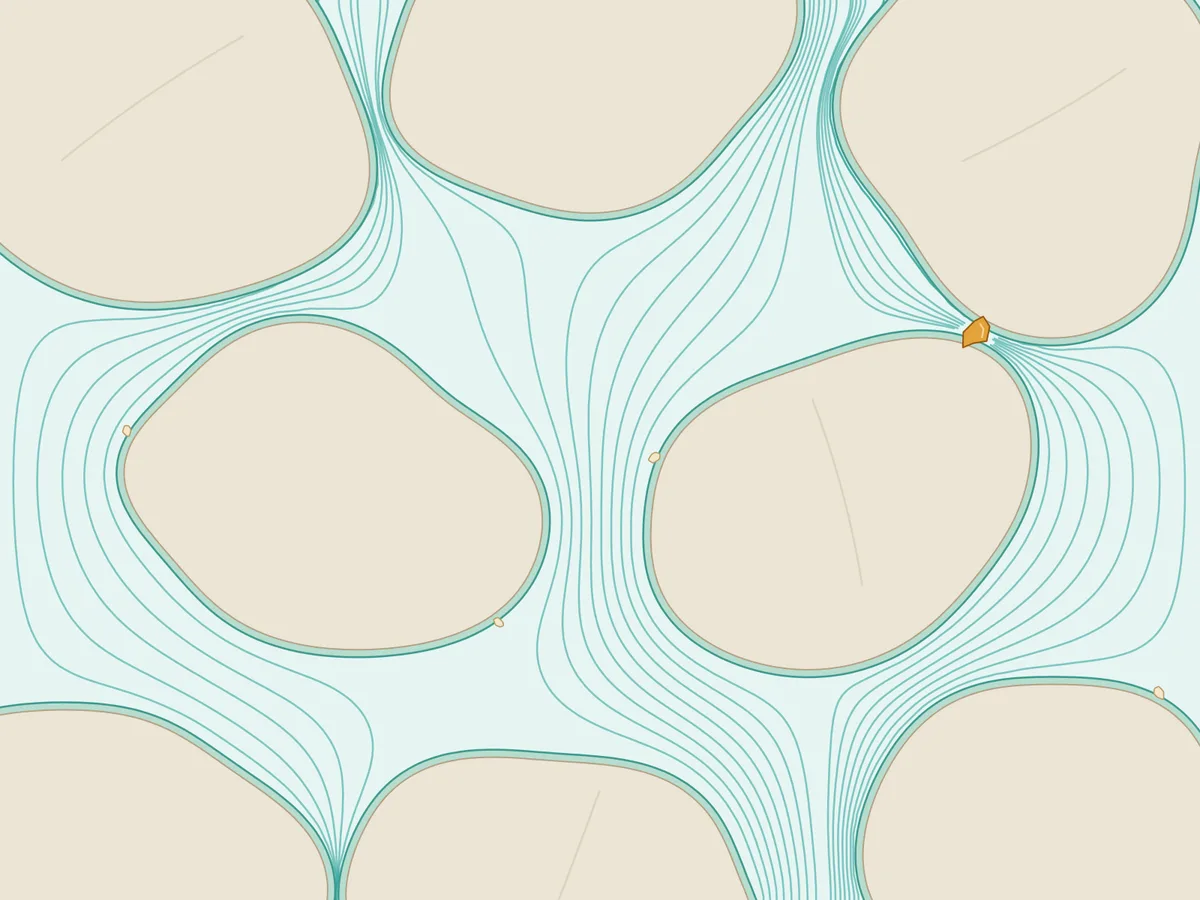
Inside a slow sand filter: biofilm-coated grains hold a small fragment Illustration
- Credit
- Graphic: Nanoplastics Observatory
- License
- Site original terms pending
- Data
- site-original
Methods & Sources
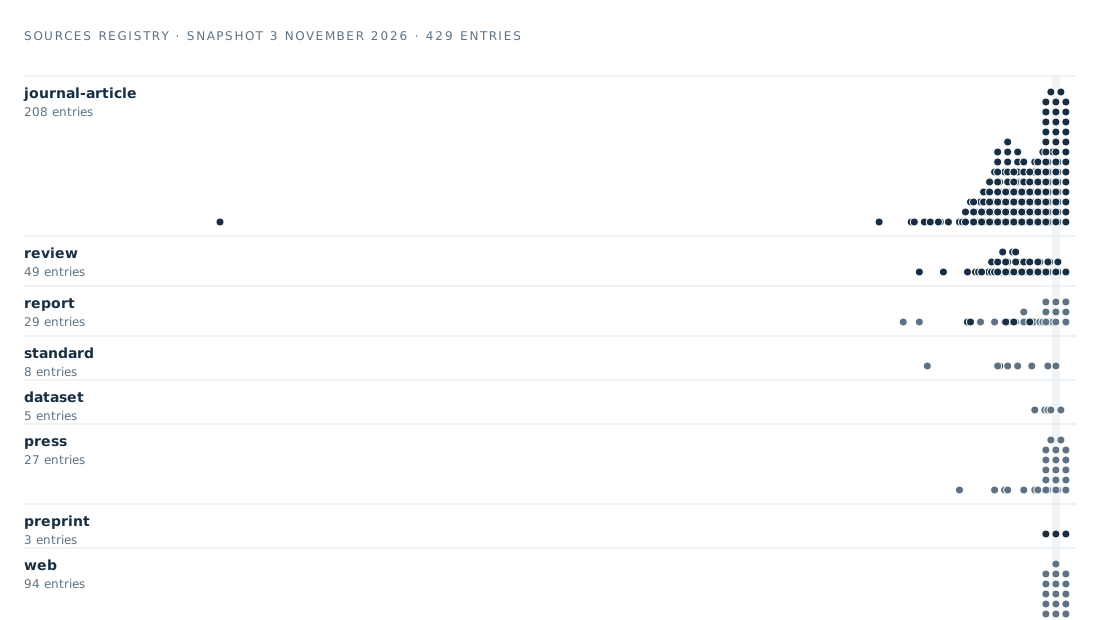
Every source in the registry, by type and year Data graphic
- Credit
- Nanoplastics Observatory
- License
- Site original
- Data
- S-390
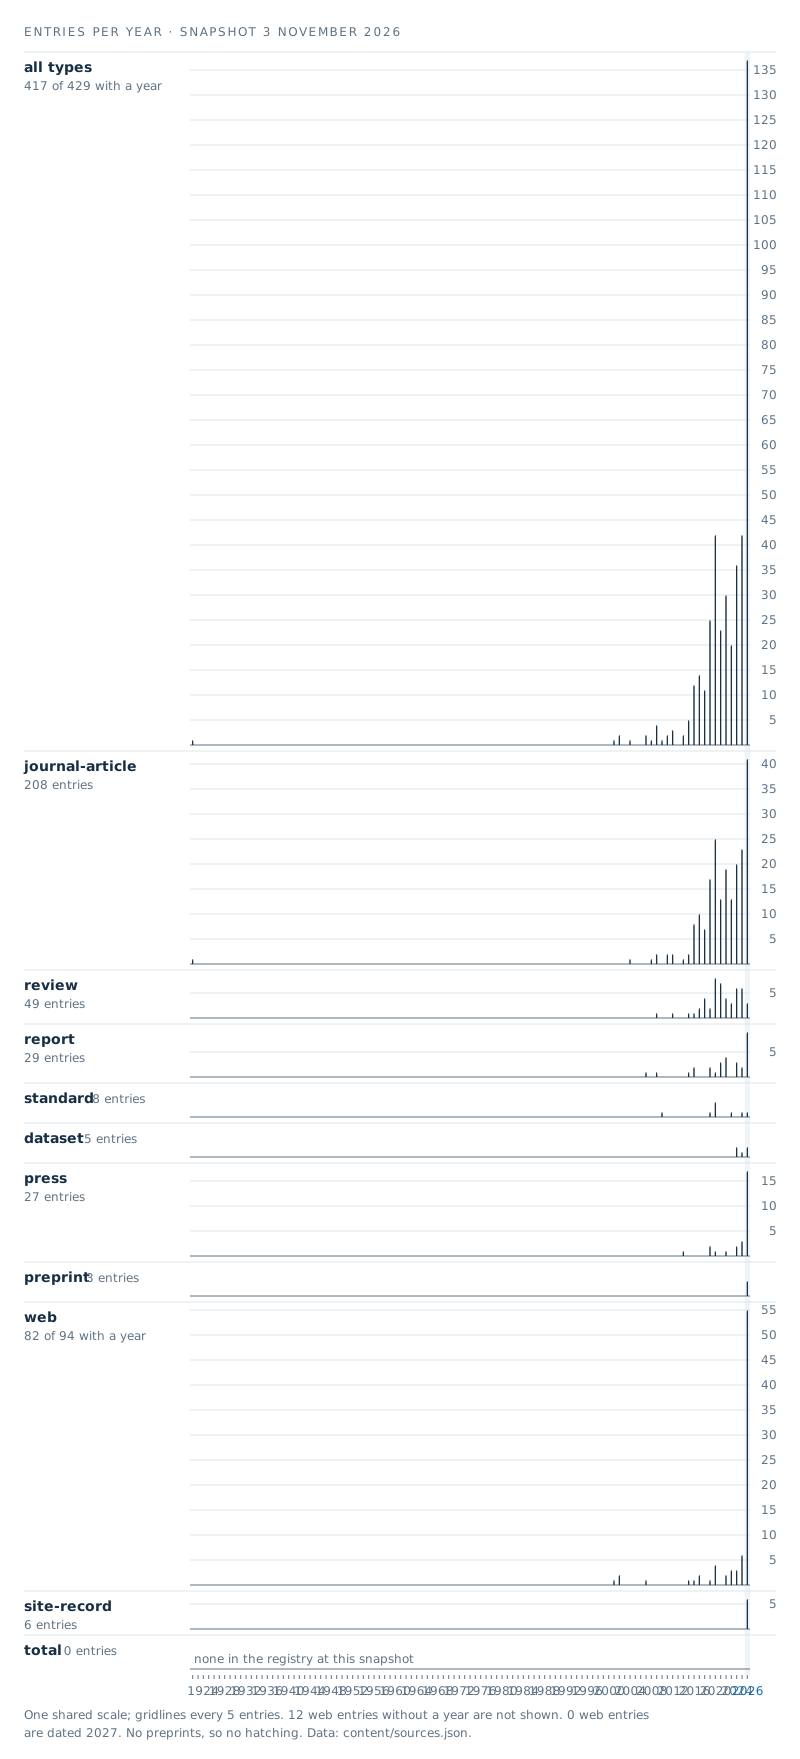
Sources by publication year and type Data graphic
- Credit
- Nanoplastics Observatory
- License
- Site original
- Data
- S-390
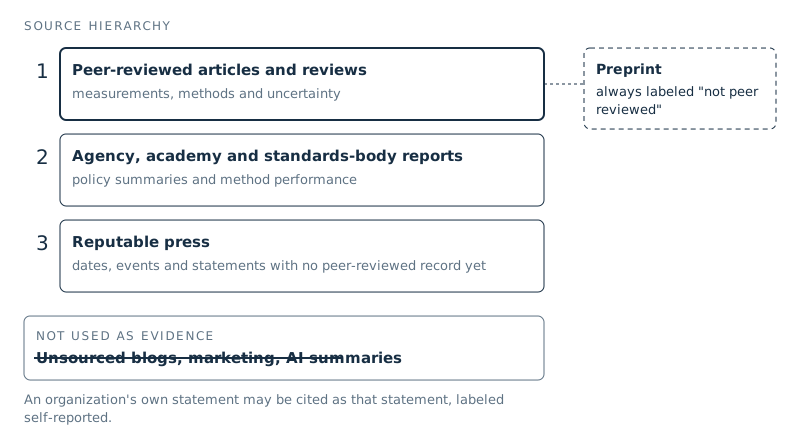
Source hierarchy used on this site Data graphic
- Credit
- Nanoplastics Observatory
- License
- Site original
- Data
- site-original
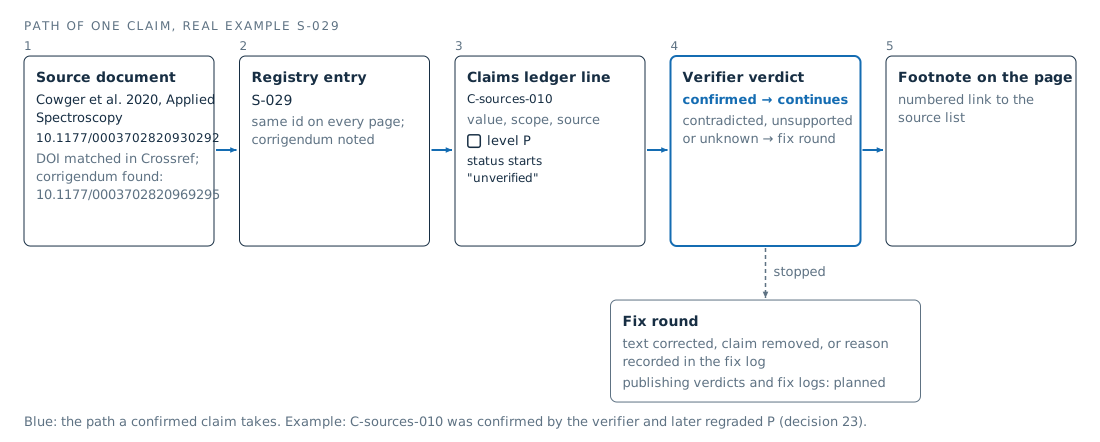
How one claim travels from source to footnote Data graphic
- Credit
- Nanoplastics Observatory
- License
- Site original
- Data
- S-029
This Week
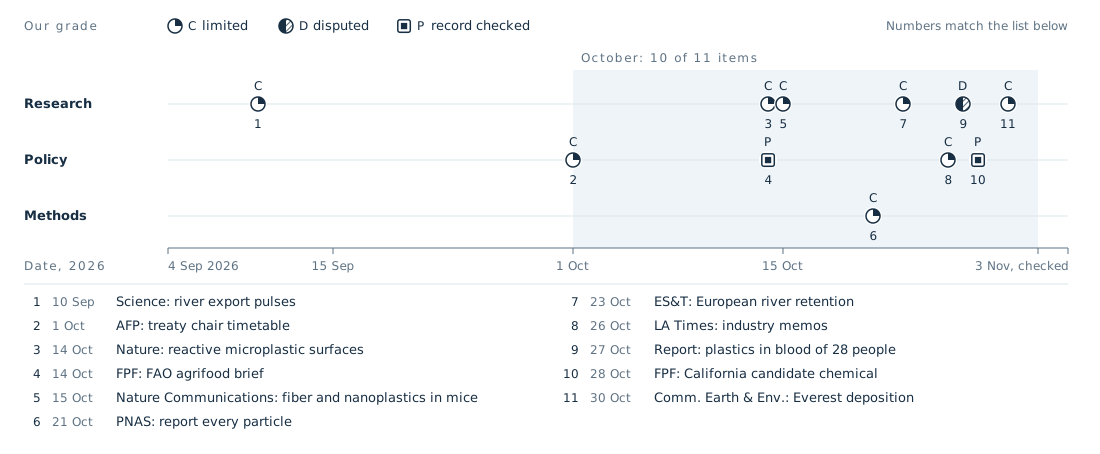
News items on a 60-day line, 4 September to 3 November 2026 Data graphic
- Credit
- Nanoplastics Observatory
- License
- Site original
- Data
- S-395
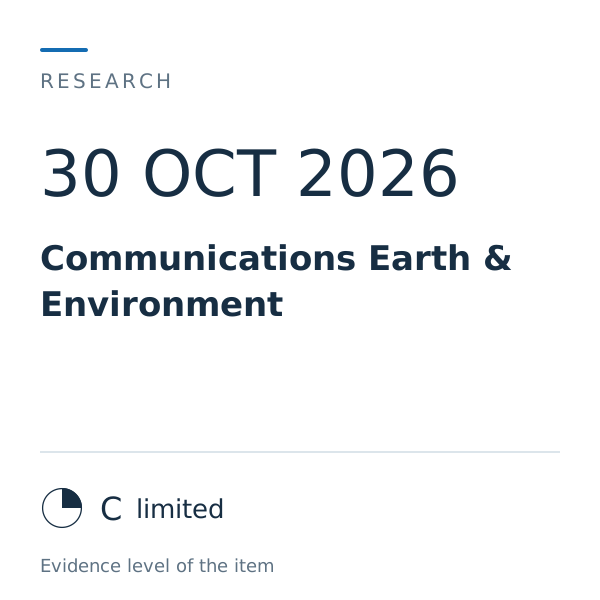
News card template (example: Communications Earth & Environment, 30 Oct 2026) Data graphic
- Credit
- Nanoplastics Observatory
- License
- Site original
- Data
- S-399
How We Work
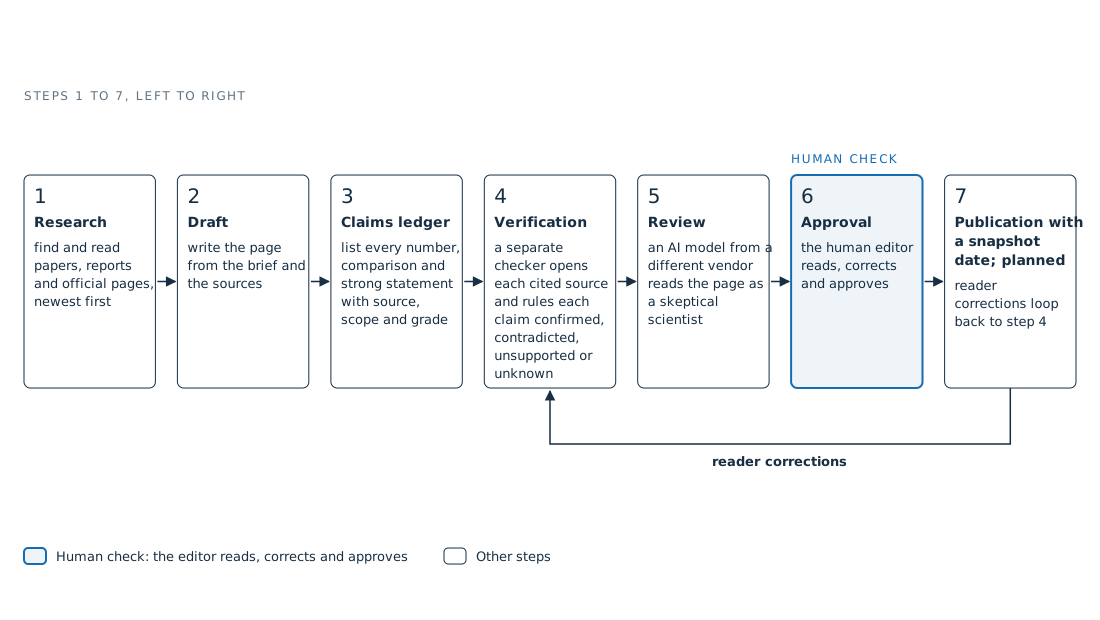
How a page is made Data graphic
- Credit
- Nanoplastics Observatory
- License
- Site original
- Data
- S-392
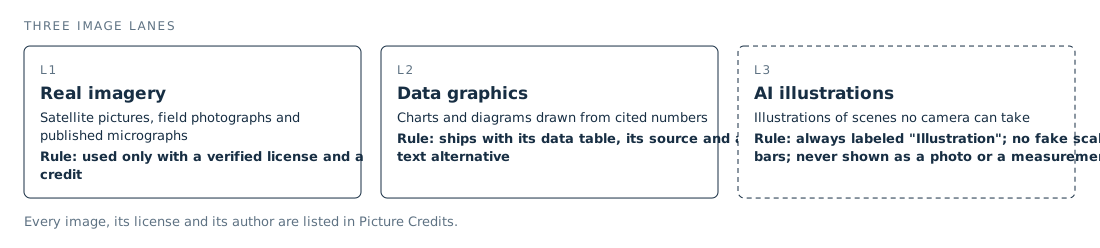
Three kinds of images on this site Data graphic
- Credit
- Nanoplastics Observatory
- License
- Site original
- Data
- site-original
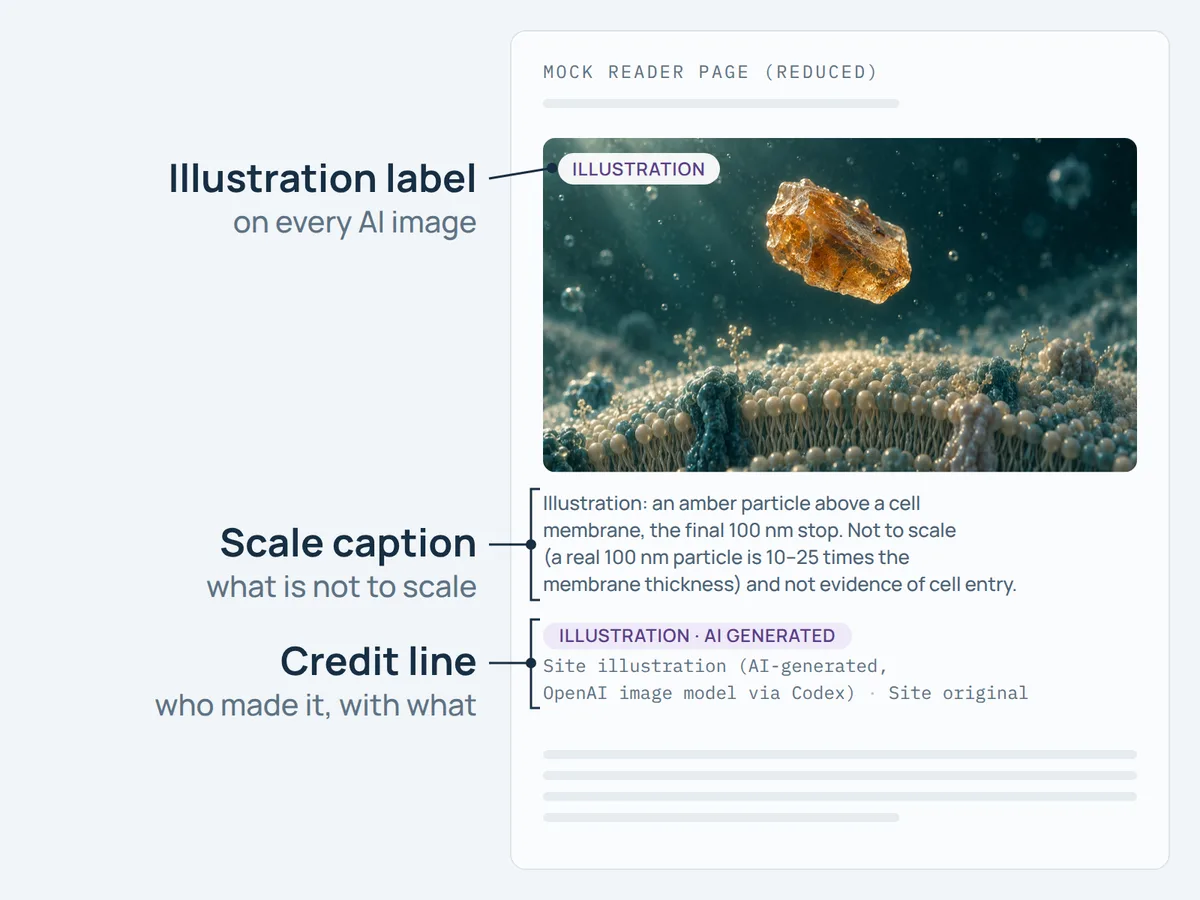
How an AI illustration appears on this site Illustration
- Credit
- Particle frame: Site illustration (AI-generated, OpenAI image model via Codex). Annotated page: Nanoplastics Observatory.
- License
- Site original terms pending
- Data
- site-original
Sources
- Nanoplastics planetary observatory (2026). Editorial decisions record and complete-solution criterion of the Nanoplastics planetary observatory. Nanoplastics planetary observatory (site editorial record). Methods record on this site site record open access
Evidence levels and provenance
- AConsensus
- Multiple independent studies or a systematic review plus a statement by a scientific body.
- BWell supported
- Several independent studies with concordant findings.
- CLimited
- Few studies, narrow conditions, or methodological caveats.
- DDisputed
- Conflicting results; both sides are shown.
- EUnknown
- No reliable evidence found; the search scope is stated.
- PProvenanceUsed on this page
- Provenance: checked against the primary record. A separate category, not an evidence grade: used for bibliographic facts, legal texts, official metadata, definitions quoted from a standard, the site's own arithmetic and statements about the site's process.
Editorial categories of this site. A–E grade scientific findings, per claim, with a one-line rationale; D and E are not lower rungs of the A–C scale. P is not a grade: it marks facts checked against their primary record.