01 / Air
The air around us.
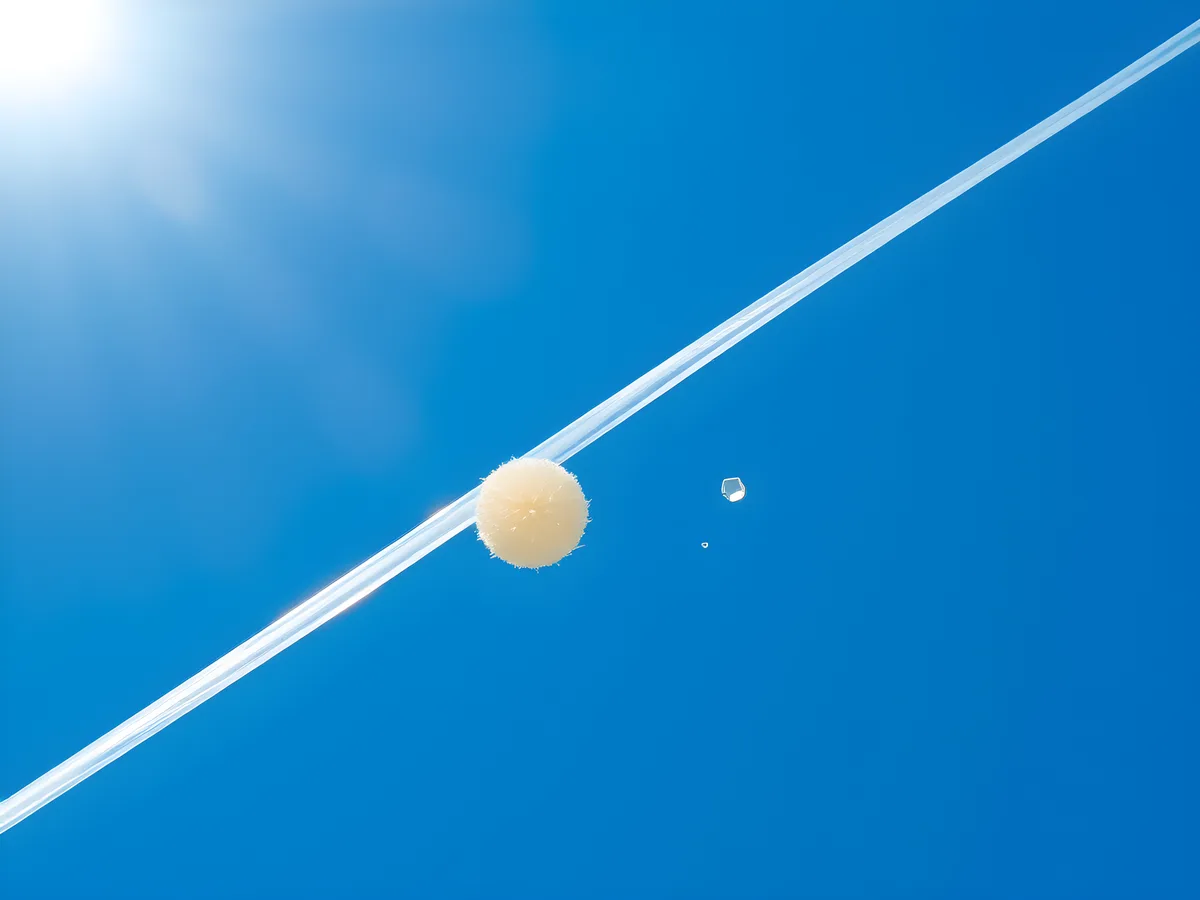
Enlarged illustration of airborne fibres and fragments. Model particles drift, rotate and move through the plane of focus.
0 kgflow model
SIMULATION
FROM THE ATMOSPHERE TO THE HUMAN BODY
Four connected systems share one flow of micro- and nanoparticles — a live model and the state of research for each.
DRAG TO ROTATE · TAP TO ZOOM
EARTH · NASA BLUE MARBLE
MICRO + NANOPLASTICS · LIVE MODEL
Sum of flow scenarios, not a measurement or global production. · Flows & Model: every value and its source ↗
THREE NUMBERS AT THREE SCALES
Each number carries its scope, source and evidence level. All three are estimates, not measured totals. How evidence levels work ↗
≈22 Mt
plastic leaked into the environment worldwide in 2019
all plastic sizes; 88% macroplastics, 12% microplastics below 5 mm; OECD model estimate for 2019, against about 460 Mt produced that year. Single global model estimate from an intergovernmental agency, not a measured total.
≈27 Mt
nanoplastic estimated in the upper North Atlantic
mixed layer of the temperate to subtropical North Atlantic; PET, PS and PVC below 1 µm; 12 stations on one transect, extrapolated to the basin. Single study; polyethylene and polypropylene were not detected and may have been masked; not yet replicated.
100–10,000×
how far models overshot measured airborne microplastic
three earlier emission inventories, size-aligned in a transport model, against measured global medians; 2,782 measurements of air concentration and deposition from 76 studies at 283 locations, 2014–2024; particles 5–100 µm. Particle numbers (the authors converted mass data to numbers); one study, though built on a large compiled dataset.
BELOW THE VISIBLE
Animated illustrations of particle flow. Air, water, soil and tissue have their own dynamics. These are not sample recordings.
01 / Air
Enlarged illustration of airborne fibres and fragments. Model particles drift, rotate and move through the plane of focus.
02 / Water
Translucent fragments in a water column with gentle settling and changing currents. The background and particles illustrate processes.
03 / Soil
Pores, mineral grains and roots create a complex environment for particle retention and transport. This is an illustrative cross-section, not a prediction of transport speed in real soil.
04 / Human body
An illustration of alveolar tissue with a breathing rhythm. Particles illustrate exposure; the counter is not a measurement inside your body.
WHERE ARE THE SOLUTIONS?
Global solutions for cleaning micro- and nanoplastics from air, water, soil and the human body. The displayed 0% is a qualitative indicator used in this review; individual local results are listed separately.
0 / 4 means that none of the four areas — air, water, soil and the human body — has a proven complete solution presented in this review. 0% indicates that this review presents no proven complete solution at global scale. It is a qualitative review indicator, not a measured share of the environment or body cleaned, the efficiency of an individual method, or an official progress index. Percentages for individual methods apply only to the stated conditions. The atmosphere and indoor air filtration are covered in one card: Air.
Counters calculate a specified flow × elapsed time. They use the illustrative micro- and nanoplastic scenario from the previous model, with large uncertainties. Σ includes atmosphere, water and soil scenarios; human intake is separate. Flows may overlap, so Σ is neither unique global production nor a measured nanoplastic-only quantity. Change the scenario in settings. Animated particles and connections are not sensor readings or pollution-source locations. Evidence is a dated literature snapshot from 14 October 2026, without automatic updates.
The rotating Earth uses the NASA Blue Marble composite of 2001 satellite observations, not today’s clouds. Microworlds are animated AI illustrations. Their particles are enlarged for visibility; they are not microscopy measurements or images of a particular person’s tissue.
SMALL LEVERS, HONEST GRADES
Household actions graded by evidence: which lowered particles or fibers in a measured test, which are not quantified and which are myths. Most effects come from single laboratory studies, and lower exposure has not been shown to improve health.

Some household choices lowered plastic particles in a laboratory test, or the fibers a wash sends down the drain. None has been shown to lower the plastic in a person's body or to protect health. Swapping materials is not automatically better: in a 2025 French survey, soft drinks and beer in glass bottles held about 100 microplastic particles per liter, traced to cap paint (level C)1,2. The largest levers are systemic: see Policy & Regulation and Solutions by Approach.
≈100 /L
microplastics in soft drinks and beer sold in glass bottles
France, samples bought June 2023, six per reference; particles 30–500 µm by µFTIR; traced to cap paint1,2
a measurement; the comparison with plastic bottles and cans is disputed (level D)
CLimited≥80%
added nano- and microplastics removed by boiling hard tap water, then filtering
lab test, China; PS, PE and PP particles 0.1–150 µm spiked into tap water harder than 120 mg/L CaCO3 (paper); up to 90% at 300 mg/L and about 25% below 60 mg/L (ACS release)3,4
removal from test water, not a measured change in intake
CLimited2.11 billion
nanoplastic particles released per cm² of container wall
3 minutes of microwave heating; worst container tested; water and 3% acetic acid as food simulants5
release, not measured intake; the effect of switching containers is not quantified
CLimitedEach item gives what it aims to reduce, its level, the effect of the action itself where a study measured one, and the main caveat. Particles released by a product are not the effect of avoiding it; unmeasured changes read "not quantified". See Evidence Levels and How to Read the Numbers. P marks facts checked against a guideline, standard or record.
Limitation
Lower exposure is not a proven health benefit. WHO concluded in 2022 that the data were insufficient for a full quantitative risk assessment of micro- and nanoplastics in food and air (level A)6. We found no study testing whether lowering a person's exposure improves health (level E; Europe PMC, 3 November 2026). For questions about your own or your child's health, ask a doctor. What is known about health effects is on Human Body.
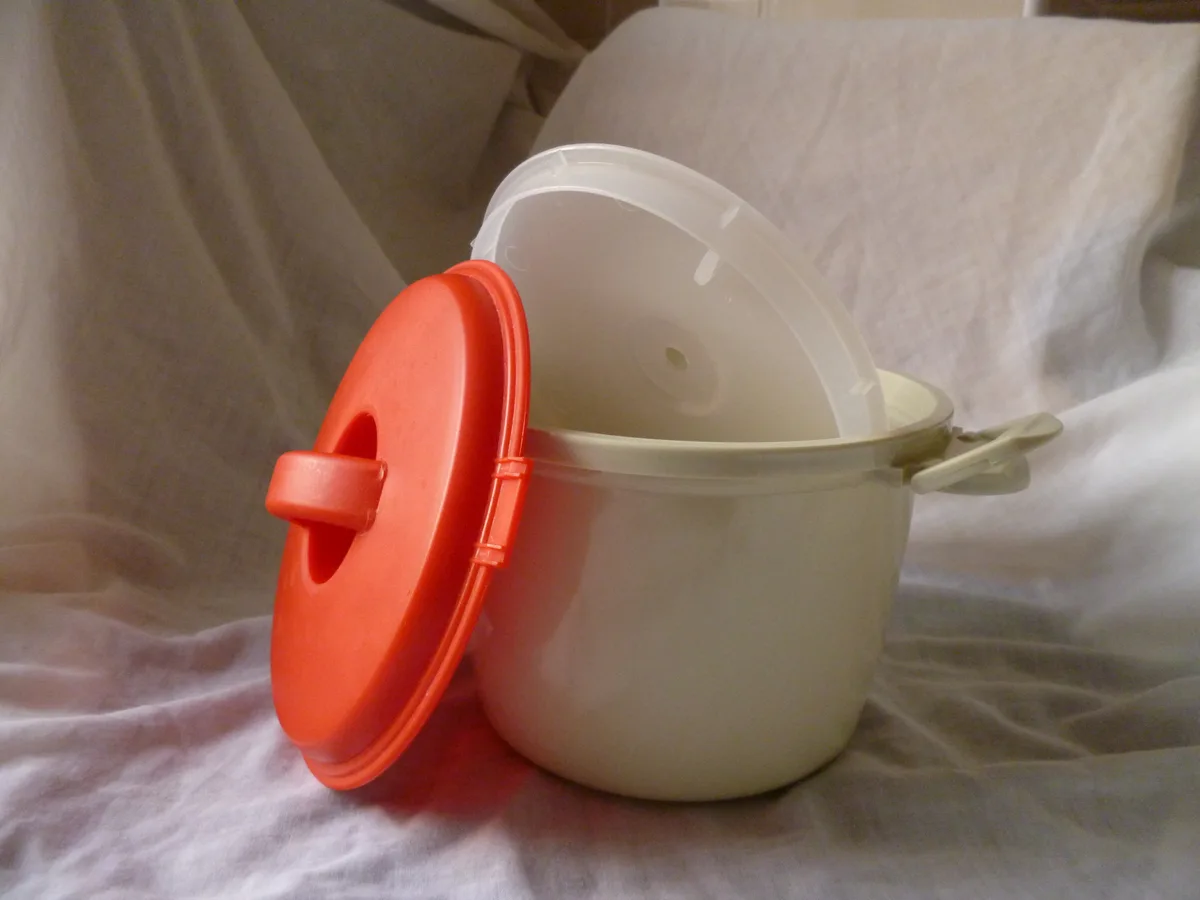
Do not heat food in plastic containers. Exposure, food · level C · effect not quantified. In tests by Hussain and colleagues (2023, USA), microwaving released more particles than cold or room-temperature storage. The worst container released 4.22 million microplastic and 2.11 billion nanoplastic particles per square centimeter in 3 minutes5. Caveat: release into water and dilute acetic acid standing in for food; intake was modeled, not measured.
Use loose-leaf tea instead of plastic mesh tea bags. Exposure, drinks · level C · effect not quantified. Hernandez and colleagues (2019, Canada) steeped single nylon and PET tea bags at 95 °C and counted about 11.6 billion microplastic and 3.1 billion nanoplastic particles per cup7. Caveat: counts by microscopy and particle tracking; the polymer was matched to the bag in bulk, not particle by particle.
Prepare infant formula outside the plastic bottle. Exposure, infants · level C · effect not quantified here. Li and colleagues (2020, Ireland) sterilized bottles of 10 polypropylene products, added 70 °C water and measured up to 16.2 million particles per liter. In unsterilized bottles of the worst product, release rose from 0.6 million per liter at 25 °C to 55 million at 95 °C (supplementary data)8.
The team says it devised and tested a modified routine; we could not read the size of the reduction. It keeps sterilizing and rinsing apart: sterilize the bottle, let it cool, rinse it at least three times with boiled water at room temperature. Mix formula in a non-plastic container with water at no less than 70 °C, cool it, then fill the bottle9. WHO recommends that 70 °C step against bacteria (P)10; keep it, and ask a pediatrician first.
Consider a board that is not plastic. Exposure, food · level C · effect not quantified. Yadav and colleagues (2023, USA) estimated 7.4–50.7 g of microplastics per person per year from a polyethylene (PE) board and 49.5 g from a polypropylene (PP) board11. Caveat: an estimate built on assumptions about chopping habits, for these two plastics only.
What you can do
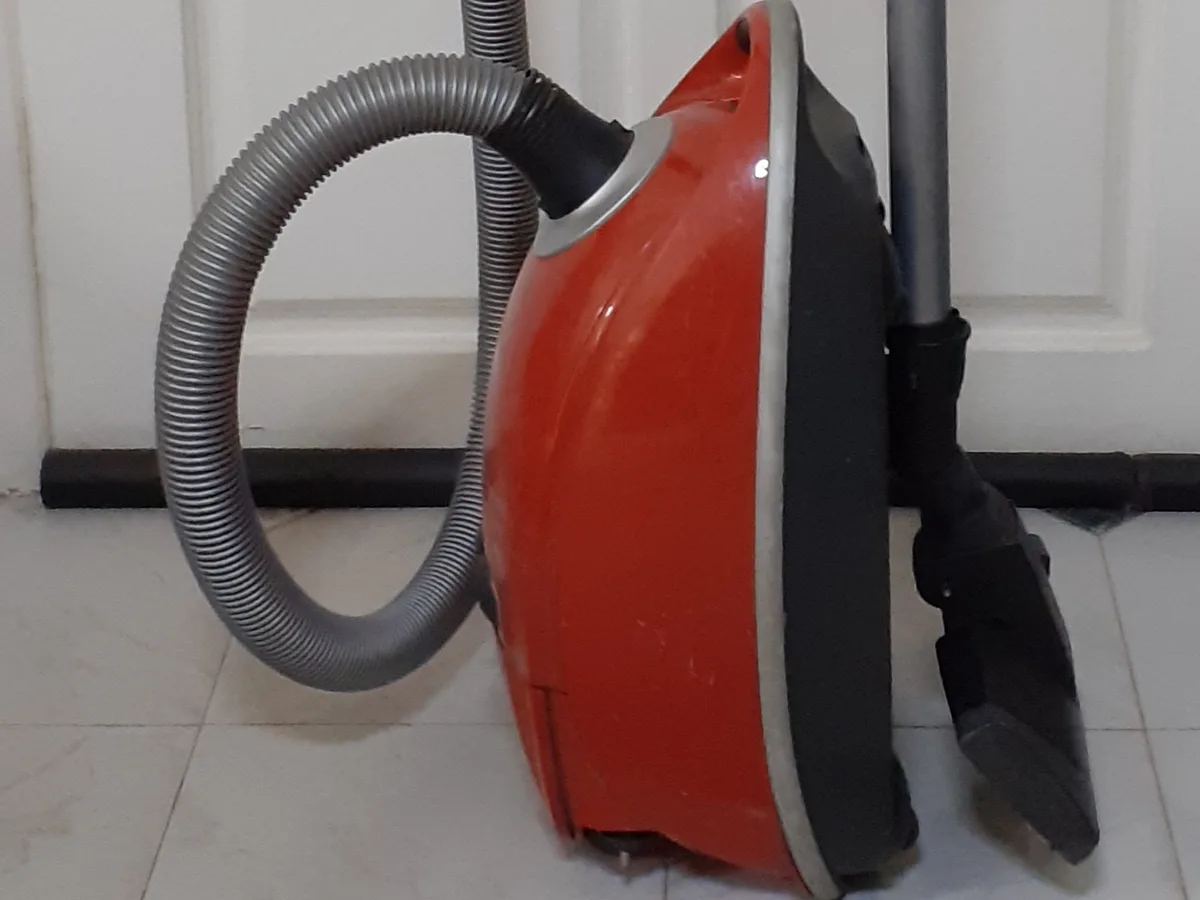
Microwave food in microwave-safe glass or ceramic, and use metal or glass cookware on the stove. In the container and feeding-bottle studies, heat raised particle release (level C)5,8. How much this lowers what you swallow has not been measured.
Boil hard tap water, then filter it. Exposure, water · level C · effect: at least 80% of added particles removed. Yu and colleagues (2024, China) added polystyrene (PS), PE and PP particles of 0.1–150 µm to tap water. Above 120 mg/L of calcium carbonate, boiling locked them into limescale, which a simple filter held back3. The American Chemical Society's release gives up to 90% at 300 mg/L and about 25% in soft water below 60 mg/L4.
Caveat: spiked particles in a laboratory, not measured intake. Use a non-plastic kettle: in the infant-bottle team's tests, three new polypropylene kettles released about 11 million particles per liter in one boil (level C)8.
Tap or bottled water. Exposure, water · level C · effect of switching not quantified. Jamison Hart and Lenhart (online December 2025) applied one method, SEM counts with OPTIR polymer identification, to water from four treatment plants near Lake Erie and six bottled brands. Particles measured 300 nm to 42.3 µm; bottled water had significantly higher counts, especially of the smallest12. Ohio State's release puts bottled nanoplastic counts at three times those in treated water13.
Caveat: plant water, not household taps; counts, not mass; one region. Another method counted about 240,000 particles per liter in three US bottled brands, a count disputed over its blanks (level D)14,15,16. EU tap-water monitoring starts at 20 µm (P)17; WHO's 2019 review found no nanoplastic data for drinking water18.
If you use a jug filter, choose one with a membrane. Exposure, water · level C · effect: 78–86% of PVC and 94–100% of PET fragments removed by the two membrane devices. Cherian and colleagues (2023, Canada) tested three pour-through filters with added particles of 30–1,000 µm. The 0.2 µm membrane did best; a carbon and ion-exchange device released more than went in19. Caveat: three devices, nothing below 30 µm.
What you can do
If your tap water is hard (it leaves limescale in the kettle), boil it in a non-plastic kettle and pour it through a fine filter. In the laboratory this removed at least 80% of added particles from hard water (level C)3; the effect on what you drink each day has not been measured.
Yakovenko and colleagues (2025, Toulouse) measured a median of 528 microplastic particles of 1–10 µm per cubic meter of home air, and 2,238 in car cabins20.
Vacuum often. Exposure, dust · level C · effect not quantified. Across 108 homes in 29 countries, more frequent vacuuming was associated with less microplastic in settled dust (Soltani and colleagues, 2022)21. Caveat: a questionnaire association with no size given in the abstract; settled dust is not inhaled dose, and HEPA vacuums were not compared.
Run a room air purifier. Exposure, air · level C · effect: 35% less deposition in one office. Deposited microplastic counts fell by an average of 35% with purifiers on in a Malaysian university office (conference paper)22. A 2026 office study found lower indoor-to-outdoor ratios with an air cleaner, except with fans running; its abstract gives no single effect size23. Caveat: offices, not homes; deposition is not inhaled dose.
A HEPA filter retains at least 99.97% of 0.3 µm particles, a rating of the filter, not of a room (P)24. Nanoplastic removal in real rooms is unmeasured (level E; Europe PMC, Crossref, 3 November 2026).
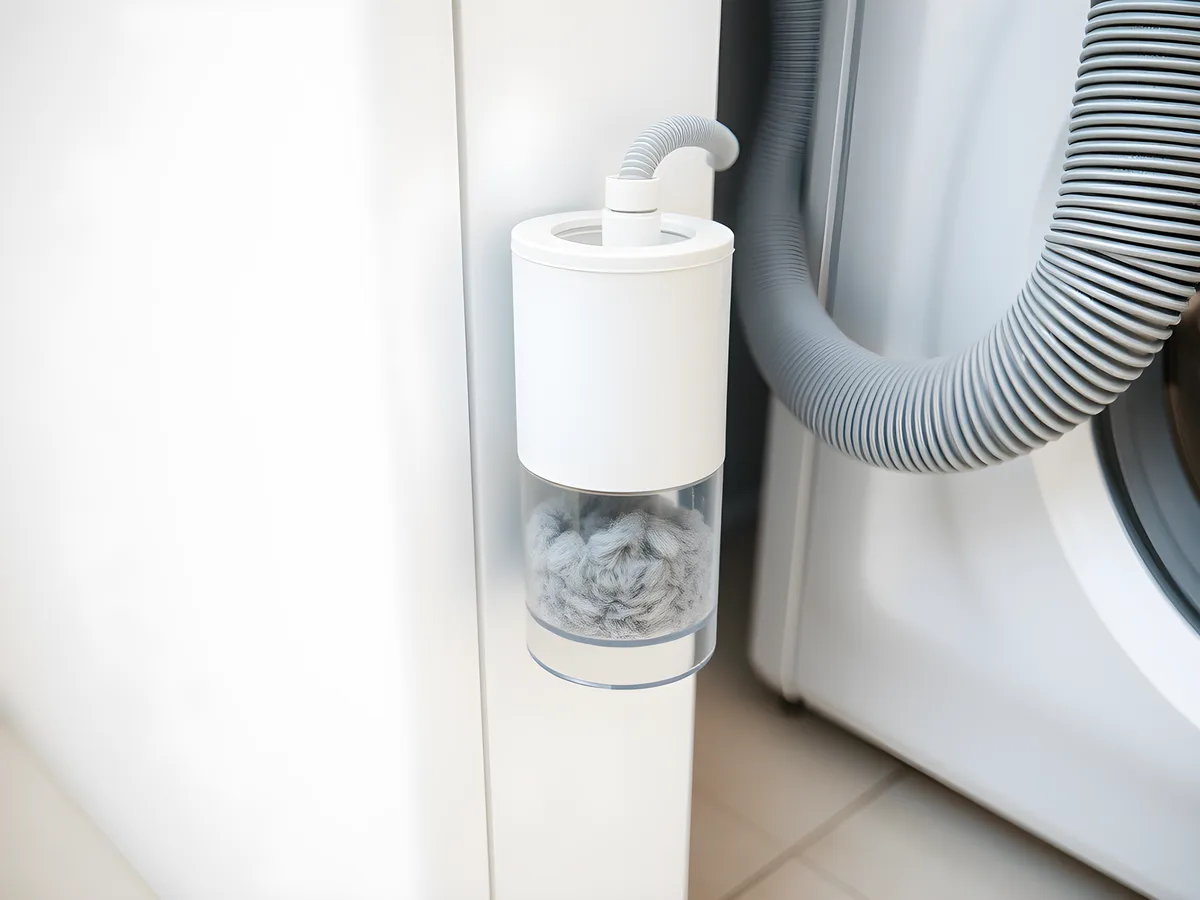
These actions reduce emissions to rivers and sludge, not your own exposure. A 6 kg wash of acrylic garments can release more than 700,000 fibers (Napper and Thompson, 2016)25.
Use an external washing-machine filter. Emissions · level C · effect: about 78% fewer fibers to wastewater, best of six devices compared (Napper and colleagues, 2020)26. In an Ontario town, filters in 97 homes (about 10% of households) came with 41% fewer microfibers in treated effluent27. Caveat: the town result is an association from four sampling events, and changed laundry habits may have added to the drop.
Wash full loads, cold and short. Emissions · level C · effect: 30% less microfiber at 15 °C for 30 minutes than at 40 °C for 85 minutes, in real UK laundry. Loads of 3.5–6 kg released half as much per kilogram as smaller ones28. High-water "delicate" cycles released about 800,000 more fibers per wash than a standard cycle29. Caveat: temperature and time changed together, most fibers were natural, and both studies involved Procter & Gamble.
What you can do
Wash full loads on cool, short cycles and avoid high-water delicate programs. Two studies found less fiber release under these conditions (level C)28,29.
Tire wear is among the largest sources of microplastics on land; per-person emission estimates range from 0.23 to 4.7 kg per year (level B)30.
Drive fewer kilometers. Emissions · level B for the emission factor · effect scales with distance. A review of about 300 measurements put mean passenger-car tire abrasion at 110 mg per vehicle-kilometer31. At that mean, 1,000 fewer kilometers means about 110 g less tire wear (our arithmetic, P). Caveat: wear depends on tire, vehicle, road, weather and driving style.
Brake and accelerate gently. Emissions · level C · effect not quantified. In 76 taxis tracked for 22 months, harsh braking and acceleration mattered most among driving behaviors, though tire type and position mattered more (Liu and colleagues, 2022)32. We found no measured saving for one driver (level E; Europe PMC, Crossref, 3 November 2026). Euro 7 provides for EU tire-abrasion limits (P)33.
"Microplastic detox" supplements. Level C for two early trials, E for marketed products. In a matched, blinded pilot, 11 adults given chitosan for 15 days had lower measured blood microplastics (1.84 to 1.34 µg/mL); 10 placebo controls showed no significant change34. A 2026 randomized trial of 96 people, a preprint, reported more microplastic in stool after a probiotic35. More plastic in stool does not show less in the body; neither trial reported nanoplastics or health outcomes.
We found no trial of a marketed detox product (level E; Europe PMC, 3 November 2026).
Blood cleaning outside trials. Level C. In 114 patients over 174 plasma exchanges, circulating microplastics fell, but plastic leaching back from the tubing obscured the drop at low starting levels36. Nine of the 13 authors list the clinic company Circulate Health as an affiliation (P)36. The abstract reports no size limit, nanoplastic data or health outcomes. A 2026 industry-sponsored pilot is registered; registration is not evidence (P)37.
"Biodegradable" as a cure. Level C. Over three years in sea, soil and open air, none of the biodegradable, oxo-biodegradable, compostable or conventional bags tested deteriorated reliably in all three settings38.
Replacing every plastic item at once. Level C for the cap source, D for the container ranking. The French survey traced particles in glass-bottled drinks to cap paint, so a new material brings its own sources2. The ranking is disputed (level D). The survey's authors report 5–50 times more per liter than in plastic bottles or cans1. Muncke and colleagues counter that per-liter figures overweight the generally smaller glass bottles and ignore plastic contact before filling39,40.
The survey saw particles only down to 30 µm2; we found no published reply to the comment (Crossref, 3 November 2026). Cleaning caps before sealing cut counts in glass-bottled water from 287 to 87–106 per liter, a factory step1.
Not as a treatment. One company-affiliated series saw fewer circulating microplastics, but tubing released plastic back and no health outcomes were reported (level C,36).
Not shown. One same-method study found more particles, especially the smallest, in six bottled brands than in water from four treatment plants (level C,12). We found no study comparing health outcomes (level E).
No. In a three-year field test, no bag type deteriorated reliably in sea, soil and air (level C,38).
The filter is rated for 0.3 µm particles (P,24), but removal of nanoplastics in a real room has not been measured (level E).
Everyday actions by evidence and measured effect
| label | value | unit | setting | level | reduces | source |
|---|---|---|---|---|---|---|
| Boil and filter hard tap water | ≥80% | added particles removed (0.1–150 µm) | lab, spiked tap water above 120 mg/L CaCO3 | C | exposure | S-075 |
| Jug filter with 0.2 µm membrane | 94–100% | added PET fragments removed (30–1,000 µm) | lab, three devices | C | exposure | S-166 |
| Jug filter, carbon and ion exchange only | negative | more particles out than in | lab, three devices | C | none shown | S-166 |
| External washing-machine filter | ≈78% | fewer fibers to wastewater | lab, six devices | C | emissions | S-125 |
| Filters in 10% of a town's homes | 41% | fewer microfibers in plant effluent (association) | Ontario town, four sampling events | C | emissions | S-167 |
| Cold, short wash (15 °C, 30 min) | 30% | less microfiber, mostly natural fibers | UK household loads | C | emissions | S-169 |
| Room air purifier | 35% | fewer deposited microplastics, not inhaled dose | one office, Malaysia | C | exposure | S-171 |
| Drive 1,000 km less | ≈110 g | less tire wear (our arithmetic from a mean factor) | passenger-car mean, about 300 measurements | B | emissions | S-184 |
| No microwaving in plastic | not quantified | release measured, intake change not | lab, food simulants | C | exposure | S-161 |
| Loose-leaf tea instead of plastic bags | not quantified | release measured, intake change not | lab, 95 °C | C | exposure | S-077 |
| Non-plastic cutting board | not quantified | exposure estimated for PE and PP boards only | lab chopping plus assumptions | C | exposure | S-162 |
| Formula mixed outside plastic bottle | not quantified | authors tested the routine; size not available to us | lab, Ireland | C | exposure | S-177 |
| Tap instead of bottled water | not quantified | bottled had more particles in one study | four plants, six brands | C | exposure | S-182 |
| Frequent vacuuming | not quantified | association with dust load only | 108 homes, questionnaire | C | exposure | S-170 |
| Gentler braking and acceleration | not quantified | largest behavior factor in one taxi study | 76 taxis, 22 months | C | emissions | S-185 |
| Detox supplements | not established | no trial of a marketed product | E | none shown | S-175 | |
| Plasma exchange | not established | nanoplastics and health not reported | 114 patients, company-affiliated | C | none shown | S-111 |
 Illustration
These are ways to take part, not actions with a measured effect on particles. Citizen science feeds published research: in Germany, schoolchildren in the Plastic Pirates program sampled litter along rivers for a peer-reviewed survey (P)41. The European Commission's "Have your say" portal accepts comments from anyone on draft EU laws (P)42. What those laws contain is on Policy & Regulation, and what works at plant and city scale on Solutions by System.
Snapshot of 3 November 2026. An action gains a measured effect only when a study reports one; grades are revisited as new work appears. Changed on 3 November 2026: tap versus bottled water cites a same-method study, infant-bottle figures follow the paper's supplementary data, and the glass-versus-plastic ranking is graded D. To report an error, use Corrections & Contact.
Editorial categories of this site. A–E grade scientific findings, per claim, with a one-line rationale; D and E are not lower rungs of the A–C scale. P is not a grade: it marks facts checked against their primary record.
SEVEN LEVERS · ONE MATURITY SCALE
We sort solutions for micro- and nanoplastics into seven approaches across four systems. Five are rated on one maturity scale, from research to locally demonstrated under conditions; measurement and policy get their own status. No approach works across a whole system.
Which solutions work where, and how far has each got? We sort them into seven approaches across air, water, soil and the human body and rate each pair on one scale. After the US and Canadian microbead bans, polyethylene microbeads in the effluent of two Toronto wastewater plants fell by 86% and 76% (level C)1. No approach works across a whole system.
Measurement says where particles are. Prevention keeps plastic from being released. Filtration and capture retain particles. Degradation breaks polymers down with enzymes, microbes or catalysts. Recovery collects loose plastic outdoors. Medical approaches act in the body. Policy sets the rules.
Each cell is one approach acting on one system. Drinking-water treatment counts under water; anything inside the body counts under medical. A 2024 review of twenty years of research calls for clear evidence on the efficacy of solutions (level P)2. Technology detail is on Solutions by System.
Five approaches (prevention, filtration and capture, degradation, recovery, medical) share one maturity scale. Each cell takes the most mature result we found, with its target size, endpoint and setting.
Whole-system reach is a separate field; it reads "no" in every cell, the home page's 0 / 4. Measurement cells say whether a standardized method exists, for which sizes. Policy cells give legal status and any measured effect; a law is not a technical pilot.
Method
Status is not evidence level. Status says how far a method has got; the level (A–E) says how sure we are about one finding, and P marks a fact checked against an official record. A pilot can rest on well-supported (B) evidence, and a locally demonstrated method carries a C if only one study measured it. Every "works" keeps its conditions: particle type and size, setting, time, retained or destroyed. Findings by level are on Evidence by Status.
Prevention is the only approach that acts before plastic is divided among air, water and soil; the size of its effect comes from models. Lau and colleagues found that all feasible interventions would cut plastic pollution by 78% relative to business as usual in 2040. Even so, 710 million metric tons (710 Mt) would enter aquatic and terrestrial ecosystems from 2016 to 2040 (scenario estimates, level C)6. Their package also includes collection and disposal.
Borrelle and colleagues estimated up to 53 Mt a year reaching aquatic ecosystems by 2030 under ambitious commitments (estimate, level C)7. MacLeod and colleagues argue that poorly reversible pollution calls for rapid emission cuts (level C)8.
Measured effects are few. In Toronto, irregular polyethylene microbeads in the effluent of two plants fell by 86% and 76% from 2016–2017 to 2018–2019, after the US (2017) and Canadian (2018) restrictions. Unregulated wax beads did not change (level C)1. The study is observational, counts from about 0.3 mm and covers one product class.
A demonstrator car with an enclosed multi-disk brake emitted about 30% fewer particles than with a conventional brake, counting all particles, not plastic (level C)4. A 2023 review says field tests of tire-wear mitigation are still needed9. Tire wear itself is estimated at 0.23–4.7 kg per person per year (estimate, level C)10. In cotton fields, biodegradable mulch film left less polyethylene and PVC microplastic in soil than conventional film (level C)11.
Elsewhere only release is measured. Washed synthetic fabric shed 124–308 mg of microfibers per kg12, and one Swedish plant lost millions of pellets (nurdles) a year13. Polypropylene feeding bottles released more particles with hotter water (level C)14.
Retention is not destruction. Sewage sludge may carry 63,000–430,000 metric tons of microplastics a year to European farmland, a rough extrapolation (level C)20.
Breakdown works best on collected plastic. Ideonella sakaiensis uses polyethylene terephthalate (PET) as its major carbon source; Yoshida and colleagues saw it degrade a thin, low-crystallinity (1.9%) PET film over weeks at 30 °C (level C)21. An engineered enzyme depolymerized at least 90% of pretreated post-consumer PET within 10 hours at 72 °C, with 3 mg of enzyme per g of PET (level C)22. That is reactor recycling of collected PET.
For dispersed particles, results are laboratory-scale. A TiO2 film under UV light degraded 98.4% of 400 nm polystyrene spheres in 12 hours, packed dry on glass (level C)3; a 2025 review of visible-light photocatalysis finds it mostly partial (level C)23. Weight loss in microbial cultures does not prove mineralization24.
Isotope tracing does: up to 1.2% a year for UV-aged polyethylene with Rhodococcus ruber25, and 0.199% in 14 days with Bacillus velezensis26 (both level C). That second figure is about 5% a year if linear (our calculation), so neither is a ceiling; the set-ups differ.
The Ocean Cleanup reports over 45 million kg of coarse floating debris removed by the end of 2025, a self-reported figure (level C)27. We found no method that collects dispersed micro- or nanoplastics from open water, field soil or outdoor air (level E; searches R1–R3).
No medical approach has been shown to clear micro- or nanoplastics from tissues (level E; search M1). Two small studies report lower circulating microplastics. After 174 plasma exchanges in 114 patients, Weinstein and colleagues report a reduction, obscured at low starting levels by particles leaching from the tubing (level C)28. In a placebo-controlled pilot, 11 adults taking chitosan for 15 days went from 1.84 to 1.34 µg/mL (level C)29.
Neither reports nanoplastics or health outcomes, and blood plastic measurements are contested30. A registered trial of double-filtration plasmapheresis lists an actual start on 12 June 2026 and had posted no results by 3 November 2026 (level P)31.
An effect can be checked only in the size range a method counts. The EU drinking-water method counts particles from 20 µm to 5 mm (level P)32; California's first testing phase reported source-water particles from 50 µm or the method's smallest size (level P)33. In blood, py-GC/MS is currently unsuitable for polyethylene and PVC (level C)30, and a 2026 framework asks for two independent methods34.
Policy turns prevention into obligations: the US microbead ban (2015 act)35, the EU restriction on intentionally added microplastics (from October 2023)36 and the EU pellet regulation (2025)37. Euro 7 applies to new car and van types from 29 November 2026 and to new passenger-car tire types from 1 July 2028 (Article 21, level P)38.
Until 2029 its brake limit is 7 mg/km of PM10 for most cars and vans, 3 mg/km for battery-electric ones. The largest light vans (N1 Class III) get 11 mg/km, or 5 mg/km if battery-electric. Later values follow a review, and from 2035 the limit is 3 mg/km for all. It covers all brake particles, not only plastic (level P)38. Treaty talks at INC-5.2, Geneva, August 2025, were adjourned without consensus (level P)39.
Only the microbead bans have a measured effect in our search (level C)1; for the others it is not yet measured (level E; search P1). See How We Measure It, Policy & Regulation and What You Can Do.
Each cell gives a status, the target particles, the best result and its source. We give no totals, because a cell for coarse floating debris and a cell for nanoplastic mass in wastewater are not units of the same success.
Solutions by approach and system: status on 3 November 2026
| label | value | unit | kind | status | target | note | source |
|---|---|---|---|---|---|---|---|
| Measurement · air | research methods only | measurement | research-methods | micro and nano, air | Campaigns only (one Leipzig street, two weeks); models and measurements disagree | S-061, S-052 | |
| Measurement · water | standardized method, 20 µm and above | measurement | standard | micro ≥ 20 µm; nano not covered | EU method 20 µm–5 mm in ≥ 1,000 L; California reports from 50 µm | S-132, S-194 | |
| Measurement · soil | research methods only | measurement | research-methods | micro and nano, soil | Nanoplastic methods are research tools with matrix interference | S-035, S-036 | |
| Measurement · human body | research methods only | measurement | research-methods | micro and nano, tissue | py-GC/MS unsuitable for PE and PVC in blood; two orthogonal methods advised | S-042, S-044 | |
| Prevention at source · air | pilot | intervention | pilot | brake and tire wear, all particles | Enclosed brake: about 30% fewer particles, demonstrator car on test track | S-195, S-196 | |
| Prevention at source · water | locally demonstrated | intervention | local | PE microbeads ≥ about 0.3 mm | Effluent of two Toronto plants: down 76% and 86% after microbead bans | S-192 | |
| Prevention at source · soil | pilot | intervention | pilot | microplastics from mulch film | Cotton field: less PE and PVC in soil under biodegradable mulch film | S-197 | |
| Prevention at source · human body | research | intervention | research | release into food and drink | Lab: PP feeding bottles release more when hotter; intake not measured | S-076 | |
| Filtration and capture · air | locally demonstrated | intervention | local | 0.3 µm test particles, indoor air | HEPA rated ≥ 99.97% at 0.3 µm for air passing the filter; not a plastic test | S-127 | |
| Filtration and capture · water | locally demonstrated | intervention | local | nanoplastic mass 0.01–1 µm | Three wastewater plants removed 91–96%; retained particles go to sludge | S-047, S-113, S-082 | |
| Filtration and capture · soil | research | intervention | research | model nanoplastics, pot soil | Binding, not removal: Fe-biochar cut lettuce-leaf nanoplastics about 60% | S-085 | |
| Filtration and capture · human body | not applicable | intervention | na | Blood filtration is in the medical row; drinking water in the water cell | not applicable (definition) | ||
| Degradation · air | no demonstrated result found | intervention | none-found | airborne particles | No test of degrading airborne plastic found | search R1 (this page) | |
| Degradation · water | research | intervention | research | PE and PS particles, lab | Photocatalysis mostly partial; PE mineralized 1.2%/yr in one test, 0.199%/14 d in another | S-189, S-187, S-191 | |
| Degradation · soil | research | intervention | research | microplastics, lab cultures | Weight loss in lab cultures over weeks to months; not proof of mineralization | S-190 | |
| Degradation · human body | not applicable | intervention | na | Any action inside the body is in the medical row | not applicable (definition) | ||
| Recovery · air | no demonstrated result found | intervention | none-found | outdoor air | No method found that collects particles from outdoor air | search R1 (this page) | |
| Recovery · water | locally demonstrated | intervention | local | coarse floating debris only | Over 45 million kg by end 2025 (self-reported); no micro or nano recovery found | S-116 | |
| Recovery · soil | no demonstrated result found | intervention | none-found | field soil | No field method found; lab extraction from soil serves analysis | search R2 (this page) | |
| Recovery · human body | not applicable | intervention | na | Any action inside the body is in the medical row | not applicable (definition) | ||
| Medical · air | not applicable | intervention | na | Medical approaches act only on the body | not applicable (definition) | ||
| Medical · water | not applicable | intervention | na | Medical approaches act only on the body | not applicable (definition) | ||
| Medical · soil | not applicable | intervention | na | Medical approaches act only on the body | not applicable (definition) | ||
| Medical · human body | pilot | intervention | pilot | circulating microplastics | Plasma exchange (114 patients) and chitosan (21 adults) lowered blood levels | S-111, S-175, S-112 | |
| Policy · air | adopted, applies from 29 November 2026 (brakes) and 1 July 2028 (tires) | policy | adopted | brake PM10; tire abrasion | Euro 7; no particle-level effect measured yet | S-135 | |
| Policy · water | applying; one local effect measured | policy | applying-effect | added microplastics; pellets | Microbead bans and EU restriction apply; pellet law phased in; effect measured in Toronto | S-136, S-129, S-130, S-192 | |
| Policy · soil | adopted, applies from 17 October 2031 | policy | adopted | granular infill on sports pitches | EU ban on placing granular infill on the market; no effect measured | S-129 | |
| Policy · human body | applying (monitoring only) | policy | applying | drinking water ≥ 20 µm | Monitoring rules (EU method, California testing); no limit values | S-132, S-194 |
One has a measured local effect: polyethylene microbeads in Toronto effluent fell by 76–86% after the US and Canadian bans. Effects of the other rules are not yet measured (level C,1).
Statuses are dated 3 November 2026 and reviewed at each evidence snapshot. A cell moves up only when a source shows the method at the next scale, with its conditions, and moves down if that source is corrected or contradicted. Absence statements mean "not found in this search". Report a status you think is wrong through Corrections & Contact.
Method
Searches behind the absence statements, run in Europe PMC on 3 November 2026, years 2015–2026, first 40 results by relevance screened (all if fewer). P1, rules (47 results): ABSTRACT:(microplastic* OR nanoplastic* OR microbead*) AND ABSTRACT:(ban OR bans OR regulation OR restriction OR legislation) AND ABSTRACT:("before and after" OR effectiveness OR "temporal trend" OR decline OR declined). R1, air (186): ABSTRACT:(microplastic* OR nanoplastic*) AND ABSTRACT:(atmospher* OR airborne OR "outdoor air" OR "ambient air") AND ABSTRACT:(removal OR remediation OR "capture technolog*" OR degradation OR photocataly*). R2, soil (52): TITLE:(microplastic* OR nanoplastic*) AND TITLE:(soil*) AND TITLE:(removal OR remov* OR remediation OR extraction OR "soil washing" OR separation). R3, open water (24): ABSTRACT:(microplastic* OR nanoplastic*) AND ABSTRACT:(ocean OR sea OR river OR lake OR "surface water") AND ABSTRACT:(recovery OR "clean-up" OR cleanup OR skimming OR "magnetic extraction" OR remediation) AND ABSTRACT:(field OR "full-scale" OR "full scale" OR pilot OR "in situ"). M1, body (10): ABSTRACT:(microplastic* OR nanoplastic*) AND ABSTRACT:(plasmapheresis OR "plasma exchange" OR apheresis OR chitosan OR probiotic* OR chelat* OR "dietary fiber" OR excretion) AND ABSTRACT:(human* OR patient* OR participant* OR volunteer*) AND ABSTRACT:(trial OR pilot OR randomized OR randomised OR intervention). Engineering and legal databases were not searched.
Editorial categories of this site. A–E grade scientific findings, per claim, with a one-line rationale; D and E are not lower rungs of the A–C scale. P is not a grade: it marks facts checked against their primary record.
THE FASTEST PATHWAY
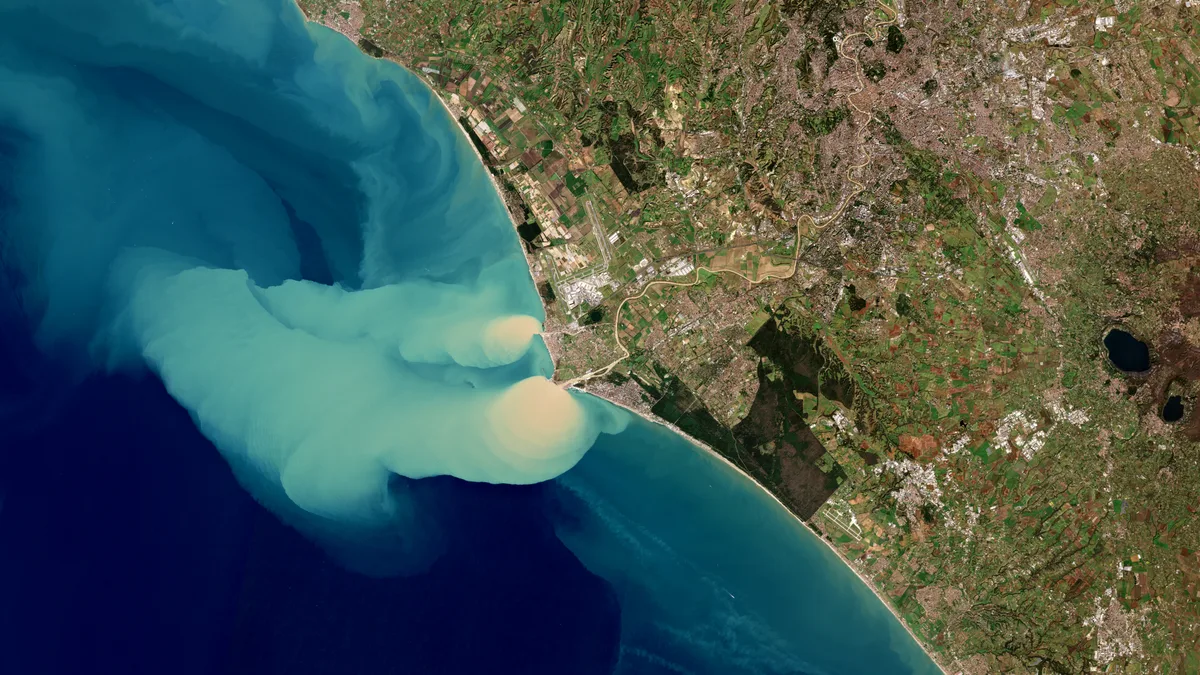
Microplastics fall with rain, snow and dust on cities, protected parks, mountain summits and polar ice. How much the world emits into the air is disputed: in 2026 a comparison with 2,782 measurements found that three emission inventories overestimated measured airborne concentrations and deposition by a factor of 100 to 10,000.
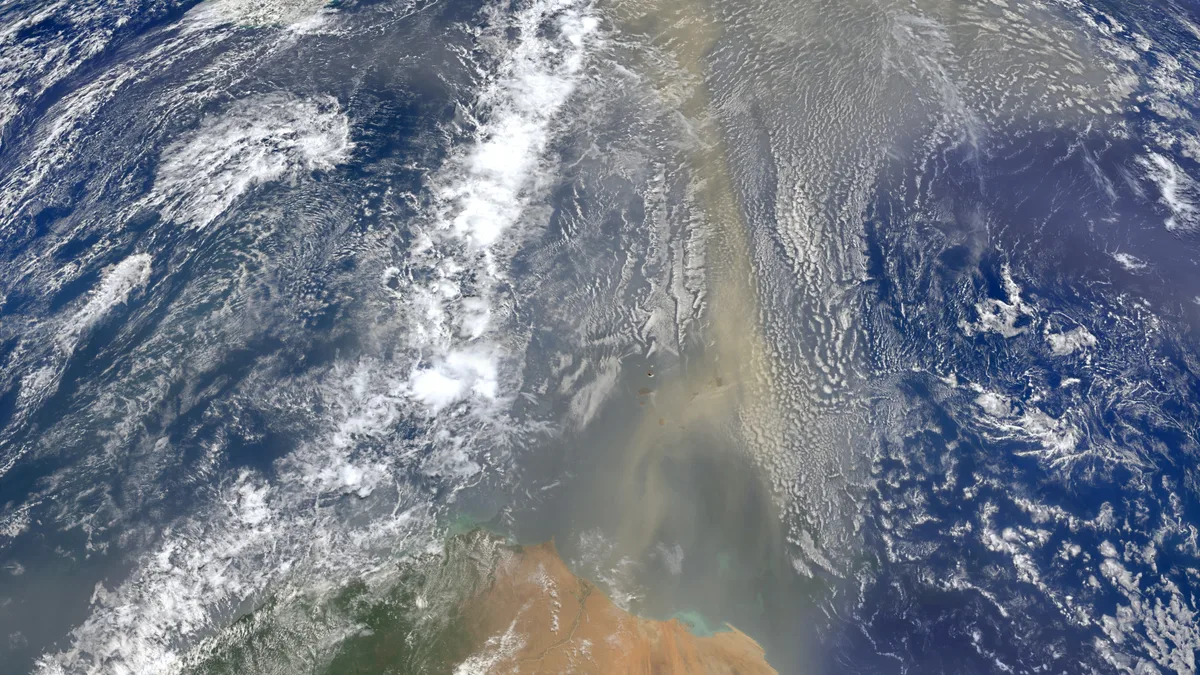
Plastic falls out of the sky. Collectors at 11 western US national parks and wilderness areas averaged 132 microplastic particles per square meter per day (level C)1. The authors extrapolated this to more than 1,000 metric tons a year on protected land in that region1. How much the planet sends into the air is disputed. In January 2026 a Vienna team found that three emission inventories overestimated the medians of 2,782 measurements by a factor of 100 to 10,000 (level C)2.
≈0.08 particles/m³
median microplastic concentration in outdoor air over land
concentration in air; from the 925 concentration measurements among 2,782 compiled (the rest are deposition), 76 studies, 283 locations, 2014–2024; coastal sites excluded; sizes from several µm up; mostly µ-Raman and µ-FTIR2
one compilation of heterogeneous methods; across all sites the mean (31 particles/m³) is about a thousand times the overall median (0.03)
CLimited100–10,000×
how far three emission inventories, run through one transport model, overestimated measured airborne plastic
global median concentrations and deposition; model output aligned to each study's size range, 5–100 µm; Evangelou et al. 20262
single analysis; outside experts question how comparable the compiled measurements are
CLimited≈4,500 t vs ≈1 Mt
two 2026 estimates of global microplastic emissions into the air per year
estimates, not measurements: 0.0045 Tg/yr for 5–100 µm (Nature, peer reviewed) vs 1,001 ± 781 Gg/yr for 5–250 µm (preprint, not yet peer reviewed)2,3
a disagreement of more than two orders of magnitude, partly from different size ranges; the preprint was under review for Atmospheric Chemistry and Physics on 3 November 2026
DDisputed>1,000 t/yr
microplastic deposited on protected lands in the western US
deposition onto the ground; 11 network sites sampled over 14 months (as described in the companion 2021 paper); mass extrapolated from particle counts of about 4 µm and larger1,4
CLimited2,238 particles/m³
median microplastic concentration in car cabin air
concentration in air; particles 1–10 µm; two cars, five samples, southern France; Raman spectroscopy; Yakovenko et al. 20255
small sample; homes in the same study had a median of 528 particles/m³
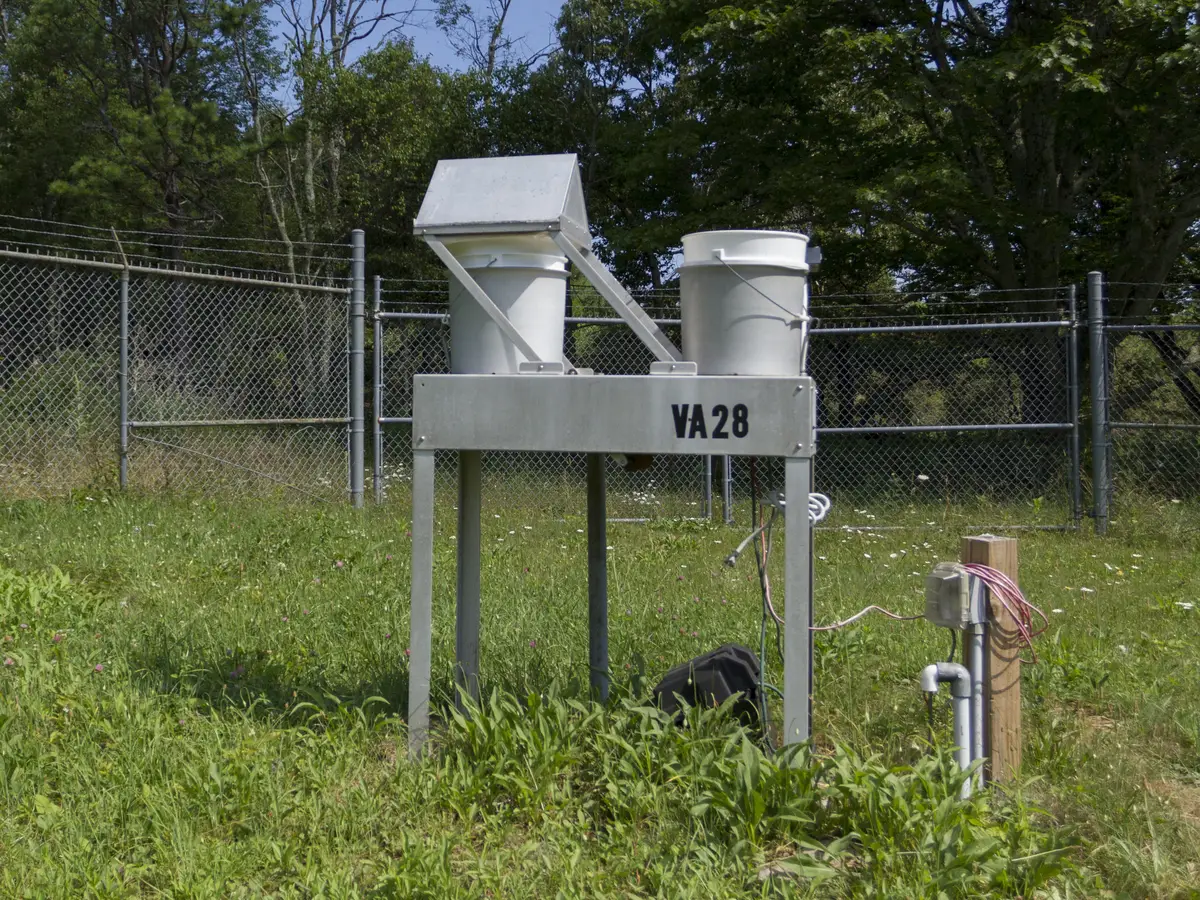
CLimitedAirborne plastic is reported in two ways that are easy to mix up. A concentration counts particles suspended in a cubic meter of air, sampled by pumping air through a filter. A deposition rate counts particles that settle onto a square meter of surface per day, caught in a funnel or a bucket that collects rain, snow and dry fallout. Wet deposition comes down with precipitation; dry deposition settles on its own.
The largest compilation so far, by Ioanna Evangelou, Silvia Bucci and Andreas Stohl at the University of Vienna, gathered 925 concentration and 1,857 deposition measurements made between 2014 and 2024 (level P)2. The median concentration was 0.03 particles/m³ across all sites, 0.08 over land and 0.003 over the open sea, 27 times lower (level C)2. The median bulk deposition over land was 0.0006 particles/m² per second, or about 50 particles/m² per day (our conversion from2).
Single sites vary more. Along the southeast coast of China, reported concentrations range from 0.004 to 190 particles/m³ (level C)2. Reported deposition runs from 50 particles/m²/day in a Chinese suburb to 3,100 at a British urban site2. The global mean concentration, 31 particles/m³, is a thousand times the overall median of 0.03, because a few studies report very high values2.
Size limits drive much of this spread. Most compiled studies identified polymers by µ-Raman or µ-FTIR spectroscopy and reported particles from several micrometers to several millimeters2. Particles smaller than a few micrometers are usually not counted, although particle numbers rise steeply as size falls5,6.
Several independent studies find road traffic a major source of airborne plastic over land, at least near roads, in cities and in western US deposition (level B)4,7,8. A 2026 global inversion by Ondřej Tichý and colleagues, still a preprint, ranks road dust, at 51 ± 31 Gg a year, below agriculture at 170 ± 125 Gg (preprint estimate, level C)3.
Janice Brahney and colleagues fitted a transport model to western US deposition data. It attributed 84% of deposited microplastic to roads, 11% to the ocean and 5% to agricultural dust (model estimate, level C)4. Tire and road wear particles were rare in their samples: in their reading, roads mainly resuspend plastic from many products after traffic grinds it down4.
Studies that target tire rubber chemically, by pyrolysis gas chromatography with mass spectrometry (py-GC/MS), give a different picture. At a roadside in Leipzig in September 2022, tire wear made up about 65% of the plastic mass in particles below 10 µm (level C)7. In Oslo, tire wear particles accounted for more than 90% of airborne microplastic mass (level C)8. These studies count tire wear as plastic; the spectroscopy-based western US samples rarely identified it4.
Textiles shed fibers into air. In Paris fallout, Rachid Dris and colleagues found about 29% of fibers synthetic or mixed (level C)9. They estimated that 3 to 10 metric tons of fibers settle on the Paris area each year9.
The ocean's role is disputed (level D). Two earlier models fitted to western US deposition data made sea spray the largest source by mass. Brahney's put the ocean at about 8.6 million metric tons (8.6 Tg) a year, 95% range 0 to 224. An inversion by Nikolaos Evangeliou and colleagues put it at 8.9 ± 3.5 Tg of a 9.6 ± 3.6 Tg total (estimates, level C)10.
Newer models disagree in both directions. A 2025 global model made the ocean about 0.008% of emissions but about 15% of deposition, mainly a sink (estimate, level C)11. The Tichý preprint counters that oceanic emissions are "likely non-negligible": 763 ± 611 of its 1,001 Gg a year3.
Method
Is tire wear counted as plastic? It depends on what a study looks for. The studies cited here that targeted tire polymers counted it: py-GC/MS in Leipzig and Oslo air and over the Norwegian Sea, TD-PTR-MS in Greenland firn7,8,12,13. Detection depends on the target compounds, calibration and sample treatment, not on the instrument family alone. FTIR imaging of snow listed rubber among the main polymers6. Most surveys compiled in 2026 used µ-Raman or µ-FTIR, while the bottom-up inventory tested there combines traffic wear (tire, brake, road markings, road surface) with ocean and bare-soil emissions2. Measurements and models may therefore not count the same particles.
In the Brahney model, particles of about 4 µm and larger stayed up from one hour to 6.5 days (model estimate, level C)4. The authors suggest smaller particles could stay up for weeks4. In the Vienna model, removal from the air was dominated by settling under gravity rather than by rain2.
That is enough to reach remote places: several independent studies find microplastics deposited at remote mountain, Arctic and polar sites far from local sources (level B)14,6,15,13,16. At Bernadouze in the French Pyrenees, Steve Allen and colleagues measured deposition of about 365 particles/m²/day (5 µm and larger) from November 2017 to March 2018 (level C)14. Air-mass trajectories indicated transport over up to 95 km; the authors note that their data cannot prove long-range transport14.
At the Pic du Midi Observatory (2,877 m), also in the Pyrenees, pumped air from the free troposphere held 0.09–0.66 particles/m³ from June to October 2017 (concentration, µ-Raman, level C)16. Back-trajectories crossed the Atlantic and the Mediterranean, which the authors read as intercontinental and transoceanic transport16.
Snow from the Alps to the Fram Strait held microplastics, with Arctic samples reaching 14,400 particles per liter at 11 µm and above (FTIR imaging, level C)6. Cloud water on Japanese summits from 1,300 to 3,776 m held 6.7 to 13.9 particles per liter, sized 7.1–94.6 µm (level C)17.
Over the Norwegian Sea up to Bear Island, py-GC/MS found up to 37.5 ng/m³ of microplastic in air, with tire wear reaching 35 ng/m³ (level C)12. On Ross Island, Antarctica, snow at all 19 sites sampled in late 2019 held microplastics, about 29 particles per liter of meltwater at 50 µm and above (µFTIR, level C)18. Back-trajectories allow transport of up to 6,000 km, but nearby research stations are a possible local source18.
How much reaches the ocean from the air is a model question. A 2020 simulation estimated that about 100,000 metric tons of tire wear particles a year are deposited in the world ocean (estimate, level C)19. From the few marine deposition measurements, all near coasts, Evangelou and colleagues infer that most suspended microplastic settles close to its land sources2.
Evangelou, Bucci and Stohl ran three published emission inventories through the FLEXPART transport model, matching each simulated value to the size range of its measurement2. All three overestimated the global median concentrations and deposition by two to four orders of magnitude (level C)2. Over land, simulated median concentrations were 105 to 1,506 particles/m³, against a measured 0.08 (level C)2. Before scaling, even the best correlation with measured concentrations was weak (r = 0.33)2.
With data too sparse for an inversion, two global factors cut land emissions to 0.13% of the bottom-up inventory and raised ocean emissions 3.6 times2. The scaled total is 0.0045 Tg (range 0.0006–0.0089), about 4,500 metric tons a year for 5–100 µm (estimate, level C)2. Land emits over 20 times more particles than the ocean, but the ocean emits more mass, about 4,000 against 500 t a year (estimate, level C)2. That split rests on assumed emission size distributions2.
The emission magnitude is disputed (level D). Soroush Abolfathi (University of Warwick) called the study careful but warned that size cut-offs and mass-to-number conversions can shift results by orders of magnitude20. Richard Lampitt (National Oceanography Centre) argued that the compiled techniques differ too much to compare and that model inputs often come from chains of other models20. Isidro Pérez (University of Valladolid) cited measurements spread over years of changing emissions, sparse sites and an outlier-sensitive correlation coefficient21.
The Tichý preprint is a testable alternative, not a midpoint: fitted to remote deposition data, it estimates about 1 Mt a year for 5–250 µm3. On 3 November 2026 it was under review for Atmospheric Chemistry and Physics, with public discussion open until 11 November (level P)3.
By our comparison, Brahney's extrapolation puts more than 1,000 t a year onto western US protected lands1, twice the scaled model's 500 t a year for all land emissions worldwide2. It is not like for like. Land deposition also receives plastic from the sea and particles lifted again after settling, and the size windows differ (counts from about 4 µm converted to mass, against 5–100 µm). This is a diagnostic to explain, not a refutation of either study.
Estimate
Every global emission figure on this page is a model estimate, not a measurement. The published values span more than three orders of magnitude, from about 9.6 Tg a year10 to 0.0045 Tg a year2, and each covers a different size range. The named air presets behind this site's home counters are explained on Flows & Model.
People in industrialized countries spend about 90% of their time indoors5. Small studies report more plastic indoors than outdoors. In the Paris area, Dris and colleagues counted 1.0–60.0 fibers/m³ in two apartments and an office, against 0.3–1.5 fibers/m³ outdoors; about a third of the indoor fibers were petrochemical (level C)22.
Smaller particles change the scale. Nadiia Yakovenko and colleagues sampled three apartments and two cars in southern France, identifying particles of 1–10 µm by Raman spectroscopy (level C)5. Median concentrations were 528 particles/m³ in homes and 2,238 in car cabins; 94% of particles were smaller than 10 µm5. Combining these with published data, they estimate that an adult inhales about 68,000 particles of 1–10 µm a day indoors, 100 times earlier estimates extrapolated from larger sizes (estimate, level C)5.
By mass, the Leipzig study estimated an inhaled dose of about 2.1 µg of airborne plastic a day for someone breathing that roadside air (estimate, level C)7. The WHO concluded in 2022 that inhalation exposure data were too limited for a human risk assessment23. What inhaled particles do in the body is covered on Human Body; filtration indoors is covered on Solutions by System.
For nanoplastics below 1 µm, the airborne record is close to empty. We found no peer-reviewed, size-resolved number concentrations of nanoplastics below 1 µm in outdoor air (level E). Search scope: this site's registry, Crossref and web search, papers from 2019–2026 on "airborne nanoplastics", "atmospheric nanoplastics" and "TD-PTR-MS air", November 2026. The models in the 2026 comparison stop at 5 µm, and the compiled measurements start at several micrometers2.
The nanoplastic evidence comes from snow and ice. Dušan Materić and colleagues used thermal desorption proton transfer reaction mass spectrometry (TD-PTR-MS) to find PET nanoplastics in Alpine snow (level C)24.
At the Sonnblick Observatory, 3,106 m up in the Austrian Alps, surface snow in 2017 held on average 46.5 ng/mL, implying deposition of about 42 kg per km² a year (level C)15. Greenland firn averaged 13.2 ng/mL and Antarctic sea ice 52.3 ng/mL, with tire wear nanoparticles identified in Greenland (level C)13. The sea-ice value does not show whether the particles arrived by air or from seawater.
These are masses, not counts or sizes. The Leipzig study reports a fine fraction by mass, not resolved below 1 µm7. Sub-micrometer estimates in the indoor study are extrapolations from a size distribution, not measurements5.
 Illustration
Measured vs modeled microplastic concentrations in air, global medians
| label | value | unit | kind | scope |
|---|---|---|---|---|
| Over land, measured median | 0.08 | particles/m³ | measurement | 2014–2024, coastal sites excluded |
| Over land, model (TD-B inventory) | 105 | particles/m³ | model estimate | lowest of three inventories over land; TD-B is the Brahney et al. 2021 top-down estimate |
| Over land, model (TD-E inventory) | 1506 | particles/m³ | model estimate | highest of three inventories over land; TD-E is the Evangeliou et al. 2022 top-down estimate |
| Over ocean, measured median | 0.003 | particles/m³ | measurement | 2014–2024, open ocean |
| Over ocean, model (lowest inventory) | 0.2 | particles/m³ | model estimate | range across three inventories |
| Over ocean, model (highest inventory) | 13.9 | particles/m³ | model estimate | range across three inventories |
Global microplastic emissions into the air: published estimates
| label | value | unit | size_range | basis | source |
|---|---|---|---|---|---|
| Evangeliou et al. 2022, top-down inversion | 9.6 | Tg/yr | microplastics up to 250 µm | total of all sources; western US deposition data, global extrapolation; ocean 8.9 ± 3.5 of the 9.6 ± 3.6; microfibers (6.5 ± 2.9 Tg/yr) estimated separately and not included | S-199 |
| Brahney et al. 2021, ocean source only | 8.6 | Tg/yr | model bins 0.3–70 µm; observations 4–250 µm | ocean term only, 95% range 0–22, not a total; western US deposition data, global extrapolation; roads (0.096) and agricultural dust (0.069) add about 2% | S-050 |
| Tichý et al. 2026, preprint | 1 | Tg/yr | 5–250 µm | remote deposition data, Bayesian inversion; not peer reviewed; under review for Atmospheric Chemistry and Physics on 3 November 2026 | S-198 |
| Fu et al. 2023, GEOS-Chem | 0.32 | Tg/yr | 0.3–70 µm | second-hand: as reported in Evangelou et al. 2026; the primary paper was not checked by this site | S-052 |
| Evangelou et al. 2026, scaled | 0.0045 | Tg/yr | 5–100 µm | 2,782 measurements, two global scaling factors; 90% confidence interval 0.0006–0.0089 | S-052 |
Airborne plastic indoors and outdoors: what each study counted
| label | value | unit | statistic | size_range | place | source | low |
|---|---|---|---|---|---|---|---|
| Outdoor air over land, global median | 0.08 | particles/m³ | median | several µm and larger | 283 locations worldwide, 2014–2024 | S-052 | |
| Outdoor air, Paris area (all fibers) | 1.5 | fibers/m³ | range; value is the high end | fibers, natural and synthetic | one outdoor site, published 2017 | S-203 | 0.3 |
| Indoor air, Paris area (all fibers) | 60 | fibers/m³ | range; value is the high end | fibers; about one-third petrochemical | two apartments and one office | S-203 | 1 |
| Homes, median | 528 | particles/m³ | median | 1–10 µm, Raman | three apartments, Toulouse, seven samples | S-063 | |
| Car cabins, median | 2238 | particles/m³ | median | 1–10 µm, Raman | two cars, southern France, five samples | S-063 |
Three published inventories, run through a transport model, gave airborne concentrations 100 to 10,000 times higher than the medians of 2,782 measurements. Scaling land emissions down to about one-thousandth made modeled and measured mean concentrations over land match; ocean emissions were then scaled up 3.6 times (level C,2).
One study found microplastics in snow at all 19 sites sampled on Ross Island in late 2019, about 29 particles per liter of meltwater at 50 µm and above. Back-trajectories allow transport of up to 6,000 km, but nearby research stations are a possible local source (level C,18). Nanoplastics in Antarctic sea ice (13) do not show whether they arrived by air or from seawater.
What happens to plastic once it lands at sea is on Oceans. The instruments and their size limits are explained on How We Measure It, and open questions on Knowledge Gaps.
Editorial categories of this site. A–E grade scientific findings, per claim, with a one-line rationale; D and E are not lower rungs of the A–C scale. P is not a grade: it marks facts checked against their primary record.
CORRECTIONS IN PUBLIC
How to report an error on this site, what we do with your report, and how corrections are recorded in a public, dated log. No corrections have been recorded yet. The log follows the practice of scientific journals: a change stays visible, with its date and its reason.
Our rule is to correct errors in public. When a number, a citation or a grade on this site turns out to be wrong, we fix the page and log the change with its date and reason. We do not quietly overwrite text. Science corrects itself the same way: the 2019 estimate by Cox and colleagues of microplastic intake through food, drink and air1 carries a formal correction notice, published by its journal on 17 August 20202.
Report anything on the site that a source, or a check of our own reasoning, shows is wrong or out of date:
A disagreement with a grade counts as a report when it points to evidence or to the step where we applied the rubric wrongly. A preference without either is welcome, but it will not change a grade.
Write to {{CONTACT_EMAIL}}. What we do with your address and message is explained in our Privacy statement.
A report we can act on quickly has three parts:
Tell us if you are an author of the cited work or have another connection to it. That does not disqualify a report; it helps us read it fairly. Say whether you would like to be credited by name in the log.
How your address and message are stored, for how long, and who reads them is set out in the Privacy statement; the retention period and the hosting provider are still marked there as owner decisions.
What you can do
Include the evidence. A report with a DOI, an official link or a worked check of our arithmetic can be tested against the record; a report without one usually cannot.
Our categories follow the practice of scientific publishing. Guidance from the Committee on Publication Ethics (COPE) tells editors to consider retraction when there is clear evidence that findings are unreliable, through misconduct or honest error. It says a correction may be best when only a small part of an otherwise reliable article is flawed3,4.
The International Committee of Medical Journal Editors (ICMJE) asks journals to post a new version that lists the dates and details of the changes, and to archive earlier versions5. We apply the same categories to web pages. A public archive of earlier page versions is planned; until it exists, each log entry keeps the old text.
Every change that alters a fact, a number, a source or a grade gets one log entry. Typos and layout fixes do not. Each entry has six fields:
A retracted passage stays in its log entry with the old text, so readers who cited it can see what happened.
No corrections recorded yet. Entries will be listed here, newest first, from the site's first public release.
Example, not a real correction. The values below are invented to show the format.
| Field | Example value |
|---|---|
| date | EXAMPLE: 1 January 2027 |
| record | EXAMPLE: Human Body, section "What is found" |
| version | EXAMPLE: 1.1 |
| old URL | EXAMPLE: /human/v1-0 |
| what and why | EXAMPLE: A blood concentration was given without its size limit. Added the size limit stated in the cited study. Reported by a reader, with the study's methods section. |
| type | EXAMPLE: addition |
For general questions about the site, write to {{CONTACT_EMAIL}}. Image owners who want to check or change a credit can use the same address; credits and licenses are listed on Picture Credits. Researchers who would like to review a page or contribute data are welcome to write. Our editorial process is described on How We Work, and our source rules on Methods & Sources.
This site reports research. It is not a clinic, a laboratory or a law office.
If you ask to be credited, the log entry names you as the reporter. If you prefer not to be named, it says "reported by a reader".
Reports reach us privately by email, and the site has no public comment section. What becomes public is the outcome: when a report shows an error, the log entry records what changed and why. A page is changed because a source or a check shows it is wrong, never to remove criticism.
Yes. Send the evidence and say which part of the rubric on Evidence levels you think applies. A grade changes when the evidence changes or when we applied the rubric wrongly to the evidence already cited, and the change is logged with its reason.
We reply with the reason. You can send further evidence at any time, and we will check it again.
Editorial categories of this site. A–E grade scientific findings, per claim, with a one-line rationale; D and E are not lower rungs of the A–C scale. P is not a grade: it marks facts checked against their primary record.
BELOW ONE MICROMETER
A nanoplastic is a plastic particle smaller than 1 µm, although some agencies put the line at 100 nm and the EU microplastics restriction sets no lower size limit. This page explains where the size lines are drawn, how nanoplastics form and why smaller particles behave more like colloids than like litter.
A nanoplastic is a piece of plastic smaller than 1 µm, one thousandth of a millimeter. This site draws the line there, following two definition papers; some agencies use 100 nm. Nothing switches on at 1 µm1. As particles shrink, gravity matters less, molecular jostling more, and the molecules they collect steer them. Cut one 1 mm cube of plastic into 100 nm cubes and you get a trillion pieces with 10,000 times the surface (our calculation, below).
1 µm
upper size limit of nanoplastics used on this site
1 nm to <1,000 nm; proposed by Gigault et al. 2018 and Hartmann et al. 20192,3
a convention, not a natural boundary; graded P because it is a definition checked against the two papers
PProvenance100 nm
upper limit in the EU nanomaterial definition (any material) and in EFSA's 2016 nanoplastic range
Commission Recommendation of 10 June 2022: at least 50% of a material's particles by number with one or more external dimensions of 1–100 nm, plus further conditions; EFSA 2016 statement on food4,5
legal and agency texts, read in the original; the EU test classifies a material, not a single particle
PProvenance0.1 µm
temporary enforcement floor of the EU microplastics restriction, which itself has no lower size limit
REACH Annex XVII entry 78 (Regulation (EU) 2023/2055); 0.3 µm for fiber-like particles; applies until methods can quantify smaller particles6,7
stated in the Commission's explanatory guide, version 1.1
PProvenanceEstimate
Our calculation: a cube 1 mm on each side has a surface of 6 mm². Cut it into cubes 100 nm on each side and you get 10,000 × 10,000 × 10,000 = one trillion pieces. Each has a surface of 0.00000006 mm², so together they expose 60,000 mm², which is 10,000 times more. Mass and volume do not change. For polystyrene (about 1.05 g/cm³) the cube weighs about 1 mg.
The word "microplastics" took hold after 2004, when Richard Thompson and colleagues reported microscopic plastic fragments and fibers in marine sediments and plankton, without defining the term8,3. Twenty years later they call it the first publication to use the term (level P)9.
The upper bound came from a NOAA workshop in September 2008, whose participants "defined microplastics as plastic particles smaller than 5mm" and required no lower bound. They kept visible particles in the class on purpose, because research was at an early stage (level P)10.
No physical law fixes these lines. Hartmann and colleagues call the 5 mm limit only "somewhat biologically informed" and name classes after metric units3. This site combines two conventions: nanoplastics from 1 nm to below 1,000 nm, as in Gigault et al. and Hartmann et al., and microplastics from 1 µm to 5 mm, keeping the NOAA bound (level P)2,3,10.
Definitions also differ on which dimension counts. Hartmann and colleagues propose the largest one and, for fibers, ask each study to state its choice3. The EU nanomaterial test needs one external dimension in range. REACH entry 78 needs all dimensions at 5 mm or less, or a fiber-like length of 15 mm or less (level P)4,6. This site reports the dimension a cited study used.
| Who | Nanoplastic | Microplastic | Other classes | Note |
|---|---|---|---|---|
| This site | 1 nm to <1 µm | 1 µm–5 mm | none | nano limit from Gigault and Hartmann; 5 mm from NOAA |
| NOAA workshop, 200810 | not defined | below 5 mm | none | no lower bound required |
| EFSA, 20165 | about 1–100 nm | 0.1–5,000 µm | none | food safety statement |
| Gigault et al., 20182 | 1–1,000 nm | not defined | none | unintentionally produced, colloidal behavior |
| Hartmann et al., 20193 | 1 to <1,000 nm | 1 to <1,000 µm | mesoplastics 1 to <10 mm; macroplastics ≥ 1 cm | optional split at 100 nm; largest dimension counts |
| ISO 24187:202311 | no class | 1–1,000 µm | large microplastics 1–5 mm | taken from ISO/TR 21960:2020, modified |
| EU nanomaterial definition, 2022, simplified4 | 1–100 nm in at least one external dimension (any material) | not covered | none | a test of a material's number-based size distribution; see the note below the table |
| EU REACH entry 78, 20236 | no lower size limit | all dimensions ≤ 5 mm; fiber-like ≤ 15 mm long | none | "synthetic polymer microparticles": size alone does not decide scope |
The EU nanomaterial row is a summary. The full definition counts particles on their own and as identifiable parts of aggregates or agglomerates. It also covers elongated particles (two dimensions below 1 nm, one above 100 nm) and plate-like ones (one below 1 nm, two above 100 nm). A material with a volume-specific surface area below 6 m²/cm³ is excluded (level P)4.
REACH entry 78 is narrower in substance and wider in size. Its "synthetic polymer microparticles" are solid polymers that make up at least 1% of a particle's weight or coat it; natural unmodified, degradable, soluble and carbon-free polymers are excluded. The sales ban has derogations and transition periods and does not cover particles formed unintentionally, such as packaging fragments (level P)6. Details are on Policy & regulation.
Entry 78 sets no lower size limit, so it can reach particles a few nanometers across. Its 0.1 µm floor (0.3 µm for fiber-like particles) is temporary and for enforcement only, until methods can quantify smaller particles (level P)6. And a 500 nm particle is a nanoplastic here, a microplastic for EFSA, and below every named class in ISO 24187 (level P)11,5.
Where nanoplastics sit on the size scale
| label | value | unit | value_max | kind | source |
|---|---|---|---|---|---|
| typical soluble protein | 3 | nm | 6 | reference | S-222 |
| bacteriophage virus | 70 | nm | reference | S-222 | |
| EU nanomaterial upper limit; EFSA nanoplastic upper limit | 100 | nm | threshold-alternative | S-213, S-009 | |
| REACH temporary enforcement floor (fiber-like 300 nm) | 100 | nm | threshold-regulatory | S-214 | |
| this site: nano below, micro above | 1000 | nm | threshold-site | S-005, S-004 | |
| E. coli bacterium (width to length) | 1000 | nm | 2000 | reference | S-222 |
| red blood cell diameter | 7000 | nm | 8000 | reference | S-222 |
| smallest sand grain | 62500 | nm | reference | S-223 | |
| human hair, average diameter | 70000 | nm | reference | S-231 | |
| plankton net mesh used for floating microplastics | 333000 | nm | reference | S-212 | |
| ISO 24187: microplastic ends, large microplastic begins | 1000000 | nm | threshold-iso | S-003 | |
| largest sand grain | 2000000 | nm | reference | S-223 | |
| upper limit of microplastics (NOAA 2008, this site, REACH) | 5000000 | nm | threshold-site | S-212, S-214 | |
| Hartmann et al.: mesoplastics end, macroplastics begin | 10000000 | nm | threshold-alternative | S-005 |
Shape labels vary. Hartmann and colleagues list spheres, beads, pellets, foams, fibers, fragments, films and flakes, noting that the first three are often synonyms. They prefer "irregular particles" to "fragments", because some cosmetic abrasives are made irregular (level P)3. On this site "fragment" means only an irregular piece broken off a larger item.
Common polymers include polypropylene (PP), polyethylene (PE), polyvinyl chloride (PVC), polystyrene (PS), polyethylene terephthalate (PET) and polyurethane (PU)15; polyamide (PA, nylon) appears in the teabag example below16. Density decides first whether a particle floats: PP and PE are lighter than water, solid PS, PVC and PET heavier (level B)17.
Tire wear particles are a borderline case. Tires usually contain 40–60% synthetic polymers, and some polymer chemists do not count rubber as plastic; Hartmann and colleagues propose including them3. Kole and colleagues compile emission estimates averaging 0.81 kg per person per year worldwide (estimate, level C)18. This site states whether a cited study counts them.
Common plastics by density, compared with water
Polymer ranges from the review table of Wu et al. 2020. Water densities are our calculation with the TEOS-10 equation of state (GSW toolbox): pure water 0.998 g/cm³ at 20 °C; seawater of absolute salinity 35 g/kg at the sea surface 1.025 g/cm³ at 20 °C, 1.023 at 25 °C and 1.028 at 0 °C.
| label | value | unit | value_max | source | kind | value_min |
|---|---|---|---|---|---|---|
| polypropylene (PP) | 0.9 | g/cm³ | 0.91 | S-221 | ||
| polyethylene (PE) | 0.92 | g/cm³ | 0.97 | S-221 | ||
| pure water at 20 °C (reference line) | 0.998 | g/cm³ | S-225 | reference | ||
| seawater at the surface, salinity 35 g/kg: 20 °C (reference line), range from 25 °C to 0 °C | 1.025 | g/cm³ | 1.028 | S-225 | reference | 1.023 |
| polystyrene (PS), solid | 1.04 | g/cm³ | 1.1 | S-221 | ||
| polyvinyl chloride (PVC) | 1.16 | g/cm³ | 1.58 | S-221 | ||
| polyethylene terephthalate (PET) | 1.37 | g/cm³ | 1.45 | S-221 |
Primary particles are made at their final size, such as pre-production pellets and microbeads; secondary particles form from larger items by fragmentation or wear and tear3. Primary nanoplastics exist too, such as the 0.2 µm polystyrene beads used as model particles20. Gigault and colleagues reserve the word for unintentionally produced particles, which by our reading excludes such beads2.
Sunlight drives much of the breakdown. Lambert and Wagner kept pieces of a polystyrene coffee-cup lid in water under visible and UV light at 30 °C. After 56 days the water held about 126 million particles per milliliter, average size 224 nm, against 41 million in controls (level C)21. Their counting method does not identify the polymer.
Not all the mass lost stays particulate. Pfohl and colleagues aged cryo-milled polyamide and polyurethane powders under UV light. Dissolved organic compounds, which are molecules rather than particles, made up a major share of the mass lost, alongside fragments down to 10 nm (level C)22.
Heat can also shed particles, but the best-known example is disputed (level D). Hernandez and colleagues steeped plastic teabags at 95 °C and reported about 11.6 billion "microplastics" and 3.1 billion "nanoplastics" per cup. They matched the dried residue to nylon and PET by spectroscopy16. Their nano line was 100 nm, and only about 2.3 million particles exceeded 1 µm; by this site's convention nearly all would be nanoplastics, if they are plastic23.
Busse and colleagues, including a scientist of Germany's Federal Institute for Risk Assessment (BfR), argue that drying the extract let dissolved oligomers precipitate and be counted as particles24,23. Identifying single particles by Raman spectroscopy, they found 5,800–20,400 plastic particles above 1 µm per bag, apparently washed off its surface rather than shed by brewing23.
Hernandez and colleagues reply that their submicrometer counts come from nanoparticle tracking analysis of the liquid, without drying, and that the two studies used methods that cannot be compared25. BfR's 2025 assessment holds that the reply does not answer the main criticism23. What this means for everyday choices is on What you can do.
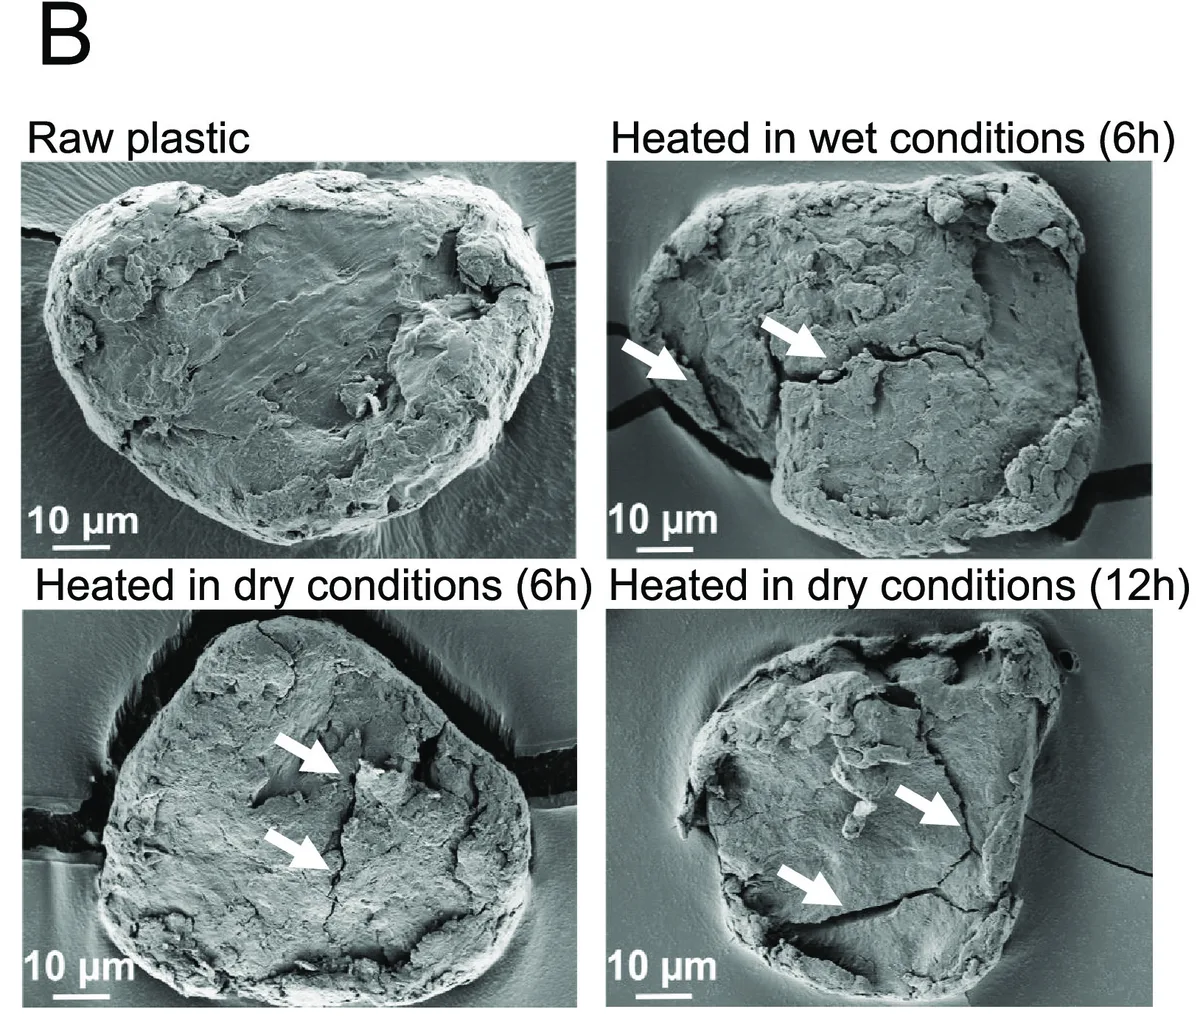
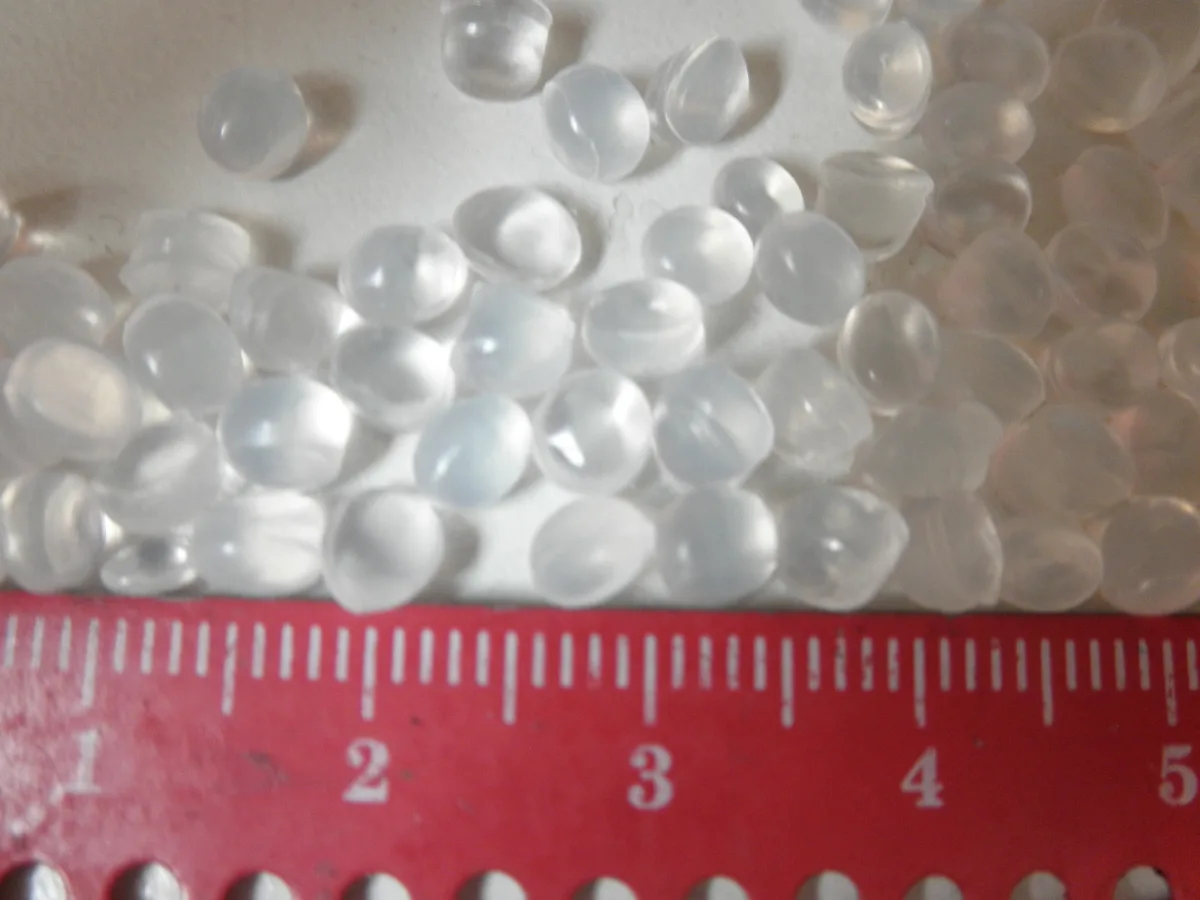
Small particles have more surface for their mass. For a sphere or a cube, surface divided by volume equals six divided by the diameter or edge, so it rises tenfold for each tenfold drop in size. Mitrano and colleagues expect no stepwise change at the nanoscale. Surface processes such as pollutant adsorption may still matter more as a given mass is cut smaller1.
Gravity loses its grip gradually. In still water at 20 °C, an isolated polystyrene sphere 10 µm across sinks about 10 mm per hour and one of 1 µm about 0.1 mm per hour. One of 100 nm needs about 110 years per meter. Across solid polystyrene densities that is 57 to 139 years (our calculation, see the method note, level P).
Collisions with water molecules, called Brownian motion, also move particles. Their spread grows with the square root of time, settling in proportion to it. In one hour the 1 µm sphere sinks about 100 µm and wanders about 56 µm along one axis. The 100 nm sphere sinks about 1 µm and wanders about 180 µm (our calculation, level P). Gigault and colleagues make colloidal behavior part of their definition2.
Real particles rarely stay single, so even particles far below 1 µm can leave suspension. Nanoplastics clump with each other (homoaggregation) or with natural particles (heteroaggregation), and the clumps can settle or stick to soil and sediment grains (level B)27. Inside a heteroaggregate, a nanoplastic goes where the larger clump goes1.
In water, natural organic matter and microbial secretions coat nanoplastics in an "eco-corona" that changes their surface and fate (level B)28. In biological fluids proteins form a similar corona; Monopoli and colleagues argue, from engineered nanoparticles, that this coat is what cells meet (level B)29.
Size also affects which barriers a particle passes in laboratory systems. Li and colleagues grew wheat and lettuce in hydroponic and sand culture with fluorescent polystyrene beads. Beads of 0.2 µm entered roots through cracks where lateral roots emerge and reached the shoots; 2 µm beads took that route more slowly (level C)20.
Nanoplastic particles have not yet been extensively measured in the environment, so Mitrano and colleagues compare them with engineered nanomaterials and natural colloids to anticipate their fate1. The human body is covered on Human body.
Same mass, smaller pieces: number and total surface of one 1 mm cube
Our calculation: number = (1 mm / edge)³; total surface = number × 6 × edge². Ideal cubes, no mass lost to dissolution. The cited source supports why surface area matters (adsorption); the numbers are arithmetic, not data.
| label | value | unit | surface_mm2 |
|---|---|---|---|
| 1 mm | 1 | pieces | 6 |
| 100 µm | 1000 | pieces | 60 |
| 10 µm | 1000000 | pieces | 600 |
| 1 µm | 1000000000 | pieces | 6000 |
| 100 nm | 1000000000000 | pieces | 60000 |
| 10 nm | 1000000000000000 | pieces | 600000 |
Method
How we computed the settling and Brownian numbers: Stokes' law for one smooth polystyrene sphere (1.05 g/cm³; 1.04–1.10 g/cm³ for the range) in still pure water at 20 °C, density 0.998 g/cm³ (TEOS-10) and viscosity 1.002 mPa·s (IAPWS formulation)19,30. Settling speed is about 2.8 µm/s at 10 µm, 28 nm/s at 1 µm and 0.28 nm/s at 100 nm. Brownian spread is the one-dimensional root-mean-square displacement from the Stokes–Einstein equation, √(2Dt): at 100 nm about 2.9 µm after 1 second and 180 µm after 1 hour. Real particles aggregate, gain coatings and meet currents, so these are idealized estimates, not measurements.
A particle carries chemicals as well as polymer: plasticizers, flame retardants, antioxidants, stabilizers, pigments and fillers15. Plasticizers typically make up 10–70% of a plastic's weight where used, about 80% go into PVC, and phthalates are among the most common (level B)15. EFSA states that microplastics "can contain on average 4%" additives (level C)5. The PlastChem report lists 16,325 known plastic chemicals and flags more than 4,200 as of concern (level P)31.
Particles also sorb pollutants. One study summarized by Hahladakis and colleagues found polychlorinated biphenyls (PCBs) on polypropylene pieces from the sea at 100,000 to 1 million times the surrounding water's concentration (level C)15. Whether a particle harms an organism and whether its chemicals do are separate questions; Human body keeps them apart.
No. "Nanoparticle" covers any particle in the nanometer range, including soot, metal oxides and engineered silver particles. A nanoplastic is made of plastic polymer. The EU nanomaterial definition applies to any material and classifies a sample by its particle size distribution, so a nanoplastic sample may or may not meet it. (level P,4,1)
No. An isolated 100 nm polystyrene sphere settles extremely slowly in still water (our calculation), but real nanoplastics aggregate with each other and with natural particles, and the clumps can settle or attach to sediment and soil grains. Water chemistry and surface coatings affect how quickly this happens. (level B,27,28,1)
How fast nanoplastics break down outside the laboratory has not been measured in the sources reviewed here. Under UV light in one lab study, polyamide and polyurethane powders lost a major share of their mass as dissolved organic compounds, besides fragments down to 10 nm. Rates in soil or deep water remain open. (level C,22)
How scientists find and count particles this small, and why their size limits shape every number, is on How we measure it. The From planet to cell sequence shows the same scale ladder as an animation, and Four microworlds shows particles in air, water, soil and tissue. Laws that use these definitions are on Policy & regulation.
Editorial categories of this site. A–E grade scientific findings, per claim, with a one-line rationale; D and E are not lower rungs of the A–C scale. P is not a grade: it marks facts checked against their primary record.
DECEMBER 2026 TO DECEMBER 2027
Twelve meetings with confirmed dates where micro- and nanoplastics are a named topic, from the AGU meeting in December 2026 to MICROPLASTIC days in Ljubljana, ending 1 October 2027. Each entry gives dates, place, the organizer's page and the next deadline, last checked on 3 November 2026.
Twelve meetings between December 2026 and December 2027 have confirmed dates and name micro- or nanoplastics in their program, call or scope; for the treaty meeting, that is the negotiation's mandate. One is a treaty meeting open to government delegations only, ten are scientific conferences and one is a laboratory course. The formal treaty session INC-5.4 has only a planning window and is listed under unconfirmed.
The calendar starts early: the first abstract deadline, for SETAC Europe in Geneva, is 10 November 2026, one week after this list was checked1. Five of the twelve close abstracts between 10 November 2026 and 25 January 2027 (our count from the organizers' pages).
The window runs from 1 December 2026 to 31 December 2027. An event is listed only if micro- or nanoplastics appear by name in its program, its call for abstracts or its published scope, and only if its dates appear on a page run by the organizer. Aggregator listings do not count. Every date was last checked on 3 November 2026.
Dates and places are provenance facts, not scientific findings, so they carry no A–E grade. Where it matters, an entry says how we read it: on the organizer's page, in an archived copy, or in the organizer's document read through a text reader because the site refuses automated requests (UNEP, AGU, ACS). A planning window without dates is never shown as a date range.
Method
Deadlines move. Treat each one as the organizer's published date on 3 November 2026 and confirm it on the linked page before you submit or book. Where no deadline was published, the entry says "none announced".
The treaty talks are listed because the UN resolution that launched them recognizes "that plastic pollution includes microplastics"2. The one treaty meeting with confirmed dates in the window is the third informal in-person meeting of heads of delegation, 28–30 January 2027 at the United Nations Office at Nairobi. Regional meetings precede it on 25–27 January, according to UNEP's invitation of 16 October 20263,4.
Only government delegations take part, each with a head of delegation and up to five delegates; registration closes on 8 January 20273. The Busan session (INC-5.1, 2024) adjourned with a Chair's Text as the starting point for further talks5, and the Geneva session (INC-5.2, August 2025) was adjourned because no consensus was reached6. Background is on the policy page.
–
Nairobi, Kenya (United Nations Office at Nairobi)
Deadline: 2027-01-08, 23:59 East Africa Time (delegate registration)
Ten conferences qualify. Four are large general meetings (AGU, ACS, EGU, SETAC Europe) where plastics appear as sessions or named track topics; six are smaller meetings where plastics are the main theme or a named theme.
At EGU27 in Vienna, nine sessions carry "plastic" in their title, among them AS3.15 on atmospheric micro- and nanoplastics, SSS7.1 on plastics in soils and OS4.13 on marine and estuarine plastic (our count across 23 program groups, 3 November 2026)7. EGU also accepts online participation8.
At ACS Spring 2027 in New Orleans, the Division of Analytical Chemistry runs a contributed symposium on micro- and nanoplastics in the environment; its abstract call closed on 28 September 2026, before this list was checked9,10.
The AGU26 meeting in San Francisco runs 7–11 December 202611,12. Session EP023, on the multiscale fate of nano-, micro- and macroplastics in aquatic environments, is announced in its conveners' call on AGU's community site; its abstracts closed on 5 August 2026, and we did not inspect the final program13.
SETAC Europe names microplastics in the descriptions of two of its seven tracks, and its published session gallery includes session 1.05 on micro- and nanoplastics (in the part we could load on 3 November 2026)14,15. The venue is Palexpo, near Geneva airport16. FILTCON27 has "Microplastics in Filtration and Nonwovens" as its featured theme, with abstracts due 25 November 202617. The Nebraska summit takes abstracts until 25 January 202718.
ICCE 2027 in Gdańsk lists "Emerging Pollutants & Microplastics" in its scope and takes abstracts until 15 February 202719,20. The ECI conference in Davos is devoted to engineered solutions for micro- and nanoplastics in water; oral abstracts close on 15 January 2027 and posters on 25 January21,22. MICROM 2027 in Novi Sad had not opened abstract submission23. MICROPLASTIC days returns to Ljubljana in autumn 2027 without a published deadline24.
–
San Francisco, USA (Moscone Center); recordings on demand
Deadline: abstracts closed 2026-08-05; conference hotel booking closes 2026-11-19
–
New Orleans, USA
Deadline: abstracts closed 2026-09-28, before this list was checked; none further announced
–
Vienna, Austria (Austria Center Vienna) and online
Deadline: 2027-01-12, 13:00 CET (abstracts)
–
Novi Sad, Serbia
Deadline: none announced (abstract submission not yet open)
–
Raleigh, North Carolina, USA
Deadline: 2026-11-25 (abstracts)
–
Geneva, Switzerland (Palexpo)
Deadline: 2026-11-10 (abstracts; year inferred, the page gives day and month only)
–
Lincoln, Nebraska, USA
Deadline: 2027-01-25 (abstracts); early-bird registration through February 2027
–
Gdańsk, Poland
Deadline: 2027-02-15 (abstracts)
–
Davos, Switzerland
Deadline: 2027-01-15 (oral abstracts); 2027-01-25 (poster abstracts)
–
Ljubljana, Slovenia
Deadline: none announced
Micro- and nanoplastics events, December 2026 to December 2027
| label | value | unit | end | deadline | deadline_abstracts | source | deadline_registration | deadline_oral | deadline_poster |
|---|---|---|---|---|---|---|---|---|---|
| AGU26, San Francisco | 2026-12-07 | 2026-12-11 | abstracts closed 2026-08-05 | 2026-08-05 | S-238, S-248 | ||||
| INC heads of delegation, Nairobi | 2027-01-28 | 2027-01-30 | registration 2027-01-08 (delegations only) | S-249 | 2027-01-08 | ||||
| Birmingham MNP workshop | 2027-02-01 | 2027-02-05 | none announced | S-237 | |||||
| ACS Spring 2027, New Orleans | 2027-03-21 | 2027-03-25 | abstracts closed 2026-09-28 | 2026-09-28 | S-232, S-233 | ||||
| EGU27, Vienna and online | 2027-04-04 | 2027-04-09 | abstracts 2027-01-12 | 2027-01-12 | S-158, S-234 | ||||
| MICROM 2027, Novi Sad | 2027-04-08 | 2027-04-09 | none announced | S-235 | |||||
| FILTCON27, Raleigh | 2027-04-20 | 2027-04-22 | abstracts 2026-11-25 | 2026-11-25 | S-236 | ||||
| SETAC Europe, Geneva | 2027-04-25 | 2027-04-29 | abstracts 2026-11-10 | 2026-11-10 | S-152 | ||||
| MNP Summit, Lincoln | 2027-05-09 | 2027-05-12 | abstracts 2027-01-25 | 2027-01-25 | S-155 | ||||
| ICCE 2027, Gdańsk | 2027-06-06 | 2027-06-10 | abstracts 2027-02-15 | 2027-02-15 | S-239 | ||||
| ECI MNP in Water, Davos | 2027-07-04 | 2027-07-08 | oral abstracts 2027-01-15; poster abstracts 2027-01-25 | S-154, S-240 | 2027-01-15 | 2027-01-25 | |||
| MICROPLASTIC days, Ljubljana | 2027-09-28 | 2027-10-01 | none announced | S-243 |
Only one course in the window met the criteria, short of the two to four we aimed for. The University of Birmingham runs a five-day, hands-on short course on identifying and characterizing environmental micro- and nanoplastics, at a fee of £880; registration details were "coming soon"25.
We found no webinar with a published date in the window on the ECHA events page; the NOAA Marine Debris Program events address returned "page not found" and the JRC events page blocked our check (3 November 2026). New announcements will appear on This Week.
–
Birmingham, United Kingdom
Deadline: none announced (registration opening soon)

INC-5.4, the resumed fifth treaty session, is scheduled "within the period of 13 to 24 March 2027". UNEP says its duration is still to be confirmed and that the specific dates and venue will follow in a formal invitation26,6. It stays out of the calendar until UNEP confirms the dates.
SETAC North America meets in Long Beach on 1–4 November 2027, but its page did not yet mention plastics27. The 2027 meetings of the Basel, Rotterdam and Stockholm conventions (Panama City, 19–30 April 2027) discuss plastic waste, not micro- or nanoplastics by name28.
Next edition not announced: MICRO, whose 2026 edition was in Cádiz29; the University of New Mexico conference on microplastics and human health30. The Kristineberg early-career workshop moved to November 202831. A 2027 Geneva Summer School on microplastics appears only in third-party listings; the University of Geneva page blocked our check. Meetings listed only by conference aggregators were left out. For the studies these meetings build on, see Landmark Studies.
Event card: dates, place, type and next deadline, generated from the event list.
Editorial categories of this site. A–E grade scientific findings, per claim, with a one-line rationale; D and E are not lower rungs of the A–C scale. P is not a grade: it marks facts checked against their primary record.
SETTLED, LIKELY, DISPUTED, UNKNOWN
The site's headline findings on micro- and nanoplastics, sorted by evidence level from A (consensus) to E (unknown). Each finding carries one grade, a one-line reason, its system and its sources, so a reader can see quickly how much of the subject is solid ground.
 Illustration
This page lists 30 headline findings about micro- and nanoplastics, each with a single grade. The grade belongs to the finding, not to a study or topic: one paper can feed findings at several levels. The two best-known estimates of how much microplastic an adult swallows each week, 0.1–5 g and about 4.1 µg, differ by a factor of between 24,000 and 1.2 million (our calculation)1,2. They are not like-for-like: they use different particle-size windows and model inputs (see D).
Legend: A consensus · B well supported · C limited · D disputed · E unknown. The full rubric, with worked examples, is on Evidence Levels. Snapshot: 3 November 2026.
30 findings on the evidence ladder, 3 November 2026
| label | value | unit |
|---|---|---|
| A consensus | 5 | findings |
| B well supported | 6 | findings |
| C limited | 10 | findings |
| D disputed | 4 | findings |
| E unknown | 5 | findings |
Each finding below rests on several independent studies plus a statement by a scientific or intergovernmental body.
Several independent studies agree; no scientific body has yet issued a statement, or the studies cover limited settings.
One study, or a few, under narrow conditions or with method caveats. These findings may move up or down.
Studies or analyses conflict. Both sides are listed with their sources. For the brain, a 2026 study of surgical and post-mortem samples using several methods also detects plastic; it supports presence but does not settle the amounts55.
We found no reliable evidence for the exact proposition. "Not established" means not established in the evidence we reviewed, not proof of absence. Each item names its search; the strings and screened counts are in the search record below, and detail is on Knowledge Gaps.
Method
Search record for the E findings. PubMed, searched 3 November 2026, publication years 2020–2026; all titles screened, candidate abstracts read; plus this site's registry. Strings: E1 nanoplastic*[tiab] AND soil*[tiab] AND (field[tiab] OR agricultural[tiab] OR farmland[tiab] OR cropland[tiab]) AND (pyrolysis[tiab] OR "Py-GC"[tiab] OR quantif*[tiab] OR "mass concentration*"[tiab]); E2 nanoplastic*[tiab] AND (cohort[tiab] OR longitudinal[tiab] OR prospective[tiab] OR "follow-up"[tiab]) AND (patients[tiab] OR participants[tiab] OR humans[mh]); E3 nanoplastic*[tiab] AND ("tap water"[tiab] OR "drinking water"[tiab]) AND (count*[tiab] OR "number concentration*"[tiab] OR "particle number*"[tiab] OR "particles per"[tiab]); E4 (microplastic*[tiab] OR nanoplastic*[tiab]) AND (cloud*[tiab] OR "ice nucleat*"[tiab] OR "condensation nuclei"[tiab]); E5 nanoplastic*[tiab] AND (remov*[tiab] OR remediat*[tiab] OR clean-up[tiab] OR cleanup[tiab]) AND ("field scale"[tiab] OR "field-scale"[tiab] OR "in situ"[tiab] OR "full-scale"[tiab] OR "open water"[tiab] OR "outdoor air"[tiab] OR "field trial"[tiab]). Limits: one database, title and abstract terms only.
Findings by system and evidence level, 3 November 2026
| label | value | unit | A | B | C | D | E |
|---|---|---|---|---|---|---|---|
| air | 7 | 1 | 1 | 2 | 1 | 2 | |
| water | 9 | 2 | 2 | 3 | 0 | 2 | |
| soil | 10 | 1 | 4 | 3 | 0 | 2 | |
| human body | 8 | 1 | 1 | 2 | 3 | 1 |
Method
How grades change. A grade moves when the evidence does: a new independent study, a body statement, a correction, a retraction or a published critique. A writer proposes the change, a verifier checks the sources, a reviewer challenges it, and the editor decides and dates it. Every grade here is dated 3 November 2026 and re-reviewed at the next snapshot, or sooner if a listed source is corrected, retracted or answered in print. A public record of grade changes is planned; none is recorded yet. Report a wrong grade through Corrections & Contact.
The rubric behind these letters is on Evidence Levels. Findings grouped by air, water, soil and the body are on Evidence by System. The studies behind several of them are on Landmark Studies, and the disputed tissue measurements are set in context on Human Body.
Editorial categories of this site. A–E grade scientific findings, per claim, with a one-line rationale; D and E are not lower rungs of the A–C scale. P is not a grade: it marks facts checked against their primary record.
STRONGEST RECENT EVIDENCE BY SYSTEM
Twenty recent studies on micro- and nanoplastics in air, water, soil and the human body, each graded A to E for its key finding. Detection is well documented, amounts are often disputed, and effects in people are not established.
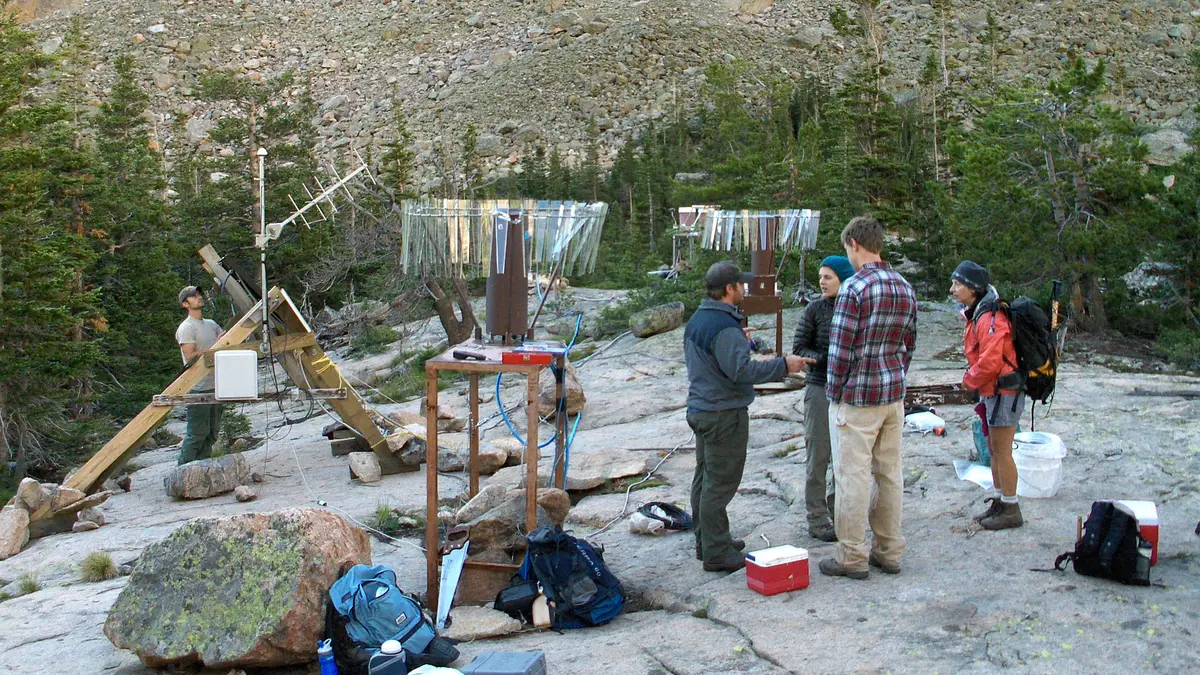
In every system, the strongest recent evidence is about presence: plastic turns up in air, clouds, lakes, tap water, farm soils and human tissue. Evidence on amounts is weaker, and evidence of harm to people is limited to associations and animal studies. Even the measurements are in question. In 2026 a Michigan team reported that dry contact with ordinary lab gloves left a mean of about 2,000 false "microplastic" signals per square millimeter (level C)1.
This page is a ledger, not a narrative. Each card is one study on occurrence, exposure or effects: what was measured, where, sample size, main number and main limitation. We gave priority to peer-reviewed papers from 2023 to 2026 that state their method and size range. Better-known work, such as the 2022 blood study, sits on Landmark studies. Studies of filters, treatment and other fixes are on Solutions by system.
The selection is targeted, not a systematic review, drawn from the site's registry and PubMed and Crossref searches. "Strongest" means the best documented method and scope among the studies we read. The blood-method, glove and confidence-framework papers are carded here; Landmark studies links to them.
Each card's level is for its key finding, not the whole study. A single well-run study usually earns C; a finding confirmed by several independent groups earns B; a finding contradicted in print earns D, and the card shows both sides. The rubric is on Evidence levels, and the same findings sorted by level are on Evidence by status. Open questions are collected on Knowledge gaps.
Snapshot: 4 November 2026. Literature searched up to 3 November 2026.
The findings on this page by system and evidence level
| label | value | unit | system | level |
|---|---|---|---|---|
| Air · C | 5 | findings | air | C |
| Water · C | 4 | findings | water | C |
| Soil · C | 3 | findings | soil | C |
| Soil · D | 1 | findings | soil | D |
| Soil · E | 1 | findings | soil | E |
| Human · C | 6 | findings | human | C |
| Human · D | 1 | findings | human | D |
Air has gained the most new data since 2023. Indoor studies identify particles down to about 1 µm, and polymer-specific mass methods reach city air. In the two European cities below, tire wear is the largest single share of airborne plastic mass. How much plastic the world emits into the air is disputed; the 2026 comparison of emission models with measurements is covered on Atmosphere and Landmark studies21. The last card is a warning about the measurements.
Two 2026 model studies revise the direct climate effect of airborne plastic from small (2021) to a slight warming of about +0.04 W/m², with one model including nanoplastics22,23,24,25. Both are conditional model estimates that depend on assumed concentrations, colors and sizes, not observed climate effects; they are graded on Evidence by status.
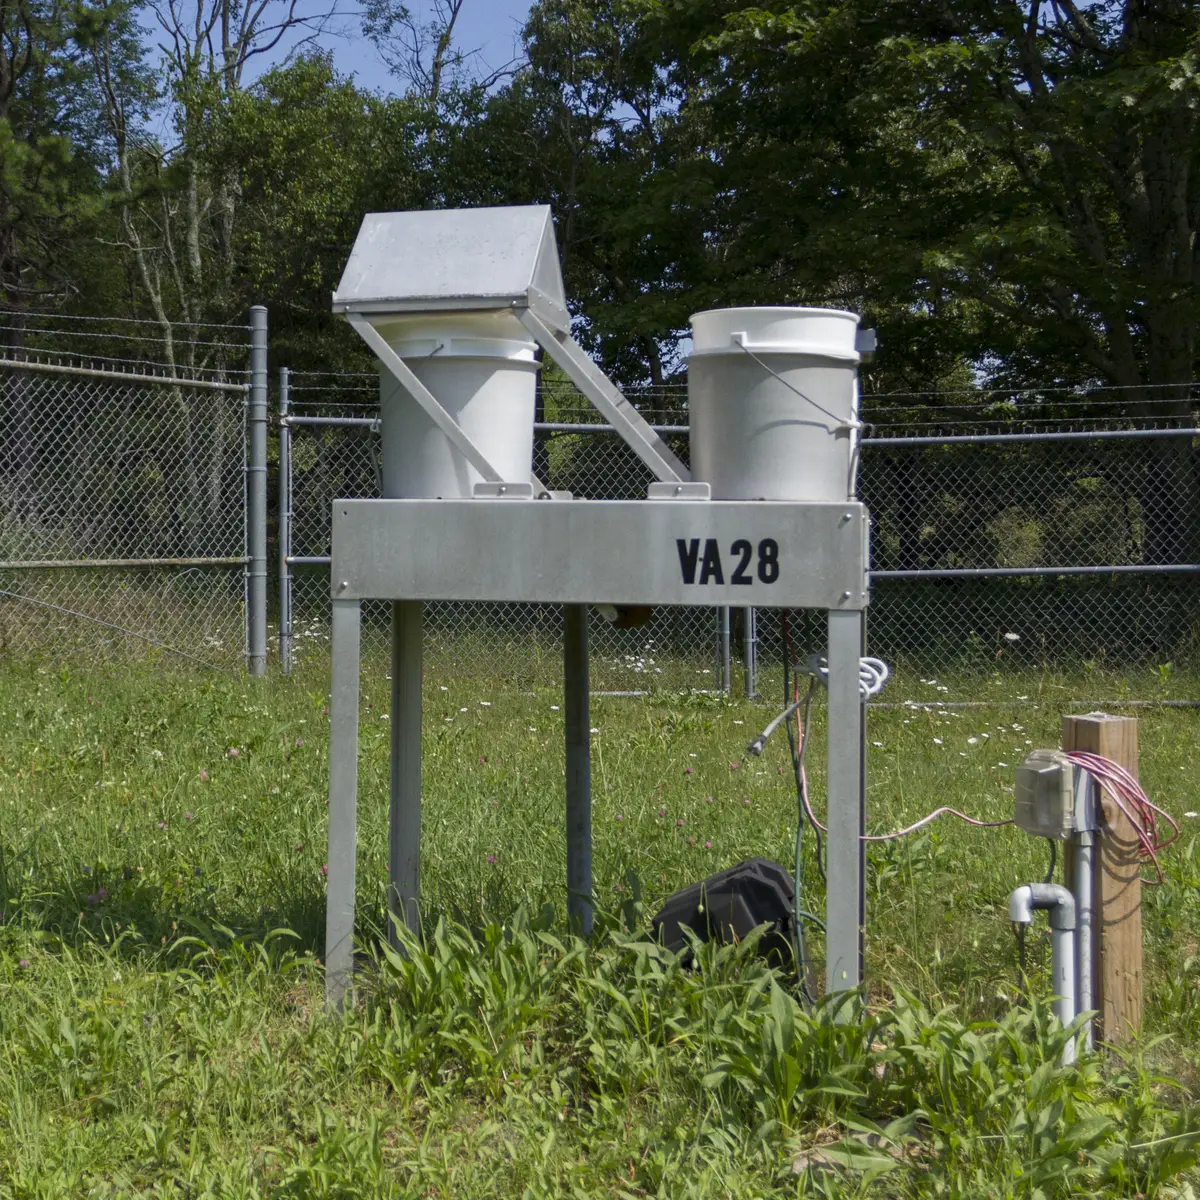
Homes and car cabins, Toulouse (Yakovenko et al., 2025). The team sampled indoor air in three apartments and two cars from January to May 2023 (12 samples) and identified particles by Raman spectroscopy down to about 1 µm. Median concentrations were 528 particles/m³ in homes and 2,238 particles/m³ in cars, and 94% of particles were 1–10 µm, small enough to reach the deep lung. With published data, the authors estimate that an adult inhales about 68,000 such particles a day, an estimate, not a measurement. Limitation: only 0.3% of each filter was analyzed and scaled up, and the home–car difference was not statistically significant.
Read the study ↗Size-fractionated roadside air, Leipzig (Kaushik et al., 2025). Particulate matter below 10 µm was sampled at one busy roadside site for two weeks in September 2022 and analyzed by pyrolysis gas chromatography–mass spectrometry (py-GC/MS), which reports polymer mass rather than particle counts. Plastic averaged 0.6 ± 0.2 µg/m³, split evenly between fine and coarse fractions. Tire wear particles made up about 65% of it. The polyvinyl chloride (PVC) signal cannot be told apart from soot. Limitation: one site, which the authors treat as an upper-limit exposure; their mortality risk figures apply general fine-particulate coefficients to plastic and are model estimates, not observed outcomes.
Read the study ↗Oslo and remote Norway (Herzke et al., 2026). Suspended and deposited airborne microplastics were sampled in parallel at urban and remote Norwegian sites and analyzed polymer by polymer with py-GC/MS. Microplastics appeared in nearly all samples. In Oslo, tire wear particles made up more than 90% of airborne microplastic mass and peaked when drivers switched to winter tires. In short episodes they reached up to 30% of fine particulate matter (PM2.5). Remote sites showed lower but steady levels, which the authors attribute to long-range transport from European source regions. Limitation: one country, and attribution at remote sites depends on transport modeling.
Read the study ↗Cloud water above Japan (Wang et al., 2023). Researchers collected cloud water at three mountain sites between about 1,300 and 3,776 m altitude, including the summit of Mount Fuji, and identified particles by infrared imaging and micro-FTIR spectroscopy. They found nine polymer types at mean concentrations of 6.7 to 13.9 pieces per liter, with sizes from 7.1 to 94.6 µm. Many particles carried water-attracting groups, which the authors propose could help seed droplets or ice. It shows plastic traveling inside clouds. Limitation: the size floor near 7 µm misses nanoplastics, and the cloud-seeding role is a hypothesis, not a measurement.
Read the study ↗Gloves as a source of false positives (Clough et al., 2026). While measuring airborne microplastics in Michigan, the team traced spurious counts to stearate salts on disposable gloves. Their infrared and Raman spectra resemble those of microplastics, so library matching misidentifies them. Dry contact with ordinary nitrile and latex gloves left a mean of about 2,000 false positives per square millimeter; a nitrile cleanroom glove left about 100. The errors concentrate below 10 µm. Limitation: how many earlier datasets are affected is not established; the authors give workflows and stearate spectra to separate the two.
Read the study ↗Water has the longest record. The ocean studies below are model estimates built on field samples, with different size classes and methods, so their totals should not be added or compared. Both are far below the 30 million metric tons (30 Mt) on the home water card. That OECD (2022) model estimate counts all plastic in the sea, not only floating or buoyant pieces26,7. Lakes and drinking water add direct measurements; context is on Oceans.
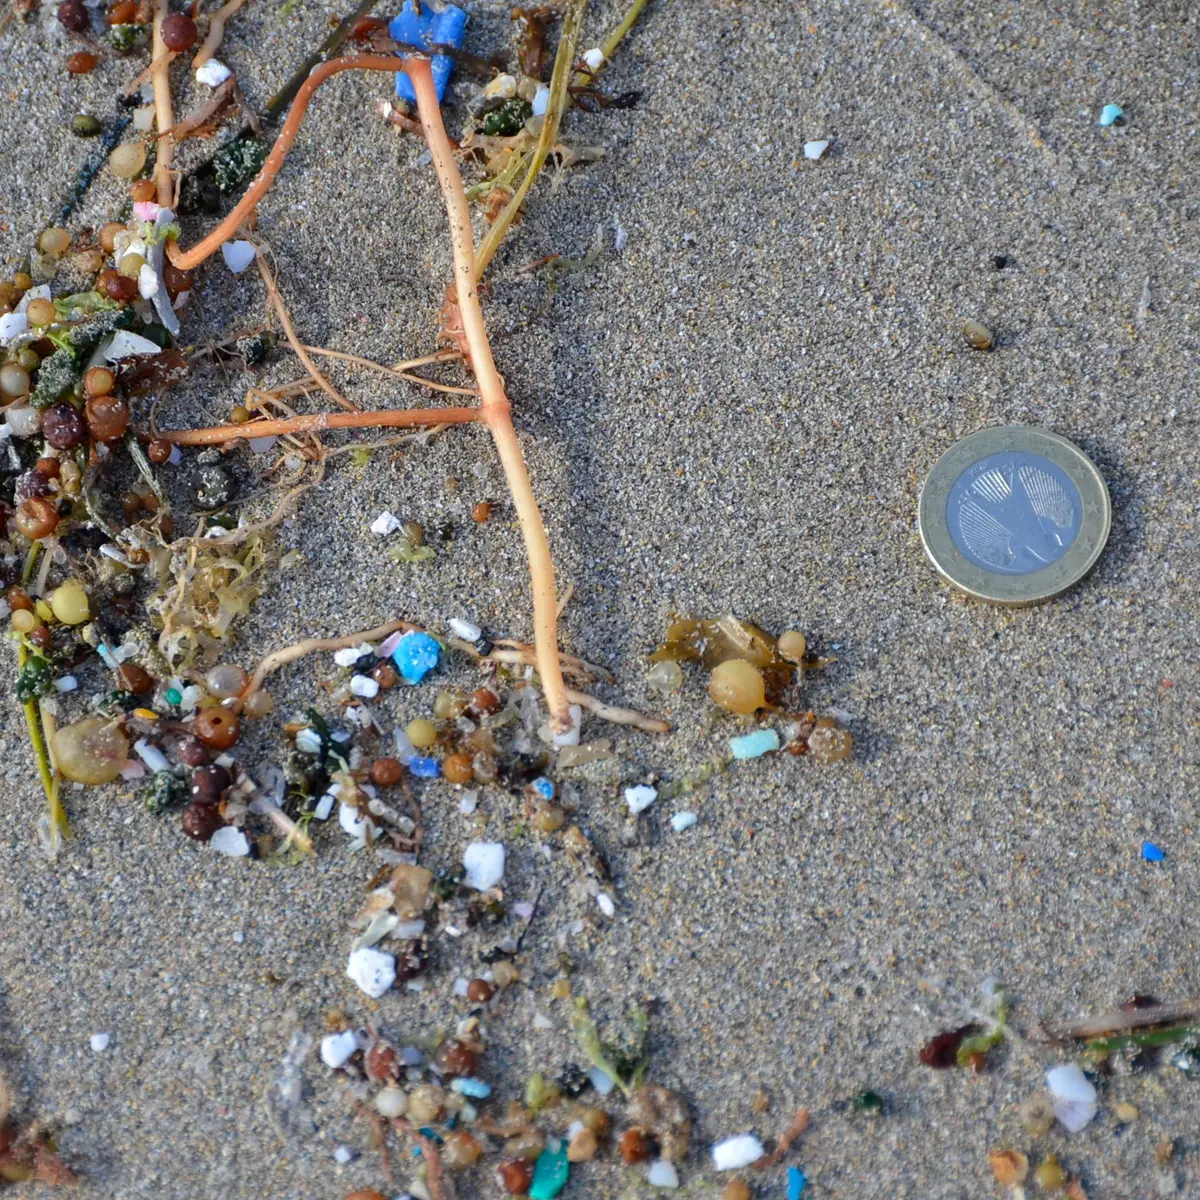
Floating plastic in the world's oceans, 1979–2019 (Eriksen et al., 2023). The team combined published and new surface-net data from 11,777 stations into a global time series. For 2019 they estimate 82 to 358 trillion floating plastic particles weighing 1.1 to 4.9 million metric tons. They find no clear trend before 1990, a fluctuating plateau until 2005 and a rapid rise since. Limitation: one modeled analysis of pooled data, not yet independently replicated; stations are unevenly spread, and surface nets miss the smallest particles.
Read the study ↗Where buoyant ocean plastic sits (Kaandorp et al., 2023). A three-dimensional mass-budget model assimilated observations from coastlines, the ocean surface and the deep ocean for pieces from 0.1 to 1,600 mm. It estimates 3,200 thousand metric tons (kt) of initially buoyant plastic in the ocean in 2020, more than 95% of it (3,100 kt) in pieces larger than 25 mm. Input is about 500 kt a year. On these numbers there is no "missing" ocean plastic. Limitation: a model estimate covering only initially buoyant plastic; nanoplastics are not resolved.
Read the study ↗Lakes and reservoirs in a standardized survey (Nava et al., 2023). A cross-national team sampled surface water in 38 lakes and reservoirs for plastic debris larger than 250 µm, using one protocol everywhere. Every water body contained plastic. The most affected were lakes in densely populated, urbanized areas and large lakes with long water-retention times; in the most polluted, concentrations reached or exceeded those reported in subtropical ocean gyres. Limitation: one consortium study; surface water only, and the 250 µm floor excludes small microplastics and all nanoplastics.
Read the study ↗Nanoplastic mass in Australian drinking water (Shi et al., 2026). The team screened tap and bottled water by py-GC/MS, separated particles by size with field-flow fractionation, and checked results with particle tracking and electron microscopy. Average concentrations were 0.3 to 0.7 µg/L for nanoplastics (10–1,000 nm) and 0.5 to 1.5 µg/L for selected microplastics, higher in tap than in bottled water. It combines several independent methods; two of its authors also wrote the blood method study below. Limitation: the polypropylene identification in the nano fraction is called indicative, and tap-water particle counts (one to ten million per milliliter) are not polymer-specific.
Read the study ↗Soil has the least direct evidence. Field inventories count microplastics from about 20 µm. For nanoplastics we found one field quantification: polystyrene at one compost-amended French site, 2.57 µg/g in the 200–1,000 nm topsoil fraction, about 28 times a reference plot (level C)11. At a second such field, an isotope estimate covers only the mobile fraction in soil water, about 0.25 µg/kg down to 55 cm (level C)27.
A representative, validated nanoplastic mass across polymers and farm soils is not established in the evidence we reviewed (level E); the search is recorded on Evidence by status. Laboratory studies report crop uptake at tested doses, and a crop-loss estimate is disputed. Context: Soil.
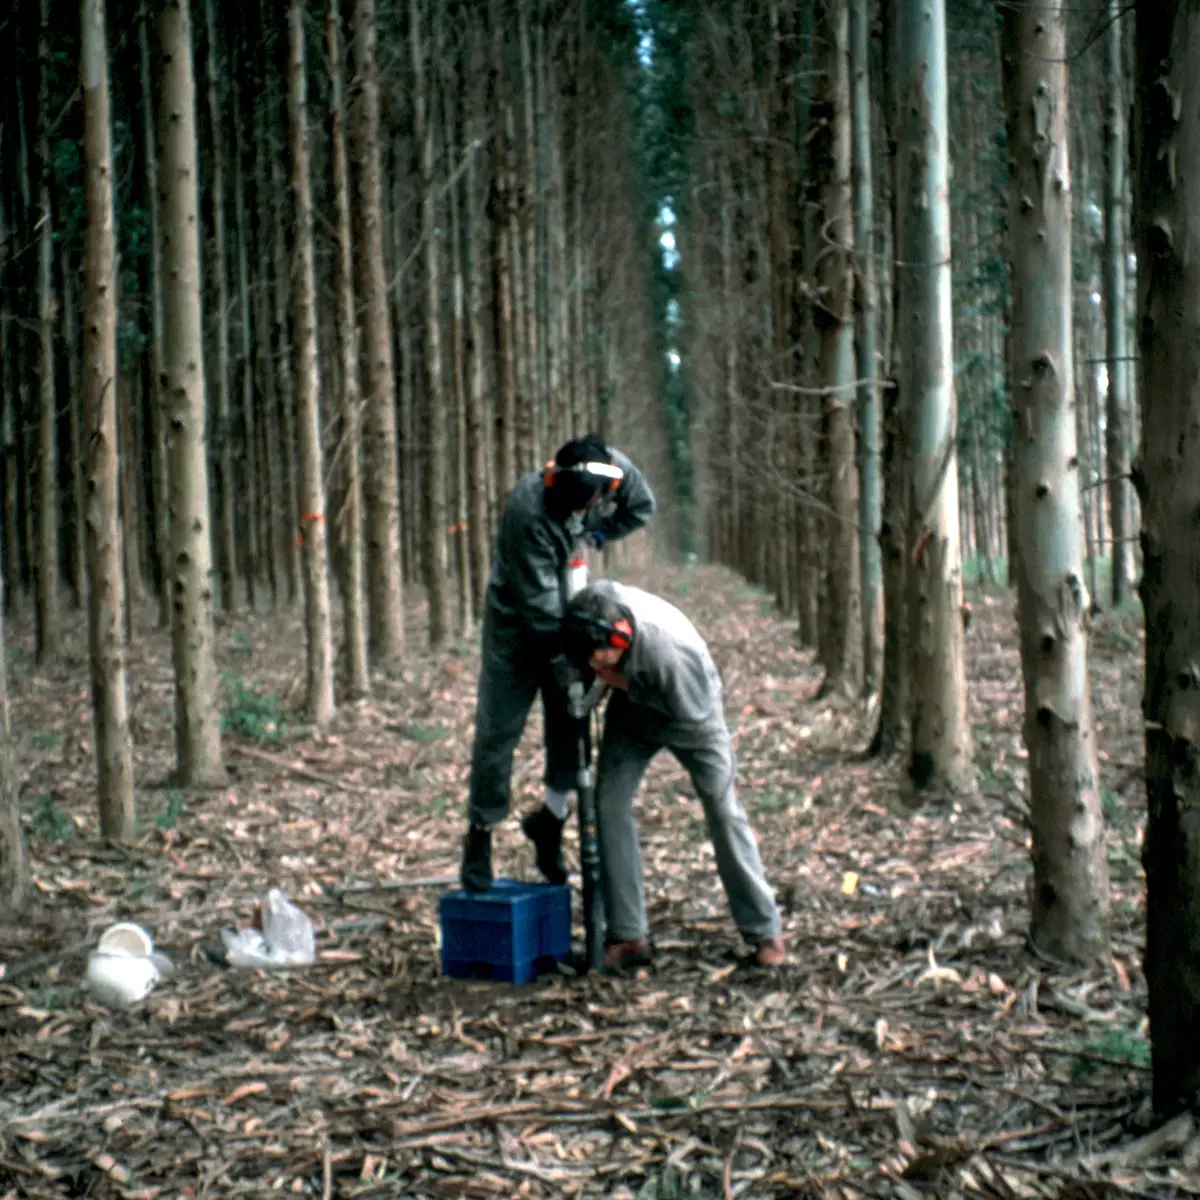
Thirty years of plastic mulch in Xinjiang cotton fields (Zhang et al., 2025). The team sampled 60 field points with 5 to 30 years of mulching history at three depths down to 30 cm. Microplastics of 20–500 µm were extracted by density separation and confirmed by infrared spectroscopy. After 30 years, residual film totaled about 281 kg/ha in the top 30 cm, and the top 10 cm held about 10,000 to 10,800 microplastic fragments per kilogram (the paper gives both values). Accumulation sped up once residual film passed about 160–200 kg/ha. Limitation: one arid region, different fields standing in for different ages, and particles below 20 µm excluded.
Read the study ↗Nanoplastics in a compost-amended field, Loire valley, France (Ryzhenko et al., 2026). The field received large amounts of household-waste compost in the 1990s. Soil cores to 90 cm from an amended and a reference plot were composited per plot; the 200–1,000 nm fraction was isolated by filtration and polystyrene (PS) measured by matrix-matched py-GC/MS. Topsoil (0–5 cm) held 2.57 µg/g dry weight, about 28 times the reference plot (0.09 µg/g). Grass roots held 123 µg/g, not size-selected; shoot values were below the quantification limit. Limitation: one site, one polymer, one composite sample per plot; recovery and blank data sit in a supplement we did not read.
Read the study ↗Nanoplastics from roots to pollen (Piovesan et al., 2026). Pumpkin plants were exposed to radiolabeled polystyrene (PS) nanoplastics of about 20 nm at 1 µg/L, near expected environmental levels, and at 1 mg/L, a worst case. The label moved from roots to flowers and concentrated in the anthers; a radiolabel tracks the carbon, not necessarily intact particles. The authors report lower pollen viability, abnormal pollen shape and hydration, and reduced photosystem efficiency in leaves. Limitation: one crop, laboratory conditions, uniform PS spheres; we read the abstract only, which does not say which effects occurred at the lower dose.
Read the study ↗A global estimate of photosynthesis and crop losses (Zhu et al., 2025). A meta-analysis of 3,286 data points reports that microplastic exposure lowers photosynthesis by 7.05 to 12.12% across land plants and marine and freshwater algae. A model then estimates annual losses of 4.11 to 13.52% of main crop production, or about 110 to 361 Mt. The crop figure is disputed. Two experts quoted by the UK Science Media Centre call it speculative, since slower photosynthesis may delay growth without lowering final yield; a third sees the study as added evidence for action28. Limitation: an extrapolation from exposure experiments to field conditions worldwide.
Read the study ↗Human evidence has grown fastest and is the most contested: many groups report plastic in tissues, but the amounts are disputed. In blood, a method study found that tissue compounds produce false polyethylene and PVC signals in py-GC/MS and suppress the signal for polyethylene terephthalate (PET); each organ matrix needs its own test19. Contamination during sampling is hard to rule out29. Associations with disease are not causes. Landmark tissue studies are on Landmark studies; context is on Human body.
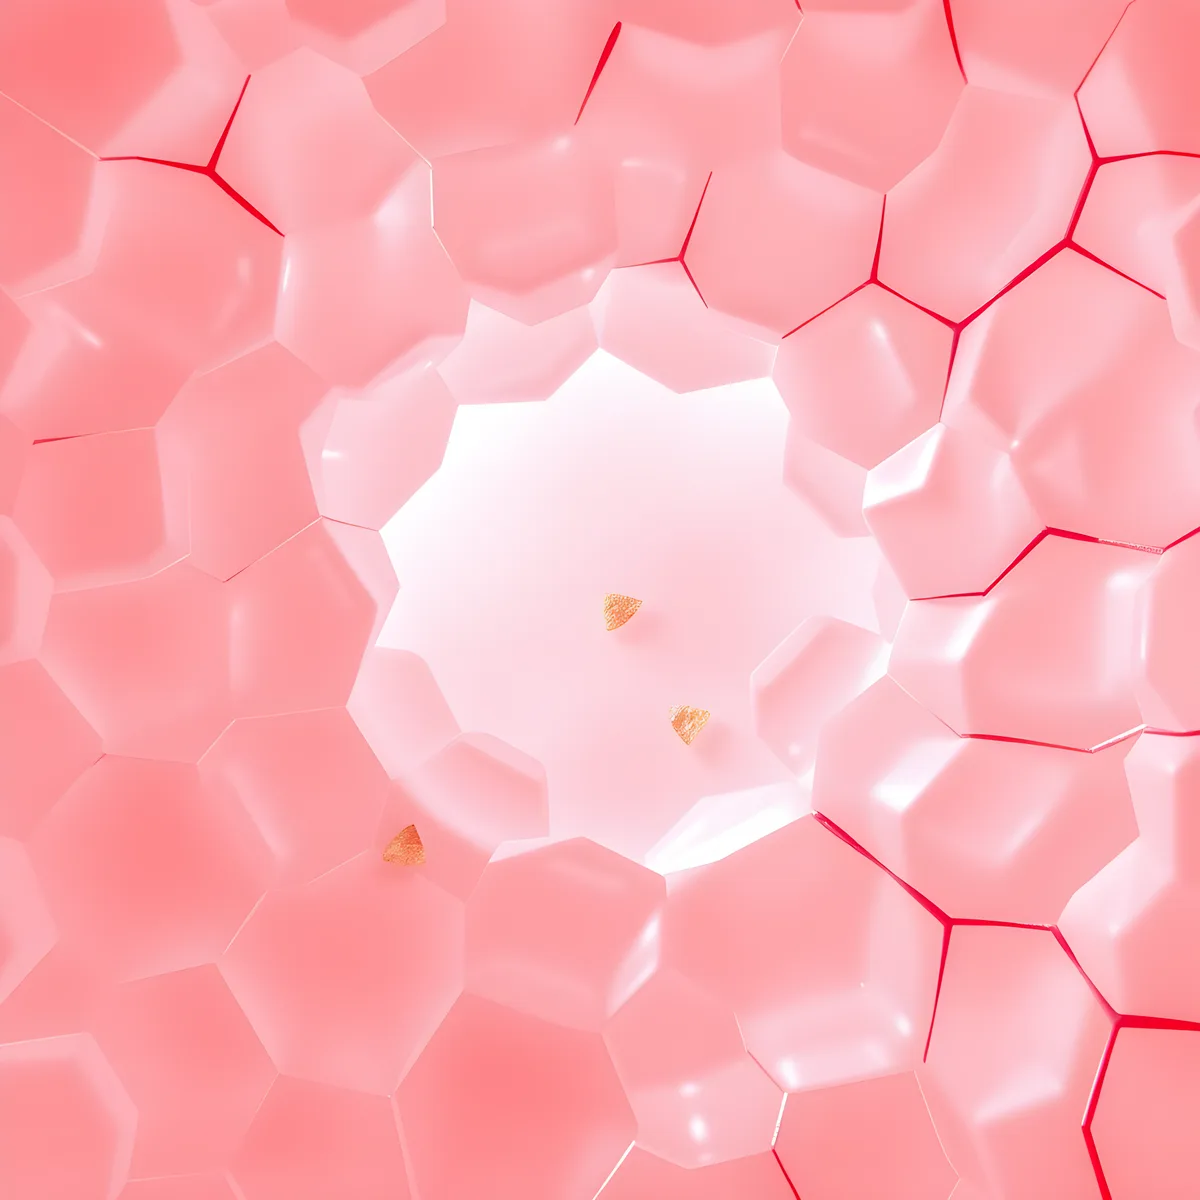 Illustration
Placenta mass by py-GC/MS (Garcia et al., 2024). The team digested 62 placentas, isolated solids by ultracentrifugation and quantified 12 polymers by py-GC/MS. Every sample contained plastic, from 6.5 to 685 µg per gram of tissue (mean 126.8 µg/g), and polyethylene was 54% of the total. Fluorescence microscopy showed particles and fibers above 1 µm but no nano-sized particles. The amount is disputed: critics of the same laboratory's brain workflow cite fat interference and missing validation29, and in blood py-GC/MS gave false polyethylene signals19; the placenta itself was not retested. Limitation: no independent confirmation of the amounts.
Read the study ↗Olfactory bulb, São Paulo (Amato-Lourenço et al., 2024). Olfactory bulbs from 15 deceased adults who had lived in São Paulo for more than five years were examined by micro-FTIR spectroscopy. Microplastics were found in 8 of the 15: 16 particles and fibers in total, 44% of them polypropylene (PP), with particles 5.5 to 26.4 µm across. Procedural blanks contained no polymers. The olfactory bulb is a possible route into the brain that bypasses the blood–brain barrier. Limitation: 16 particles from 15 people, none reported below 5 µm, and the route itself was not shown.
Read the study ↗Urine of 10-year-olds, Ma'anshan Birth Cohort, China (Liu et al., 2026). Urine from 1,308 children was screened by laser direct infrared imaging, whose detection floor is 20 µm. Microplastics were detected in 91% of samples at a median of 250 particles/mL; 98% of detected particles were 20–100 µm, and polytetrafluoroethylene (PTFE) appeared in half of the samples. Diet quality was associated with the abundance of some polymer types. Limitation: we read the abstract only, so collection and blank controls are unchecked. Particles this large exceed what healthy kidneys filter, and so high a count makes contamination a question to settle first (our note).
Read the study ↗Brain tumors and healthy brains, China (Li et al., 2026). The team analyzed 156 samples from 113 patients having brain-tumor surgery and 35 samples from eight regions of five post-mortem donors. Particles were counted by laser direct infrared imaging, a subset of samples went to py-GC/MS, and single particles were confirmed by optical photothermal infrared spectroscopy. Surgical air, syringes, infusion sets and other items were tested as contamination sources. Plastic was detected in 99.4% of patient samples and all donor samples. In 23 samples from the five donors, the py-GC/MS median was 50.3 µg/g, a value we take from the publisher's source-data file, about one hundredth of the Nihart 2024 median (our comparison)30. Limitation: samples are not independent people, and the design cannot show cause; a correction fixed figure rounding only31.
Read the study ↗What the health studies add up to (Chartres et al., 2024). A rapid systematic review using the Navigation Guide method searched four databases in July 2022 and April 2024. It included 3 human observational studies and 28 animal studies on digestive, reproductive and respiratory outcomes. The authors conclude that microplastics are "suspected" to harm these three systems, rating some bodies of evidence high quality, and call birth outcomes "unclassifiable". Limitation: the human evidence rests on three observational studies; most findings come from animals at the tested doses.
Read the study ↗Testing the main mass method in blood (Rauert et al., 2025). The team developed and validated a py-GC/MS extraction for human blood, then ran a pilot with eight Australian adults sampled fasting and after a meal. Recoveries ranged from 7 to 109%, and realistic detection limits were up to 20 times higher than limits measured in clean water. Polyethylene signals from the blood itself were reduced but not removed, and no other polymer exceeded detection limits. The authors judge py-GC/MS currently unsuitable for polyethylene and PVC in biological matrices, and for PET in blood because of matrix suppression. Limitation: blood only, one laboratory.
Read the study ↗Confidence levels for plastics in human samples (Thomas et al., 2026). This framework paper ranks analytical techniques by how specifically they identify plastic and sets minimum data from independent, orthogonal techniques for each confidence level. It asks for transparent reporting of contamination controls and uncertainty before amounts in human tissue inform health decisions. An independent critique of the brain measurements raises the same concern29; the blood method study shares two authors with this paper19. Limitation: a proposal, not a validated or adopted standard.
Read the study ↗We review this page at each snapshot. A study enters when it is peer-reviewed, states its method and size range, and adds something the existing cards do not. A card leaves when a stronger study replaces it, when it is retracted, or when it moves to the landmarks page. A correction triggers a dated re-check: the card is kept, revised or regraded. A public change log is planned; none is recorded yet. Report errors through Corrections & Contact.
Editorial categories of this site. A–E grade scientific findings, per claim, with a one-line rationale; D and E are not lower rungs of the A–C scale. P is not a grade: it marks facts checked against their primary record.
HOW THE LIVE COUNTERS WORK
The home-page counters multiply a chosen yearly flow of plastic by elapsed time, and each flow in model v7 is a value from one named study. This page lists every study behind the counters, the v6 values removed on 3 November 2026 with the reason, and the disputed estimates side by side. The counters are estimates, not measurements.
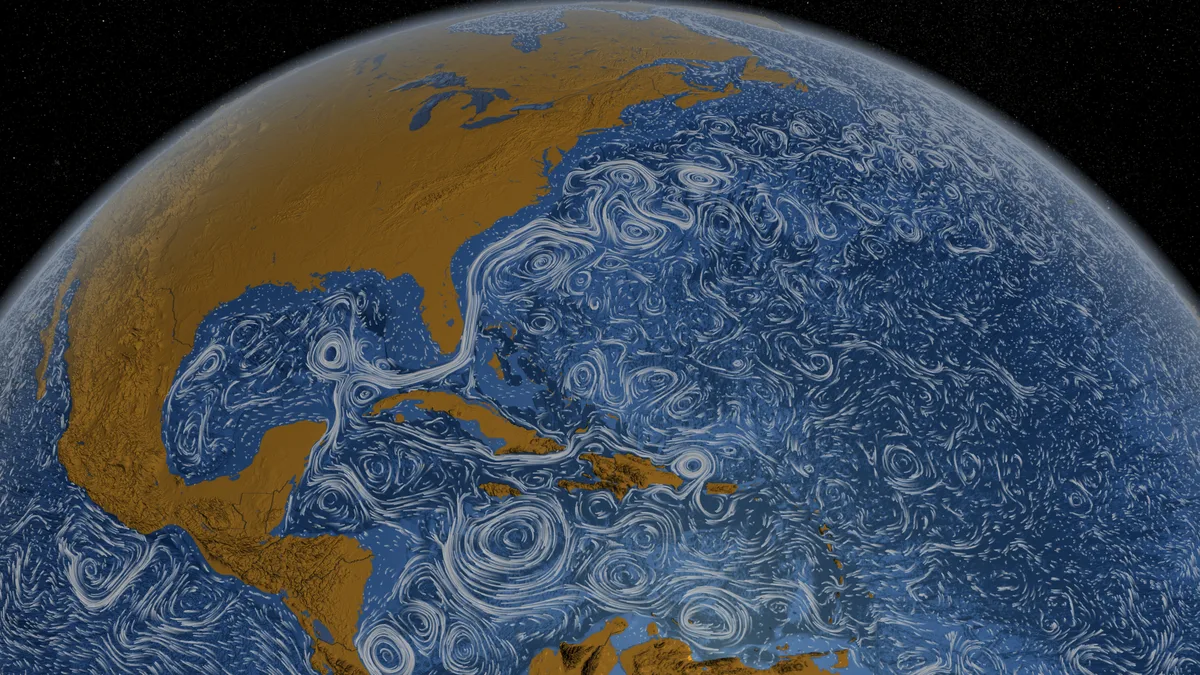
Every live counter on the home page multiplies a yearly flow of plastic, in kilograms per second, by the seconds since you opened the page, since midnight or since 1 January. In model v7 each flow is the value of one named study, with its year, size window, population and pathway. You choose between studies, not between "low" and "high". The choice matters: the three global estimates of plastic emitted into the air that the model offers differ up to 2,100-fold (our calculation)1,2.
≈2,100×
spread between the global air-emission estimates offered as presets
9.6 Mt/yr (2022 inverse model, 5–250 µm) vs 0.0045 Mt/yr (2026, 5–100 µm, scaled to measurements); size windows differ; estimates, not measurements; our calculation1,2
a 2026 preprint, 1.0 Mt/yr for 5–250 µm, lies between them (S-198)
DDisputedThe large home counter shows Σ, the sum of the selected air and water presets. With the v7 defaults Σ is 0.0045 + 1.7 = 1.7045 Mt a year, or 54.0 kg/s (level P). Soil is not in Σ: we found no global estimate of plastic entering soil each year (level E; search scope under Soil).
Σ is a scenario sum, not a measurement and not a mass balance. Air deposits onto water and soil, sea spray lifts ocean plastic back into the air, and wind lifts soil dust7. A particle can therefore count in more than one flow, and the model subtracts nothing. Σ is also neither plastic production (460 Mt in 2019) nor total leakage (22 Mt in 2019)8.
Σ is not a micro- and nanoplastic quantity either. Every water preset covers plastic of all sizes, mostly large debris, because we found no global estimate of micro- or nanoplastic entering the ocean. With the defaults, 99.7% of Σ is that all-size water input (our calculation). Human intake is never added: people take in particles from the same air, water and food.
Estimate
Reproduce one second (v7 defaults). (0.0045 + 1.7) Mt/year × 10⁹ kg/Mt ÷ 31,557,600 s/year = 54.01 kg/s. After one hour the main counter shows about 194 t. Human panel: 0.004081 mg/week × 10⁻⁶ kg/mg × 8,300,678,396 people ÷ 604,800 s/week = 0.056 g/s, about 1.8 t a year worldwide. Model v6 (medium scenario) gave 174.28 kg/s and 1.37 kg/s. The year is 365.25 days. Every figure here is a scenario estimate, not a measurement.
What the v7 counters add, and what they keep apart
| label | value | unit |
|---|---|---|
| Air → Σ | 0.0045 (default, Evangelou 2026); alternatives 1.001 (Tichý 2026, preprint), 9.6 (Evangeliou 2022) | Mt/year |
| Water (all sizes) → Σ | 1.7 (default, OECD 2019); alternatives 0.5 (Kaandorp 2023), 0.8 and 2.7 (Meijer 2021) | Mt/year |
| Soil (not in Σ) | no global estimate; regional reference 0.063–0.43 (Europe, sewage sludge) | Mt/year |
| Σ, defaults | 1.7045 = 54.0 kg/s | Mt/year |
| Overlap: air deposits onto water and soil; sea spray and dust return particles to air | not quantified in the model | |
| Human intake, mass (separate, not added) | 0.004081 (default, adults); 0.001288 (children) | mg/person/week |
| Human intake, count (separate, no counter) | 310 (default, Cox corrected); 203; 68,000; 71,200 | particles/person/day |
Each table lists the selectable presets for one flow, default first. The level grades the finding behind the value, using the rubric on Evidence Levels. Where a study reports a range, a preset uses a stated end of it, never an invented midpoint or confidence bound.
| Preset | Mt/year | Size | Basis | Level |
|---|---|---|---|---|
| Evangelou 2026 (default)1 | 0.0045 (0.0006–0.0089) | 5–100 µm | inventory scaled to 2,782 measurements | C |
| Tichý 2026, preprint9 | 1.001 ± 0.781 | 5–250 µm | inversion of remote deposition data | C |
| Evangeliou 20222 | 9.6 ± 3.6 | 5–250 µm | inversion of western US deposition | C |
The magnitude of global air emissions is disputed (level D). Evangelou and colleagues (2026) compared size-aligned models with 2,782 measurements of air concentration and deposition from 76 studies at 283 sites. The models overestimated measured median concentrations by two to four orders of magnitude. Scaled to the measurements, emissions are 0.0045 Mt a year: about 0.0005 Mt from land and 0.004 Mt from the ocean1.
Tichý and colleagues estimate 1.0 Mt a year, 0.76 Mt of it from the ocean, in a preprint under review (checked 3 November 2026)9. They argue that assumptions about particle size, density and shape drive mass estimates and explain the spread between inventories. The 2022 value is an earlier inverse model fitted to western US deposition data2. It is a historical alternative, not an upper bound, and excludes the microfibers reported separately.
Each preset is graded C, as one study's model result for its own size window; the preprint label stays with Tichý. The air flow is graded D, because the three estimates disagree by up to about 2,100-fold and the dispute is unresolved. Part of the gap is the size windows, 5–100 µm against 5–250 µm: larger particles carry far more mass, so the estimates do not describe the same population. The home page shows both grades, as does Atmosphere1,9,2.
| Preset | Mt/year | Size | Basis | Level |
|---|---|---|---|---|
| OECD, 2019 (default)8 | 1.7 | all sizes | all pathways into the ocean, model | C |
| Kaandorp 202310 | 0.5 | 0.1–1,600 mm, floating | 3D mass budget, about 2020 | C |
| Meijer 2021, lower end11 | 0.8 | all sizes | rivers only, model | C |
| Meijer 2021, upper end11 | 2.7 | all sizes | rivers only, model | C |
No preset measures micro- or nanoplastic. v6 called this flow "micro- and nanoplastic", yet its one traceable value, 0.8, is the lower end of an all-size river estimate11. The OECD default is the only listed estimate covering all polymers and all pathways for a stated year; of 6.1 Mt leaked into all waters in 2019, 1.7 Mt reached the ocean8. The studies define the flow differently, so their spread is not an uncertainty range.
We found no global estimate of plastic entering soil each year (level E; searched the site registry of 379 sources and the web for 2015–2026 on 3 November 2026). The nearest figure is regional and covers one pathway: sewage sludge may deliver 63,000–430,000 t of microplastic a year to European farmland (2016 estimate, level C)12. v7 shows it only as a labeled reference and adds nothing for soil to Σ.
| Preset | mg/person/week | Size | Basis | Level |
|---|---|---|---|---|
| Mohamed Nor 2021, adults (default)5 | 0.004081 | 1–5,000 µm | 8 food types plus air, model | C |
| Mohamed Nor 2021, children5 | 0.001288 | 1–5,000 µm | same model | C |
The presets are graded C as single-model results; the flow itself is graded D, because published mass estimates differ about 1.2 million-fold and the high estimate is contested (see Disputed estimates below)5,6.
The adult value is the model's median, 583 ng a day, times seven (our calculation)5. The global panel multiplies it by everyone alive, which extends an adult rate to children; the child median is selectable for that reason. The contested 5 g/week estimate appears below as a comparison, not as a preset.
| Preset | Particles/person/day | Size | Basis | Level |
|---|---|---|---|---|
| Cox 2019, corrected, top (default)3 | 310 | not size-resolved | US diet (about 15% of calories) plus air | C |
| Cox 2019, corrected, bottom3 | 203 | not size-resolved | same | C |
| Yakovenko 2025, adults13 | 68,000 ± 40,000 | 1–10 µm | indoor inhalation, extrapolated | C |
| Yakovenko 2025, adults13 | 71,200 | 1–300 µm | our sum of 68,000 and 3,200 | C |
Cox and colleagues estimated 74,000–121,000 particles a year including inhalation, depending on age and sex. Their 2020 correction lowers the top to 113,000, about 310 a day (our calculation)3,14,4. They covered about 15% of American caloric intake and call their figures likely underestimates. Yakovenko and colleagues extrapolated adult indoor inhalation from 12 air samples in Toulouse homes and cars plus published data13. Neither is total intake.
Counts and mass are separate models. A sphere's mass grows with the cube of its diameter, so a 100 µm particle weighs a million times more than a 1 µm particle of the same polymer (level P). The site never converts one into the other, and no v7 counter displays counts.
v7 keeps a slider only for air and water, labeled "hypothetical control". Its endpoints are the lowest and highest values the named studies report: 0.0006–13.2 Mt a year for air and 0.5–2.7 Mt a year for water (level P). A value set there is your own assumption, not a study result or an uncertainty interval. The soil and both human sliders are removed: their v6 endpoints had no source, and the human mass maximum was the contested 5 g/week.
Every v7 preset on its own scale (log)
| label | value | unit | low | high | size_window | level | source_id |
|---|---|---|---|---|---|---|---|
| Air · Evangelou 2026 (default) | 0.0045 | Mt/year | 0.0006 | 0.0089 | 5–100 µm | C | S-052 |
| Air · Tichý 2026 (preprint) | 1.001 | Mt/year | 0.22 | 1.782 | 5–250 µm | C | S-198 |
| Air · Evangeliou 2022 | 9.6 | Mt/year | 6 | 13.2 | 5–250 µm | C | S-199 |
| Water · OECD 2019 (default) | 1.7 | Mt/year | all sizes | C | S-011 | ||
| Water · Kaandorp 2023 | 0.5 | Mt/year | 0.1–1,600 mm, floating | C | S-071 | ||
| Water · Meijer 2021, rivers, lower end | 0.8 | Mt/year | all sizes | C | S-069 | ||
| Water · Meijer 2021, rivers, upper end | 2.7 | Mt/year | all sizes | C | S-069 | ||
| Soil · Europe, sewage sludge, lower end (reference only) | 0.063 | Mt/year | microplastic | C | S-082 | ||
| Soil · Europe, sewage sludge, upper end (reference only) | 0.43 | Mt/year | microplastic | C | S-082 | ||
| Human mass · Mohamed Nor 2021, adults (default) | 0.004081 | mg/person/week | 1–5,000 µm | C | S-103 | ||
| Human mass · Mohamed Nor 2021, children | 0.001288 | mg/person/week | 1–5,000 µm | C | S-103 | ||
| Human count · Cox 2019 corrected, top (default) | 309.6 | particles/person/day | not size-resolved | C | S-101 | ||
| Human count · Cox 2019 corrected, bottom | 202.7 | particles/person/day | not size-resolved | C | S-101 | ||
| Human count · Yakovenko 2025, 1–10 µm | 68000 | particles/person/day | 28000 | 108000 | 1–10 µm | C | S-063 |
| Human count · Yakovenko 2025, 1–300 µm | 71200 | particles/person/day | 1–300 µm | C | S-063 |
| Study | mg/person/week | Scope | Role in v7 |
|---|---|---|---|
| Mohamed Nor 20215 | 0.004081 | adult median, 1–5,000 µm, model | default preset |
| Senathirajah 20216 | 100–5,000 | global average, 0–1 mm, counts × average mass | comparison only |
| Pletz 202215 | none | critique of Senathirajah 2021 | comparison only |
Human intake by mass is disputed (level D). Senathirajah and colleagues converted particle counts from 59 publications into mass with an average particle mass and obtained 0.1–5 g a week. They describe their assumptions as conservative and the estimate as a first step toward risk assessment6. Pletz (2022) traces the gap to how sizes and particle masses were combined and concludes the estimate is too high by several orders of magnitude15.
v6 offered that range as two scenarios: 5,000 mg as "high" and 100 mg, its bottom, as "medium". v7 keeps it only in this table. For air, all three estimates stay selectable because each is a defensible study result for its own size window; the dispute is stated beside them.
v6 set its high count scenario at 142,000 particles per person per day, with no source. Two readings fit the number, and the v6 code records neither (level P)16.
The first reading is a unit slip. The upper ingestion-only estimate of Cox and colleagues, 52,000 particles a year, is 142 a day (our calculation)3; the corrected release changes only the range that includes inhalation4. The second reading is a deliberate choice: 142,000 is exactly twice the v6 medium of 71,000, a doubling with no study behind it.
Either way the value is removed. v7 does not adopt 142 a day, because a diet-only US estimate and an indoor inhalation model describe different pathways and cannot be ends of one control.
| Value | v7 | Scope | Level |
|---|---|---|---|
| Population17 | 8,300.7 million | world, 1 July 2026, UN WPP 2024 medium variant; held fixed | P |
| Population change17 | 68.9 million/yr | 2026; documented, not applied | P |
| Year | 31,557,600 s | 365.25 days | P |
| 1 Mt/year | 31.69 kg/s | our calculation | P |
| Production8 | 460 Mt/yr | global, 2019 | B |
| Leakage8 | 22 Mt/yr | all sizes, 2019; 12% microplastic = 2.64 Mt | C |
| Ocean stock8 | 30 Mt | modeled accumulation to 2019 | C |
| River and lake stock8 | 109 Mt | modeled accumulation to 2019 | C |
| North Atlantic nanoplastic18 | 27 Mt | PET, PS, PVC below 1 µm, mixed layer, one 2020 cruise, extrapolated | C |
| Blood19 | 1.6 µg/mL | mean, 22 Dutch donors, ≥ 700 nm, 2022 | D |
| Brain20 | 4.9 mg/g | median, frontal cortex, 2024 samples | D |
| Indoor air13 | 528 /m³ | median, 7 homes, Toulouse, 1–10 µm | C |
| Car cabin air13 | 2,238 /m³ | median, 5 car cabins, same study | C |
The 30 Mt ocean stock and the 3.2 Mt of Kaandorp and colleagues are different inventories. The OECD figure is a modeled accumulation of leaked waste; the 3.2 Mt is plastic that floated on entry, 0.1–1,600 mm, in 2020, from coastlines to the deep ocean10. Neither is a nanoplastic census, and the site neither adds nor subtracts them.
Blood and brain values are disputed (level D). Rauert and colleagues found py-GC/MS unsuitable for polyethylene and PVC in blood because lipids interfere21, and the Leslie group has since published a revised workflow22. A Matters Arising questions the brain digestion and specificity23, and the authors defend their data24. Both sides are on Human Body.
Model v6 (evidence snapshot 14 October 2026) is replaced by model v7 under the owner's decision of 3 November 2026. The home page has run v7 since 4 November 2026. Every v6 value and its fate (level P)16:
| v6 value | v7 disposition | Reason |
|---|---|---|
| Water low 0.8 Mt/yr | kept, Meijer 2021 lower end | traced; relabeled all sizes, rivers |
| Water mid 1.5 Mt/yr | removed | no source; OECD 1.7 added separately |
| Water high 2.5 Mt/yr | removed | no source; Meijer upper end 2.7 added |
| Air low 0.2 Mt/yr | removed | no source |
| Air mid 1.0 Mt/yr | removed | no source; Tichý preprint added as its own preset |
| Air high 9.6 Mt/yr | kept, Evangeliou 2022 | historical model, not an upper bound |
| Soil 1.0 / 3.0 / 7.0 Mt/yr | removed | no global estimate; soil leaves Σ |
| Human mass low 0.0041 mg/wk | kept as 0.004081 | Mohamed Nor median, unrounded |
| Human mass mid 100 mg/wk | removed | bottom of a contested range |
| Human mass high 5,000 mg/wk | comparison only | contested (Pletz 2022) |
| Count low 331/day | corrected to 310/day | Cox correction, 113,000/yr |
| Count mid 71,000/day | two Yakovenko presets | unrecorded rounding of 68,000 + 3,200 |
| Count high 142,000/day | removed | no source; two readings above |
| All ten slider endpoints | air and water rebuilt; others removed | no recorded basis |
| "Ocean, all plastic" 9.5 Mt/yr | removed | no source; OECD 1.7 and 6.1 Mt are defined otherwise |
| "Plastic in a brain" 7 g | removed | whole-organ extrapolation of a cortex median |
| Eight comparison masses (card to Eiffel Tower) | removed | unsourced, never displayed |
| Population 8.30 × 10⁹ | 8,300,678,396 | UN WPP 2024, 1 July 2026 |
| Growth 69 million/yr | documented, not applied | never applied in v6 |
The machine-readable model, with every preset, conversion factor, removed value and reason, is published as a download: counter-model.json, model v7 of 3 November 2026, available with this page since 4 November 2026 (level P)16. The claims ledgers and verifier verdicts behind this page are not yet published; that download is planned.
What kind of number is each v7 entry?
| label | value | unit | source_id |
|---|---|---|---|
| Air: Evangelou 2026 (default), Evangeliou 2022 | model estimate, peer reviewed, disputed | S-052, S-199 | |
| Air: Tichý 2026 | model estimate, preprint, disputed | S-198 | |
| Water: OECD 2019 (default) | agency model estimate | S-011 | |
| Water: Kaandorp 2023, Meijer 2021 | model estimate, peer reviewed | S-071, S-069 | |
| Soil: global input | not established | ||
| Soil: Europe, sewage sludge (reference) | model estimate, regional | S-082 | |
| Human mass: Mohamed Nor 2021 | model estimate | S-103 | |
| Human mass: Senathirajah 2021 | model estimate, contested, comparison only | S-104 | |
| Human count: Cox 2019 corrected | model estimate | S-101, S-275 | |
| Human count: Yakovenko 2025 | extrapolation from measurements | S-063 | |
| Population, change, seconds, conversions | official projection, definition, arithmetic | S-274 | |
| Context: production, leakage, stocks | agency model estimate | S-011 | |
| Context: North Atlantic nanoplastic 27 Mt | extrapolation from measurements | S-067 | |
| Context: blood, brain (disputed); indoor and car air | measurement | S-087, S-092, S-063 | |
| Removed: 9 v6 scenario values, 10 slider endpoints, 9.5 Mt/yr, 7 g, 8 comparison masses | removed, no source |
Any later change to a value creates a new model version and a dated row in the record above, with the old value, the new value, the reason and the source. We plan a public corrections log on Corrections & Contact; no reader corrections have been recorded yet.
In v6 the page address accepted ?scenario=low, mid or high and numeric ocean=, air=, soil=, human= and particles=. v7, live since 4 November 2026, keeps lang, base and lite. It takes preset ids for air, ocean, human and particles, such as ?air=tichy2026_preprint; air and ocean also accept a number inside their hypothetical ranges, which sets "custom (hypothetical)". scenario and soil are retired, and an unknown or out-of-range value keeps the default with a console warning (level P)16.
For the science behind each flow, see Atmosphere, Oceans, Soil and Human Body. For reading numbers in general, see How to Read the Numbers; for sources, Methods & Sources; for the home counters, Planet Overview.
Editorial categories of this site. A–E grade scientific findings, per claim, with a one-line rationale; D and E are not lower rungs of the A–C scale. P is not a grade: it marks facts checked against their primary record.
BELOW THE VISIBLE
Air, water, soil and lung tissue move and hold plastic particles by different processes: settling and turbulence, buoyancy and biofilm, pore entrapment and surface charge, size-dependent deposition. The four home panels illustrate these with enlarged particles; the air, water and lung panels carry model-estimate counters, and soil has none.
Each medium sorts particles by its own rules. In air, settling competes with wind, turbulence and rain, and shape changes how fast a particle falls. In water, buoyancy decides first and living films may change the outcome. In soil, narrow pores and charged mineral surfaces can hold particles back. In the lung, size decides where an inhaled particle lands. In breathing experiments, particles about 0.5 µm across deposited least of all (level B)1.
That size is too large to diffuse quickly and too small to settle quickly. The four panels on the home page illustrate these processes. They do not record real particles.
≈0.5 µm
particle size the human lung catches least efficiently
total deposition in healthy adults breathing monodisperse test aerosols at controlled patterns; aerosol particles in general, not plastic-specific1
B: a review of several human deposition studies, all showing the minimum; its depth shifts with breathing pattern
BWell supportedup to 76%
slower settling of model fibers than spheres of the same volume
laboratory settling in air of 3D-printed acrylic fibers 0.5–2 mm long (length 20–100 times the diameter) versus volume-equivalent spheres2
C: one laboratory study; the long-range transport that follows is a model estimate
CLimited≈0.6 µm
harmonic mean thickness of the air-blood tissue barrier
morphometry of lungs of young healthy adults (70 kg); arithmetic mean about 1.6 µm; alveolar surface about 130 m²3
C: one classic morphometric dataset; thickness is not a size cutoff for passage
CLimitedThe home page shows four panels: air, water, soil and lung tissue. Each combines a still background made with an AI image generator and particles drawn live by the page's code, which drift, sink, lodge or move with a breathing rhythm. The particles are enlarged far beyond true scale so that the motion is visible.
Beside the air, water and lung panels a counter adds up mass from a named study value chosen in settings (for the human body, an intake estimate); it is an estimate, not a measurement, explained in Flows & Model. The soil panel has no counter: we found no sourced global estimate of plastic entering soil. The panels show which process dominates in each medium, so that the numbers on the system pages make physical sense.
What controls particles in each microworld
| label | value | unit | conditions | level | source |
|---|---|---|---|---|---|
| air | settling, wind and turbulence, and dry and wet deposition decide how long particles stay aloft | shape: model fibers settled up to 76% slower than same-volume spheres; the lung's 0.5 µm minimum is not a rule for open air | B (processes); C (fiber result) | S-283, S-049 | |
| water | buoyancy first: polyethylene and polypropylene float, yet reach deep sediment traps and sediments | biofouling may sink particles (model); disputed for particles of 100 µm or less, where marine snow and ingestion are proposed instead | B (deep finds); C (model); D (small-particle sinking) | S-278, S-277 | |
| soil | entrapment in narrow pore channels and adsorption to grain surfaces | charged iron and aluminum sites may impede migration; in one cited study smaller particles stayed better dispersed yet moved less; controls: particle, flow, porous medium, co-transported substances | C (mechanisms); B (groups of controls) | S-279, S-280 | |
| lung tissue | size-dependent deposition: total deposition lowest near 0.5 µm; diffusion dominates below 0.5 µm, sedimentation at 1–8 µm, impaction mainly above 5 µm | therapeutic aerosols: above about 6 µm mainly upper airway, below about 2 µm mainly alveolar; shifts with breathing, density and shape; fibers also deposit by interception | B (mechanisms, minimum); C (regional cutoffs) | S-281 |
Particles leave the air by settling, by wind and turbulence carrying them to surfaces, and in rain or snow; transport models and field samplers track this dry and wet deposition (level B)2,8. The lung's 0.5 µm minimum was measured in breathing experiments and is not a rule for open air (level P)1.
In laboratory tests, 3D-printed model fibers 0.5–2 mm long settled up to 76% slower than same-volume spheres; a transport model then found 1 mm fibers more likely than spheres to reach the high Arctic (level C, model estimate)2. In western US protected areas, dry-deposited plastic was smaller than plastic washed out by rain (level C)8.
 Illustration
Polyethylene (PE) and polypropylene (PP) float in seawater, yet both turn up in deep sediment traps and deep-sea sediments (level B)5. One explanation is biofouling. A 2017 model by Kooi and colleagues added biofilm growth to settling: depending on size and density, particles floated, sank to the seafloor or oscillated up and down, with small particles collecting at intermediate depths (level C, model estimate)4.
The small-particle case is disputed. Benner and Passow (2024) argue that particles of 100 µm or less cannot host the heavy organisms needed to sink, and point to marine snow and ingestion instead (level D)5.
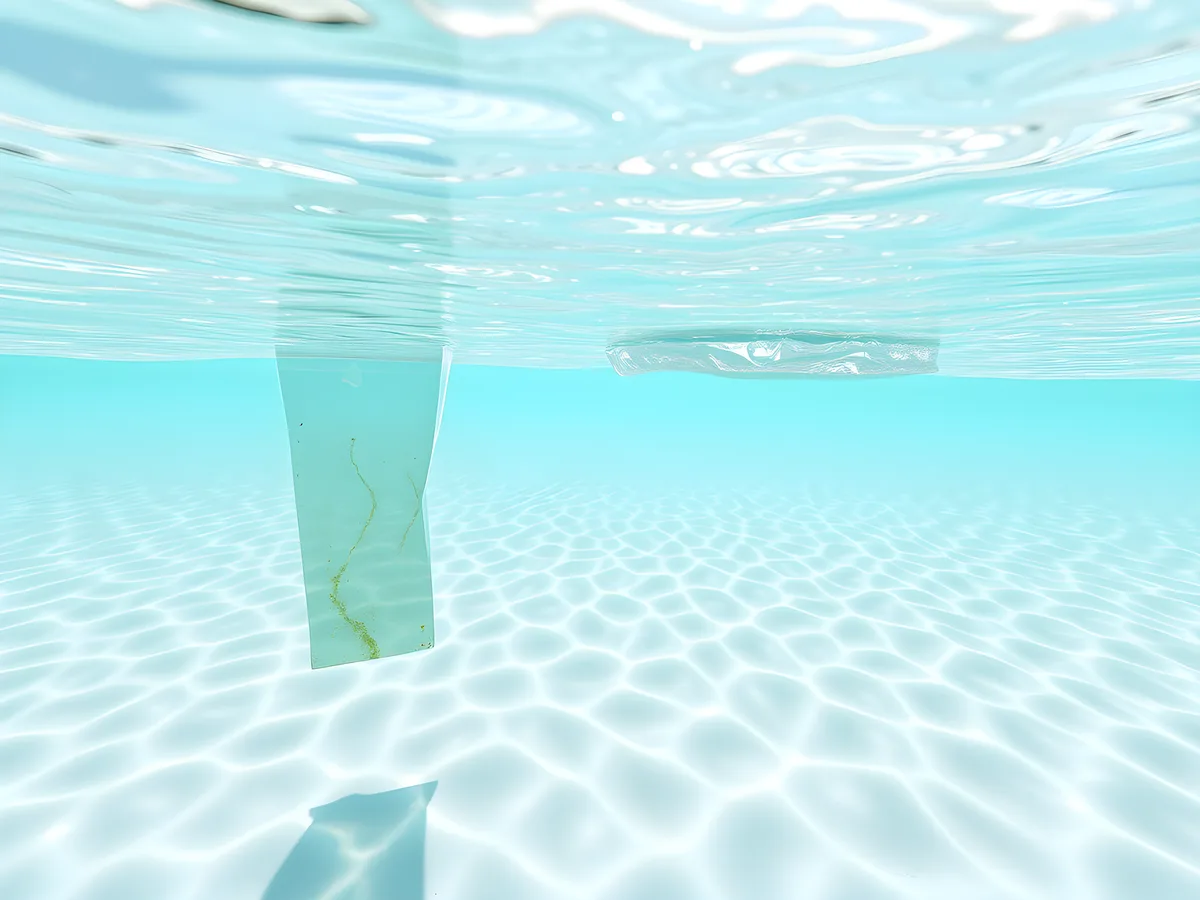 Illustration
A 2024 review of porous media notes that particles can enter fine pores but can also be trapped in narrow channels (straining), and that attraction between positively charged iron and aluminum sites and negatively charged plastic may impede migration (level C)6. Size alone gives no simple rule: the review reports a study in which smaller particles stayed better dispersed yet moved less (level C)6.
A second review sorts the controls into particle, flow and porous-medium properties, plus co-transported substances (level B)7. In a greenhouse experiment, earthworms carried polyethylene beads down the soil profile, and smaller beads were moved down more (level C)9.
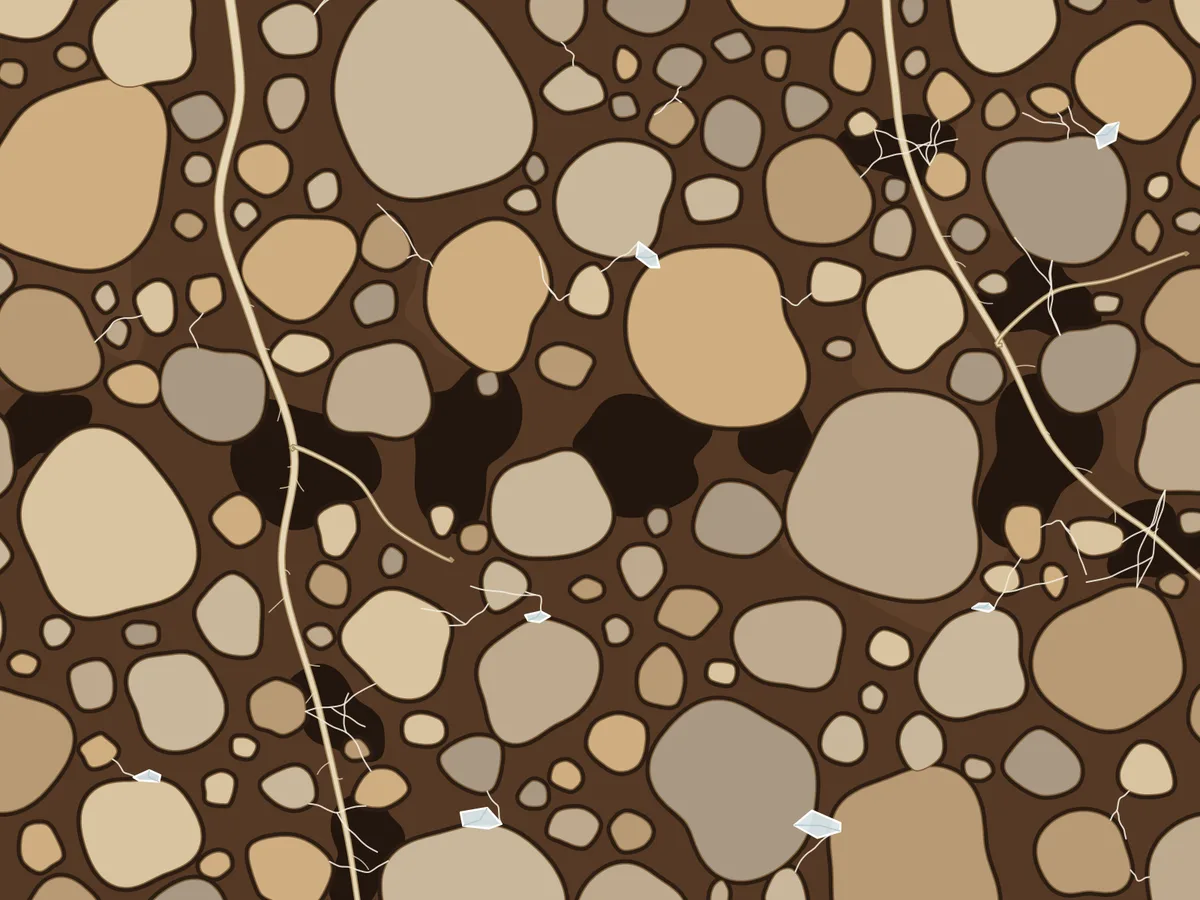 Illustration
The panel shows alveoli, the lung's gas-exchange sacs. In young healthy adults the air-blood tissue barrier has a harmonic mean thickness of about 0.6 µm (level C)3; thinness is not a size cutoff for passage. Inhaled therapeutic aerosols above about 6 µm deposit mainly in the upper airway, those below about 2 µm mainly in the alveolar region (level C)1.
These are tendencies, not limits for plastic fragments or fibers. The review does not say whether its diameters are aerodynamic; impaction also depends on density, and fibers deposit by interception, negligible for spheres (level B)1. Deposition is exposure only; uptake is covered on Human Body.
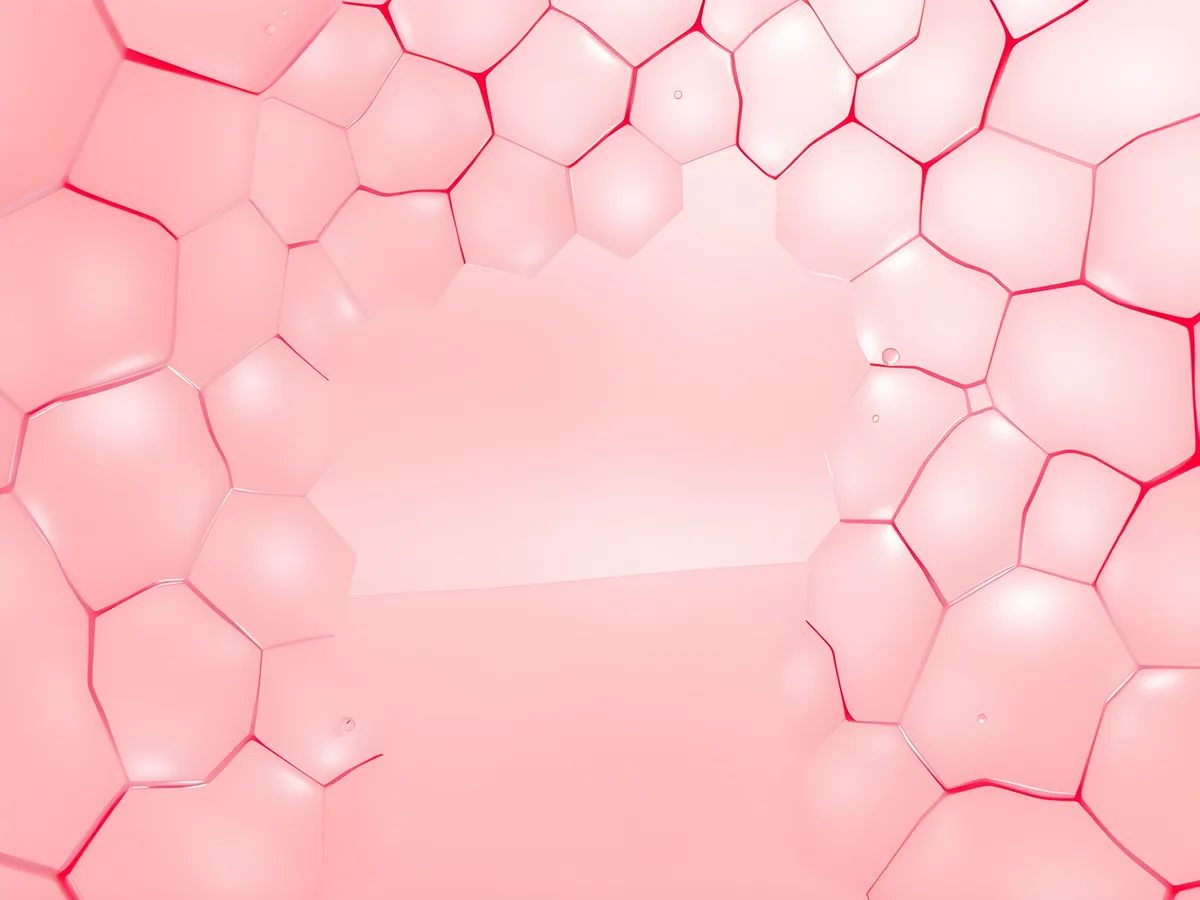 Illustration
Limitation
The panels are not microscopy and not recordings of real samples. Backgrounds are AI illustrations, particles are drawn by code and enlarged far beyond true scale, and the lung panel shows no real person's tissue. Particle paths are scripted for legibility, not computed by a transport model. The counters are estimates, not measurements, and the soil panel has none.
Amounts and evidence for each medium are on Atmosphere, Oceans, Soil and Human Body. The same scales in one continuous zoom are in From Planet to Cell.
 Illustration
Editorial categories of this site. A–E grade scientific findings, per claim, with a one-line rationale; D and E are not lower rungs of the A–C scale. P is not a grade: it marks facts checked against their primary record.
WHERE CERTAINTY ENDS
A map of what is known and unknown about micro- and nanoplastics: four systems, seven questions, 46 graded findings. Microplastic presence is established in air, water, soil and human exposure; nanoplastic amounts, soil methods and removal from open systems remain the weakest answers.
 Illustration
Some answers about micro- and nanoplastics are settled. Microplastics are in the air of remote mountains, in every ocean basin, in farm soils and in what people eat and breathe. Other answers are barely begun: how much nanoplastic there is, how to extract it from soil, and whether any method removes particles from open air, water or soil.
This map grades 46 checkable findings across four systems (air, water, soil, human body) and seven questions. Microplastics (MP, 1 µm–5 mm) and nanoplastics (NP, below 1 µm) are graded separately wherever their evidence differs, so a weak nano result does not pull down an established micro one.
One number shows how thin the nano layer is. About 27 million metric tons (27 Mt) of nanoplastic in the North Atlantic mixed layer is an extrapolation from nine open-ocean stations sampled on one cruise in November 2020 (level C)1.
27 Mt
nanoplastic mass estimate, North Atlantic mixed layer
PET, PS and PVC below 1 µm; mixed-layer sum for stations 1–9 (12 stations sampled, three on the European shelf); RV Pelagia cruise 64PE480, November 2020; TD-PTR-MS; spatial extrapolation1
one transect; polyethylene and polypropylene were not detected
CLimited283
locations behind the global dataset of airborne microplastics
2,782 concentration and deposition measurements from 76 studies; coordinates rounded to four decimals (one Wenzhou site duplicated by floating-point noise in the raw file)2,3
the compiled data describe sizes from several µm to several mm
PProvenance0
measurement locations on the African mainland in that dataset
our count in the published dataset, 3 November 2026; two Canary Islands sites are coded as Atlantic Ocean3
our calculation; a sampling gap, not evidence of clean air
PProvenance1.4%
overall recovery of a particle-preserving nanoplastic extraction from soil
Forsyth et al. 2026; palladium-doped nanoplastic spikes; extraction, density separation, filtration below 1 µm and ultrafiltration combined4
single laboratory study; the steps alone recovered 38–92%
CLimitedEach row is one finding, stated so that it can be checked: a system, a question, the size class and the claim. Occurrence asks whether particles are present and, in a separate row where it matters, how much; sources, where they come from; transport, how they move (for the human body, uptake and distribution); effects, what they do; methods, whether they can be measured reliably and comparably; removal, whether a tested method takes them out; regulation, which rules exist.
The level grades the evidence for that finding, not whether the news is good or bad. E means not established in the evidence we reviewed, with the search recorded below. Rule rows carry P: they are legal facts checked against the official text, not graded science. The rubric is in Evidence Levels.
| System | Question | Level | Why this level | Sources |
|---|---|---|---|---|
| air | occurrence · MP: present in outdoor air, from cities to remote and polar sites | AConsensus | Independent studies in Europe, North America and the Arctic; European academies review lists air as contaminated | 5,6,7,2,8 |
| air | occurrence · MP: global concentrations quantified | CLimited | 283 locations, 35 southern, none on the African mainland; values span orders of magnitude | 2,3 |
| air | occurrence · NP: present in remote snow and ice | CLimited | Alpine snow and polar ice, measured by one research group with one method (TD-PTR-MS) | 9,10,11 |
| air | sources · MP: land versus ocean emission shares | DDisputed | Emission inventories disagree; models exceed measured concentrations 100- to 10,000-fold | 2,12,13 |
| air | transport · MP: long-range transport to remote regions | AConsensus | Remote deposition documented independently on several continents; European academies review concurs | 5,6,7,8 |
| air | transport · MP+NP: fluxes and residence times | CLimited | Few flux measurements; nanoplastics tracked by one method in snow and ice | 14,10,11 |
| air | effects · MP+NP: direct radiative forcing | CLimited | Three model studies, 2021–2026; sign and size depend on color, size and concentration assumptions | 15,16,17,18 |
| air | methods · MP+NP: comparable ambient measurement | CLimited | No air standard found; compiled studies differ in size windows; nanoplastics only by research instruments | 2,9,19 |
| air | removal · MP+NP: removal from outdoor air at scale | EUnknown | Not established in evidence reviewed; indoor HEPA filters retain only particles in the air passing through | 20,21 |
| air | regulation · rules in force | PProvenance | Euro 7 frames tire-abrasion limits at the source; no ambient-air plastic limit in the EU acts checked | 22 |
| water | occurrence · MP: present in every ocean basin, lakes and rivers | AConsensus | Many independent surveys; European academies (2019) and Thompson et al. (2024) reviews concur | 23,24,25,8,21 |
| water | occurrence · NP: present in seawater and fresh water | BWell supported | Independent groups detected nanoplastics in the North Atlantic (2017, 2025) and Chinese surface water and groundwater | 26,1,27 |
| water | occurrence · NP: ocean mass inventory | CLimited | 27 Mt extrapolated from nine open-ocean stations on one 2020 cruise; PE and PP undetected | 1 |
| water | sources · MP: land and river inputs to the ocean | CLimited | Inputs come from models, not measured budgets | 28,29 |
| water | sources · NP: origin of open-ocean nanoplastics | EUnknown | Authors of the only basin-scale profile call the origin open; no open-ocean source apportionment found | 1,30 |
| water | transport · MP+NP: sinking, sea-spray and deep fluxes | CLimited | River pathways modeled; sea-spray export from laboratory experiments; deep fluxes sparsely measured | 29,31,32,33,14 |
| water | effects · MP: effects on aquatic organisms in laboratory tests | BWell supported | Many tests; a quality review of 105 retains food dilution and physical damage as mechanisms | 34,21 |
| water | effects · MP: effects at field-realistic exposure | CLimited | None of 105 aquatic studies met all quality criteria; exposure relevance and size mismatch are main weaknesses | 34 |
| water | effects · NP: dose-effect relationships | CLimited | European academies (2019): most nanoplastic designs could not establish a dose-effect relationship | 8 |
| water | methods · MP ≥ 20 µm: standardized measurement | BWell supported | ISO 16094-2 and the EU method adopted; interlaboratory exercises found spread, largest for small particles | 35,36,37,38,39 |
| water | methods · NP: validated mass measurement | CLimited | Research methods (py-GC/MS, TD-PTR-MS) used by few groups; no standard or interlaboratory study found | 1,40,27 |
| water | removal · MP: retention by wastewater treatment | AConsensus | WHO (2019) reports removal above 90%; independent plant studies agree | 41,40 |
| water | removal · NP: retention by treatment | CLimited | Three Australian plants cut nano mass 91–96%; pilot filtration retained metal-doped model particles | 40,42 |
| water | removal · MP+NP: removal from open water | EUnknown | Not established in evidence reviewed; ocean cleanup targets floating macroplastic | 43,21 |
| water | regulation · rules in force | PProvenance | EU method 20 µm–5 mm; California Phase I reports from 50 µm; no limit value; nanoplastics outside both | 36,44,45 |
| soil | occurrence · MP: present in soils, including farmland | AConsensus | European academies review and FAO assessment agree with many soil studies | 8,46,47 |
| soil | occurrence · MP: comparable concentrations across soils | CLimited | Review finds soil methods differ, so concentrations are hard to compare | 48 |
| soil | occurrence · NP: present in field soil | CLimited | Few field data; polystyrene nanoplastics measured at one compost-amended French site by matrix-matched py-GC/MS (2.57 µg/g in the 200–1,000 nm topsoil fraction, about 28 times a reference plot); a second French field gives only an isotope estimate of the mobile fraction (about 0.25 µg/kg to 55 cm) | 49,50 |
| soil | occurrence · NP: representative multi-polymer mass across farm soils | EUnknown | Not established in evidence reviewed; the one field quantification we read covers one polymer at one site | 49,50 |
| soil | sources · MP: sludge, mulch film and compost | BWell supported | FAO covers mulch film and compost; sludge rests on separate studies; amounts are estimates | 46,51,47 |
| soil | transport · NP: uptake into plants | CLimited | Laboratory beads enter crop roots; one field study found polystyrene mostly in roots, shoots below LOQ | 52,53,49 |
| soil | effects · MP+NP: soil structure, microbes and crops | CLimited | Laboratory and outdoor-mesocosm studies; direction varies by polymer, shape and dose | 54,47,55,53 |
| soil | methods · MP: standardized, interlaboratory-tested method | CLimited | No published standard or interlaboratory results found; review finds methods incomparable | 48 |
| soil | methods · NP: validated extraction and quantification | CLimited | Polystyrene-specific py-GC/MS method tested with spikes; particle-preserving extraction recovered 1.4% | 56,4 |
| soil | removal · MP+NP: removal from field soil | EUnknown | Not established in evidence reviewed; biochar reduced lettuce uptake in one greenhouse study | 57 |
| soil | regulation · rules in force | PProvenance | EU Soil Monitoring Law allows plastic monitoring, sets no plastic method or limit; REACH restricts products | 58,59 |
| human | occurrence · MP: present in human tissues | BWell supported | Independent groups using different methods report particles in blood, brain and arterial plaque | 60,61,62,63 |
| human | occurrence · MP+NP: tissue mass concentrations | DDisputed | Brain and blood values disputed over lipid interference and contamination; authors defend their data | 61,64,65,66,60 |
| human | sources · MP: exposure through food, water and air | AConsensus | Two WHO assessments and an EFSA panel statement concur | 41,67,68 |
| human | sources · MP: weekly intake mass | DDisputed | Model estimates span about 4 µg to 5 g per week, with different size windows and conversions | 69,70,67 |
| human | transport · NP: uptake, distribution and clearance | CLimited | Shown with model beads in animals; WHO (2022) found human data insufficient | 67,71,72 |
| human | effects · MP+NP: association with disease | CLimited | One cohort (257 followed): plaque plastic associated with heart attack, stroke, death; causation unshown | 63,73 |
| human | methods · MP+NP: blood quantification by py-GC/MS | DDisputed | Rauert: unsuitable for PE and PVC in blood; Nardella: detected in all 102, quantified in 20% | 66,74,75 |
| human | removal · MP: lowering circulating particles clinically | CLimited | One uncontrolled study, 114 patients; tubing shed particles; benefit and nano removal not established | 76,77 |
| human | regulation · rules in force | PProvenance | No health-based guidance value adopted by WHO or the EU found | 41,67 |
| human | regulation · MP+NP: evidence basis for a guidance value | BWell supported | WHO 2022: insufficient for full assessment; WHO 2019: drinking water low concern, nano data insufficient | 67,41,8 |
Knowledge map: evidence level of each finding, by system and question
| label | value | unit | system | question | size_class |
|---|---|---|---|---|---|
| air · occurrence · MP present | A | air | occurrence | MP | |
| air · occurrence · MP quantified | C | air | occurrence | MP | |
| air · occurrence · NP present | C | air | occurrence | NP | |
| air · sources · MP shares | D | air | sources | MP | |
| air · transport · MP long-range | A | air | transport | MP | |
| air · transport · fluxes | C | air | transport | MP+NP | |
| air · effects · radiative forcing | C | air | effects | MP+NP | |
| air · methods · comparability | C | air | methods | MP+NP | |
| air · removal · outdoor | E | air | removal | MP+NP | |
| air · regulation · rules | P | air | regulation | MP+NP | |
| water · occurrence · MP present | A | water | occurrence | MP | |
| water · occurrence · NP present | B | water | occurrence | NP | |
| water · occurrence · NP ocean mass | C | water | occurrence | NP | |
| water · sources · MP inputs | C | water | sources | MP | |
| water · sources · NP origin | E | water | sources | NP | |
| water · transport · vertical and air-sea fluxes | C | water | transport | MP+NP | |
| water · effects · MP laboratory | B | water | effects | MP | |
| water · effects · MP field-realistic | C | water | effects | MP | |
| water · effects · NP dose-effect | C | water | effects | NP | |
| water · methods · MP standard | B | water | methods | MP | |
| water · methods · NP mass | C | water | methods | NP | |
| water · removal · MP wastewater | A | water | removal | MP | |
| water · removal · NP treatment | C | water | removal | NP | |
| water · removal · open water | E | water | removal | MP+NP | |
| water · regulation · rules | P | water | regulation | MP+NP | |
| soil · occurrence · MP present | A | soil | occurrence | MP | |
| soil · occurrence · MP comparable | C | soil | occurrence | MP | |
| soil · occurrence · NP present (field) | C | soil | occurrence | NP | |
| soil · occurrence · NP representative mass | E | soil | occurrence | NP | |
| soil · sources · MP inputs | B | soil | sources | MP | |
| soil · transport · NP plant uptake | C | soil | transport | NP | |
| soil · effects · structure, microbes, crops | C | soil | effects | MP+NP | |
| soil · methods · MP standard | C | soil | methods | MP | |
| soil · methods · NP extraction | C | soil | methods | NP | |
| soil · removal · field soil | E | soil | removal | MP+NP | |
| soil · regulation · rules | P | soil | regulation | MP+NP | |
| human · occurrence · MP present | B | human | occurrence | MP | |
| human · occurrence · tissue mass | D | human | occurrence | MP+NP | |
| human · sources · exposure routes | A | human | sources | MP | |
| human · sources · intake mass | D | human | sources | MP | |
| human · transport · NP uptake | C | human | transport | NP | |
| human · effects · disease association | C | human | effects | MP+NP | |
| human · methods · blood py-GC/MS | D | human | methods | MP+NP | |
| human · removal · plasma exchange | C | human | removal | MP | |
| human · regulation · rules | P | human | regulation | MP+NP | |
| human · regulation · evidence basis | B | human | regulation | MP+NP |
Two patterns run across the rows. Microplastic presence reaches A in every environmental system, while every nanoplastic finding sits at B or below.
Removal splits the same way: wastewater treatment retains most microplastics (A) and, in three plants, most nanoplastic mass (C), but in the evidence we reviewed no method has been shown to remove dispersed particles from outdoor air, open water or field soil (E). That matches the 0 / 4 finding in Solutions by System. The human removal row is a different question, a clinical one, and stays at C76.
Ten Hietbrink and colleagues found PET, polystyrene (PS) and polyvinyl chloride (PVC) nanoplastics at about 1.5–32.0 mg/m³ at all 12 stations, surface to bottom (level C)1. The 27 Mt estimate sums the mixed layer at the nine open-ocean stations, not the three on the shelf. Polyethylene (PE) and polypropylene (PP), about half of global plastic production, were not detected: the authors' "missing PE and PP nanoplastic paradox"1. We found no second basin-scale profile to test it.
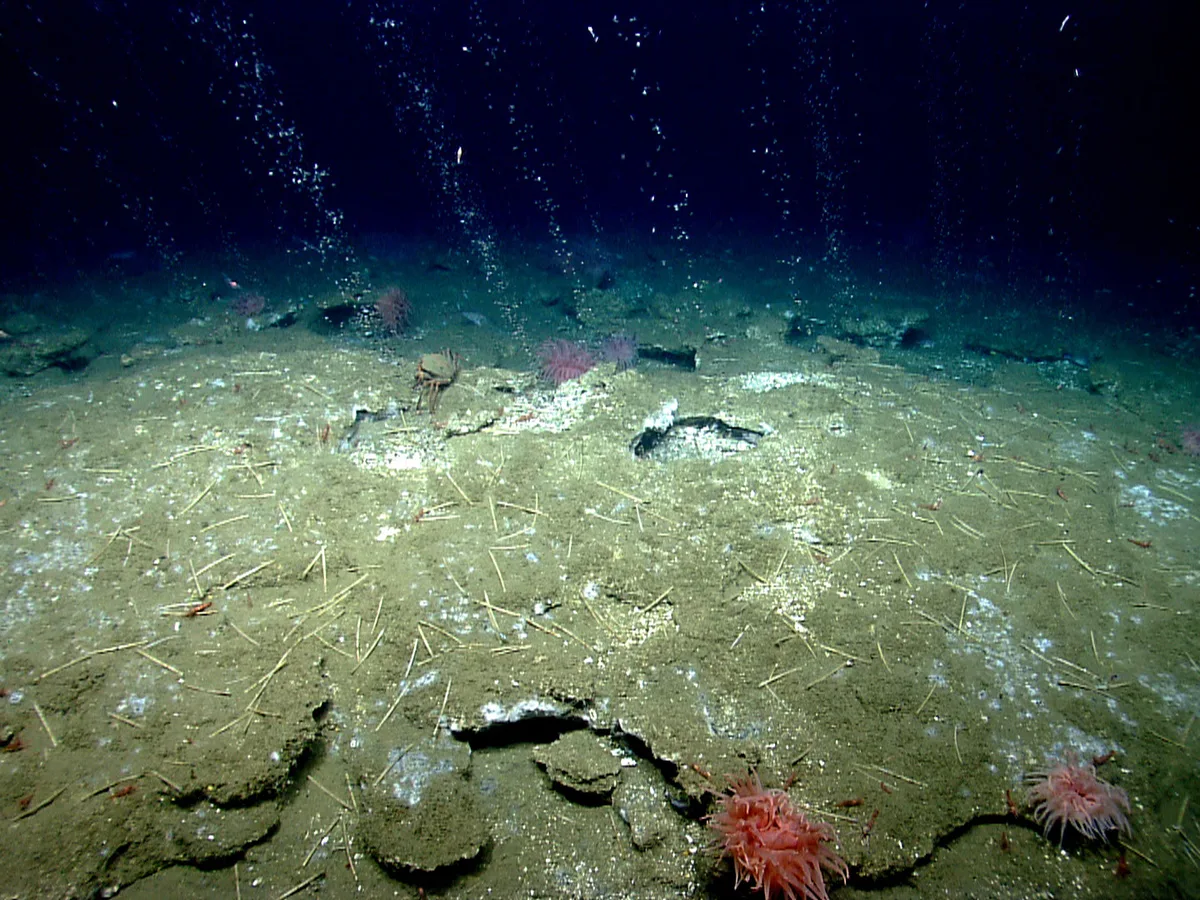
Evangelou and colleagues compiled 2,782 measurements of airborne microplastics from 76 studies at 283 locations (level P)2. In the published dataset we count no location on the African mainland, one in South America and 35 in the Southern Hemisphere (our calculation from3). The authors describe reported sizes from several micrometers to several millimeters and ask for measurements extended to smaller microplastics and nanoplastics2.
Where airborne microplastics have been measured
| label | value | unit | measurements |
|---|---|---|---|
| South and Southeast Asia (SAS) | 101 | locations | 501 |
| Europe (EUR) | 56 | locations | 652 |
| East Asia (EAS) | 46 | locations | 406 |
| North America (NAM) | 22 | locations | 751 |
| Antarctica and Southern Ocean (ANT) | 20 | locations | 42 |
| West and Central Asia (WAS) | 15 | locations | 324 |
| Australia and Pacific (AUS) | 13 | locations | 42 |
| Atlantic Ocean (ATL) | 9 | locations | 24 |
| South America (SAM) | 1 | locations | 40 |
| African mainland | 0 | locations | 0 |
Independent groups using different methods find particles in human tissue (level B). In April 2026 Li and colleagues reported micro- and nanoplastics in 99.4% of 156 brain samples from 113 patients with brain tumors and in all 35 samples from five healthy post-mortem donors, combining infrared imaging (LDIR, O-PTIR) with py-GC/MS and testing operating-room contamination62. A correction fixed figure rounding only78. Healthy tissue came from five people, and the link to tumor growth is a correlation.
How much plastic is there is disputed (level D). Nihart and colleagues reported brain concentrations by py-GC/MS, supported by infrared spectroscopy and electron microscopy with elemental analysis61. Critics argue that brain lipids can produce false polyethylene signals64. The authors' reply defends the data: per a 2026 summary, the lipid comparison mixes dry- and wet-weight percentages, polymers without known lipid interference rose too, and blanks held no detectable polymer; we could read only the reply's preview65,79.
In blood, Rauert and colleagues judged py-GC/MS currently unsuitable for PE and PVC, with extraction recoveries of 7–109%66. Nardella and colleagues detected plastic in all 102 blood samples but quantified it in only 20%74. Detection is not a validated dose. See Human Body.
The World Health Organization (WHO) found that most occurrence data for water, food and beverages concern particles larger than 10 µm, while most toxicity studies used uniform particles below 10 µm (level A)67.
A quality review of 105 aquatic effect studies found the same mismatch between tested and environmental sizes; no study met all 20 criteria, and environmental relevance of exposure was among the most urgent weaknesses34. WHO adds that hazard data after inhalation or ingestion were limited to polystyrene beads67.
Field measurements now exist, but they are narrow. In a French floodplain amended with compost for decades, Ryzhenko and colleagues measured polystyrene nanoplastics by matrix-matched py-GC/MS: 2.57 µg/g in the 200–1,000 nm fraction of the topsoil, about 28 times a reference plot, 123 µg/g in grass roots and 32 µg/g in shoots, the shoot value below the quantification limit (level C)49. That is one polymer at one site.
At a second compost-amended French field, an isotope estimate put the mobile fraction in soil water at about 0.25 µg/kg down to 55 cm, not the total in soil (level C)50.
Methods are the bottleneck: a polystyrene-specific py-GC/MS method has been tested with spiked soils and sediments56, while a particle-preserving extraction recovered 1.4% overall, too little for quantitative analysis4.
The first reason is size. Methods that identify polymers particle by particle rarely go below about 1 µm; below that, laboratories mostly use thermal methods that report polymer mass without particle size or count19. Method detail is in How We Measure It.
The second is comparability. When 12 laboratories analyzed the same sample bottles, their results differed widely, most for small particles (here, below 1 mm)37. A drinking-water interlaboratory study also found poorer recovery of small particles39.
The third is contamination. The North Atlantic team ran laboratory blanks and notes that whether clean rooms eliminate plastic contamination at the nanoscale is uncertain1.
The fourth is access. Human samples come from surgery, autopsy or blood draws, and WHO found too little information to assess how particles are taken up, retained and cleared67.
The size windows of current methods show the problem at a glance.
Which particle sizes current methods and rules cover
| label | value | unit | range_from | range_to | source |
|---|---|---|---|---|---|
| Nanoplastics (site convention) | 1 | µm | 0.001 | 1 | S-017 |
| North Atlantic nanoplastic study: fraction passing a 1.0 µm filter (lower size bound not stated) | 1 | µm | 1 | S-067 | |
| Soil nanoplastic extraction (Forsyth et al.): filtration below 1 µm | 1 | µm | 1 | S-288 | |
| California drinking-water monitoring, Phase II (planned, treated water): down to 5 µm | 5 | µm | 5 | 5000 | S-194 |
| EU drinking-water method: particles 20 µm–5 mm | 20 | µm | 20 | 5000 | S-132 |
| California drinking-water monitoring, Phase I (source water): reporting from 50 µm or the method minimum (20 µm by Raman) | 50 | µm | 20 | 5000 | S-194 |
| California definition of microplastics in drinking water | 5000 | µm | 0.001 | 5000 | S-194 |
| Microplastics: upper bound | 5000 | µm | S-017 |
The field is also young at the nano scale. In 2019 the European academies found no studies of atmospheric nanoplastic pollution and no analytical method for nanoplastics in soil8. Nanoplastics were then reported in Alpine snow in 2020 and 2021 and in polar ice in 20229,10,11. In soil, field measurement of nanoplastic mass is still rare; we read one quantification, from 202649, and one isotope estimate of the mobile fraction, from 202450.
Five steps would move the most findings.
Thompson and colleagues add that clear evidence on whether proposed solutions work is now needed21. The Lancet Countdown on health and plastics has begun an indicator-based monitoring system that could track some of these gaps over time80.
We searched PubMed on 3 November 2026 (publication years 2015–2026, English titles and abstracts), screened every title and read the abstracts of candidates that looked like field-scale evidence. Exact search strings are kept in the claims record of this page.
A missed study would change a grade; please send it.
Method
We regrade a finding when a peer-reviewed study, interlaboratory comparison, standard or agency assessment changes what is known; dated change notes are planned, and no regrades have been recorded yet. A finding moves up only with new independent data, not with a press release. You can propose a regrade, with a source, through Corrections & Contact. Last full review: 3 November 2026.
 Illustration
Editorial categories of this site. A–E grade scientific findings, per claim, with a one-line rationale; D and E are not lower rungs of the A–C scale. P is not a grade: it marks facts checked against their primary record.
AT THE BOUNDARY OF LIVING TISSUE
Studies report micro- and nanoplastics in human stool, blood, lungs, placentas, arteries and brains. How much is there is disputed, because some methods can mistake fats and glove residues for plastic. Lab studies find effects at the tested doses; human studies so far show associations, not causes.
Plastic particles have been reported in human stool, blood, lungs, placentas, artery plaque, livers and brains. How much is inside us is not settled. Since 2025, chemists have challenged the highest tissue values, arguing that fats and lab residues can mimic plastic. The original authors acknowledge method uncertainties but stand by their findings. Even intake is uncertain: the two best-known weekly estimates differ about a millionfold1,2. We found no study that establishes that these particles cause disease in people.
≈1,000,000×
gap between two published weekly intake estimates
4.1 µg/week (Mohamed Nor et al. 2021, model, particles 1–5,000 µm) vs up to 5 g/week (Senathirajah et al. 2021, literature conversion, 0–1 mm); ratio is our calculation1,2
both are estimates, not measurements
DDisputed1.6 µg/mL
mean plastic in blood, first quantification
mean over all 22 Dutch donors (values below the quantification limit set to zero; quantifiable in 17), double-shot py-GC/MS, particles ≥700 nm, published 20223,4,5
PE and PVC quantification by py-GC/MS in blood contested since 2025; the same group's 2025 method did not detect PE in 102 samples (detection limit 245 ng/mL)
DDisputed4,917 µg/g
median reported in 2024 frontal-cortex samples
24 New Mexico decedents who died October 2023 to January 2024, py-GC/MS after KOH digestion, Nihart et al. 20256,7,8
challenged in a Matters Arising; a 2026 study with lipid removal reported a median of 50.3 µg/g in five healthy brains (publisher's source-data file)
DDisputed4.53
hazard ratio, heart attack, stroke or death
257 of 304 enrolled carotid-surgery patients, Italy, about 34 months; polyethylene detected in plaque vs not9
observational association, not a cause
CLimited≈2,000 per mm²
false 'microplastics' left by dry glove contact
nitrile and latex lab gloves, IR and Raman library matching, environmental samples, University of Michigan, 202610
cleanroom nitrile gloves left about 100 per mm²
CLimitedSwallowing and breathing are the two main routes: food and drinks reach the gut, and indoor air carries the smallest particles into the lungs1,11. Uptake through intact skin has not been demonstrated in living people; the studies we found use cells, skin models or sweat chemistry (level E; dated search record12).
The size of the dose is where estimates part ways. Mohamed Nor and colleagues modeled intake from eight food types and air. Their adult median is about 583 ng per day, roughly 4.1 µg per week (our calculation)1. Senathirajah and colleagues converted particle counts from 59 publications into mass and estimated 0.1–5 g per week. That is the peer-reviewed version of the "credit card a week" figure from a 2019 WWF report (level D)2,13.
Both are estimates; most of the gap comes from converting counts into grams, which depends on assumed size and density (our reading)2.
Weekly intake estimates for one adult, log scale
| label | value | unit | level | source |
|---|---|---|---|---|
| Mohamed Nor et al. 2021, adult median (model, 1–5,000 µm) | 0.0041 | mg/week | C | S-103 |
| Senathirajah et al. 2021, low end (literature conversion, 0–1 mm) | 100 | mg/week | D | S-104 |
| Senathirajah et al. 2021, high end ('credit card') | 5000 | mg/week | D | S-104 |
Counts describe some exposures better. Polypropylene infant bottles released up to 16.2 million particles per liter in lab tests, more after sterilization and with hot water. From that, Li and colleagues estimated 14,600 to 4.55 million particles per infant per day across 48 regions, a scenario estimate (level C)14.
In Toulouse homes and cars, median air concentrations of 1–10 µm particles were 528 and 2,238 per cubic meter. With published data, the authors estimated about 68,000 inhaled particles of that size per adult per day (level C)15.
Bottled water is the disputed case. Qian and colleagues imaged about 240,000 particles per liter, about 90% below 1 µm, in three brands16. Materić argued that the sample values fall below the procedural blank17; the authors replied that his proposed blank is itself contaminated (level D)18.
Particle-by-particle methods inspect each particle's spectrum and find microplastics a few micrometers and larger. Bulk methods such as pyrolysis gas chromatography with mass spectrometry (py-GC/MS) burn a digested sample and report polymer mass, without particle size; How We Measure It explains both. Each finding below gives sample size, method and size scope: the method's limit, or only the range of particles found.
In the gut, Schwabl and colleagues found microplastics of 50–500 µm in the stool of all 8 volunteers in 2019, a median of 20 per 10 g (level C)19. In the lungs, Jenner and colleagues found 39 particles in 11 of 13 surgical samples (µFTIR, 3 µm limit). Blank correction halved the count per gram (level C)20. Microplastics of 5.5–26.4 µm were found in the olfactory bulb of 8 of 15 São Paulo decedents (level C)21.
In 4 of 6 Italian placentas, Ragusa and colleagues found 12 pigmented fragments of 5–10 µm; only 3 were identified as a polymer (level C)22. At least four independent groups using single-particle spectroscopy report microplastics in stool, lung, placenta and olfactory bulb. Presence in the body is well supported (level B), but each tissue rests on one or two small studies19,20,21,22.
For mass figures, Leslie and colleagues reported a mean of 1.6 µg/mL across 22 Dutch blood donors, quantifiable in 173. Garcia and colleagues reported 6.5–685 µg/g in 62 placentas, 54% of it polyethylene (PE)23; Hu and colleagues, 328 µg/g in 23 testes24. Nihart and colleagues reported a median of 4,917 µg/g in the frontal cortex of 24 New Mexico decedents who died in 2023–20246.
Samples from different people who died in 2016 gave 3,345 µg/g, a cross-sectional comparison, not accumulation within people, and 12 dementia cases 26,076 µg/g; a later lipid-removal step reduced the dementia values, the supplement notes6. All these figures rest on py-GC/MS, and most on PE as a main polymer, which places them at the center of the dispute below (level D).
Where plastic particles have been reported in the human body
| label | value | unit | study | method | size_limit | level | source | n |
|---|---|---|---|---|---|---|---|---|
| route: breathing | inhaled particles reach lung tissue | Jenner et al. 2022; Yakovenko et al. 2025 | µFTIR; Raman air sampling | ≥3 µm (lung); 1–10 µm (air) | C | S-090, S-063 | ||
| route: eating and drinking | particles in stool | Schwabl et al. 2019 | µFTIR | 50–500 µm found | C | S-098 | ||
| route: skin | not demonstrated in people | site search, 3 November 2026 | Europe PMC search | not applicable | E | S-299 | ||
| stool | 8 of 8 participants | Schwabl et al. 2019 | µFTIR | 50–500 µm found (range of particles reported) | C | S-098 | 8 volunteers, Europe and Asia, 2019 | |
| lung tissue | 11 of 13 samples | Jenner et al. 2022 | µFTIR | ≥3 µm (method limit) | C | S-090 | 13 surgical samples, Hull, UK, 2022 | |
| placenta (particles) | 4 of 6 placentas | Ragusa et al. 2021 | Raman | 5–10 µm found; method limit not reported | C | S-088 | 6 placentas, Italy, 2021 | |
| placenta (mass) | 126.8 µg/g mean | Garcia et al. 2024 | py-GC/MS after saponification and ultracentrifugation | no size cutoff defined | D | S-089, S-042 | 62 placentas, USA, 2024 | |
| blood (mass) | 1.6 µg/mL mean across 22 donors; quantifiable in 17 | Leslie et al. 2022 | double-shot py-GC/MS | ≥700 nm (method scope) | D | S-087, S-042 | 22 donors, Netherlands, 2022 | |
| blood (mass, refined method) | 20% of samples above LOQ; 386 ng/mL mean of those; PE not detected | Nardella et al. 2025 | full-scan py-GC/MS | no size cutoff defined | C | S-043 | 102 samples, Netherlands, 2025 | |
| carotid plaque | PE in 150 of 257 patients, mean 21.7 ± 24.5 µg per mg plaque | Marfella et al. 2024 | py-GC/MS, stable isotopes, electron microscopy | not reported | D | S-093, S-094 | 257 of 304 enrolled, Italy, 2024 | |
| coronary blood | detected in 84% of STEMI, 40% of stable disease, 32% of normal arteries | Paolisso et al. 2026 | py-GC/MS, laser direct infrared (LDIR) | not reported in the abstract | C | S-296, S-297 | 61 patients, Italy, 2026 | |
| olfactory bulb | 8 of 15 decedents | Amato-Lourenço et al. 2024 | µFTIR | 5.5–26.4 µm found (range of particles reported) | C | S-091 | 15 autopsies, São Paulo, 2024 | |
| brain, frontal cortex (mass) | 4,917 µg/g median | Nihart et al. 2025 | py-GC/MS after KOH digestion, ATR-FTIR, electron microscopy | no size cutoff defined; shards mostly 100–200 nm seen by TEM | D | S-092, S-045, S-046, S-258 | 24 decedents, New Mexico, died 2023–2024 | |
| brain, healthy (mass) | 50.3 µg/g median | Li et al. 2026 | py-GC/MS after hot-ethanol lipid removal; LDIR particle counts | LDIR 20–500 µm; py-GC/MS no size cutoff | C | S-267, S-268 | 23 samples from 5 donors, Beijing, died 2024; plus 156 samples from 113 tumor patients | |
| liver (cirrhotic) | 6 patients positive, 5 controls negative | Horvatits et al. 2022 | Nile red, Raman | 4–30 µm (method range) | C | S-096 | 11 people, Germany, 2022 | |
| testis (mass) | 328 µg/g mean | Hu et al. 2024 | py-GC/MS | not reported | D | S-095, S-042 | 23 men, USA, 2024 | |
| ovarian follicular fluid | 14 of 18 women | Montano et al. 2025 | SEM-EDX | <10 µm measured | C | S-097 | 18 women, Salerno, Italy, 2025 |
Limitation
Detection is not harm, and most of these methods cannot see nanoplastics. Spectroscopy-based studies stop at about 3 µm (µFTIR) to 20 µm (LDIR); py-GC/MS reports mass but not particle size. The brain and carotid-plaque studies added electron microscopy of small particles, but their mass figures are the disputed ones.
The dispute is about false positives, not about whether plastic can enter the body. Rauert and colleagues found that, in human blood, fats and other compounds yield breakdown products that interfere with py-GC/MS signals for PE and polyvinyl chloride (PVC)4. Blood also suppressed signals: a reliable reading of polyethylene terephthalate (PET) needed 65 times the blank-based limit4. Their conclusion: the technique is "currently not a suitable analysis method for PE and PVC in biological matrices"4.
Brain tissue is fat-rich, which is why critics focus on it7. Glove residue is a second error: disposable gloves shed stearates that µ-Raman, µ-FTIR and py-GC/MS all misread as PE33. A 2026 University of Michigan study counted about 2,000 false particles per mm² after dry glove contact10. Two independent groups now report this glove artifact (level B)33,10.
On 13 November 2025, Monikh, Materić and colleagues published a Matters Arising on the brain study. They cite limited contamination controls and missing validation steps that "may affect the reliability of the reported concentrations"7.
Campen and coauthors replied in the same issue, acknowledging "the uncertainties in even the best current methods" and addressing the digestion method, possible interference from phospholipids and quality-control steps (level P)28. A 2026 paper summarizes their arguments: the lipid comparison mixes dry- and wet-weight percentages, polymers without known lipid interference rose too, and blanks held no detectable polymer34.
In September 2026 Campen said an added wash step gave results that "corroborate our initial findings"; no revised numbers had been published by then35. An author correction of 31 March 2025 had fixed duplicated supplementary images and scale bars; it changed no concentration (level P)29.
In April 2026, Li and colleagues in Beijing removed fats with hot ethanol before py-GC/MS, tested operating-room air and materials as blanks, and counted 20–500 µm particles by LDIR8. In 23 samples from five healthy donors' brains, the py-GC/MS median was 50.3 µg/g, about one hundredth of Nihart's 2024 median (level C; source data, our comparison)8.
A reviewer of that paper noted the hundredfold gap and asked whether its nitric acid digestion could damage PE and lower the result8. A correction of 24 April 2026 fixed rounding in figures only (level P)30. For carotid plaque, NEJM letters questioned operating-room contamination and the missing operating-room blanks25.
The Amsterdam blood group refined its method, using full-scan py-GC/MS on 102 samples. Plastic was detected in all, but only 20% had a polymer above the quantification limit; those averaged 386 ng/mL. PE was not detected, with a detection limit of 245 ng/mL (level C)5.
In January 2026 The Guardian counted seven challenged human-tissue studies, with "no suggestion of malpractice"; its analysis of 18 studies is the Rauert paper (level P)36,4. Spectroscopy with blanks, as in the lung study, is less exposed to the lipid problem, though not to glove residue (our reading). Tissue mass figures for brain, testis, placenta and blood remain disputed (level D)4,7,28,8.
Animal studies find effects at the tested doses. Kopatz and colleagues gave mice one oral dose of polystyrene (PS) spheres, 0.3 mg of each of three sizes. Particles of 293 nm, but not the larger ones, appeared in the brain within 2 hours (level C)37.
Huang and colleagues injected 100 µg of 5 µm fluorescent PS spheres once into the bloodstream of mice, aiming at about 50 µg/mL. Immune cells took them up and blocked brain capillaries, reducing blood flow and movement until recovery by day 28 (level C)38. Blockages appeared even at the lowest tested level, 5 µg/mL. The authors cite 12 µg/mL as a human blood value; such values are disputed, so this is no safety margin (our reading)38.
A 2024 rapid systematic review of 3 human and 28 animal studies, mostly in rodents, rated microplastics as "suspected" to harm sperm quality, gut immunity and lung function (level B)39. Both mouse studies used smooth PS spheres, while human samples mostly contain irregular fragments and fibers of polypropylene (PP), PET and PE19,20,6.
Additive chemicals are a separate hazard, outside this page; the 2025 Lancet Countdown on health and plastics set up indicators to track plastics' health harms across their life cycle40.
The strongest human signal comes from one prospective observational study. Marfella and colleagues enrolled 304 patients having surgery to remove carotid plaque, and 257 completed follow-up9. PE was detected in the plaque of 150 of them (58.4%), at a mean of 21.7 ± 24.5 µg per milligram of plaque. Over about 34 months these patients had a higher rate of heart attack, stroke or death: hazard ratio 4.53, 95% confidence interval 2.00–10.27 (level C)9.
The authors' conclusion describes a higher risk, not a cause9. In 2026 Paolisso and colleagues measured plastic in coronary and peripheral blood of 61 Italian patients by py-GC/MS and LDIR. It was detected in 84% of 19 with an acute heart attack (STEMI), 40% of 20 with stable coronary disease and 32% of 22 with normal arteries; PE predominated (level C)26.
That study is a snapshot with no follow-up, and not an independent replication: it shares senior authors with Marfella (author lists)26,9. Smoking was the only independent predictor of detectable plastic, odds ratio 5.69 (95% CI 1.33–26.63)26. A letter asked whether coronary plastic reflects earlier exposure or enrichment after the clot formed; the authors replied (level P)27,41.
An observational study shows that two things occur together. It cannot exclude a third factor such as smoking, diet or income, or reverse explanations, such as diseased tissue retaining more particles. Nihart and colleagues say so themselves: atrophy and a weaker blood–brain barrier in dementia could raise particle levels, so "no causality is assumed" (level P)6.
What an observational study can and cannot show
| label | value | unit | source |
|---|---|---|---|
| can show | plastic detected in plaque and heart attack, stroke or death occur together: hazard ratio 4.53 (95% CI 2.00–10.27), 257 patients, Marfella 2024 | S-093 | |
| cannot show alone | that plastic caused the outcome | S-093 | |
| alternative 1 | a third factor (smoking, diet, income) raises both exposure and risk; smoking predicted coronary plastic in a 2026 study | S-094, S-296 | |
| alternative 2 | disease changes tissue so it retains more particles (reverse direction) | S-092, S-297 | |
| alternative 3 | contamination or false positives create apparent exposure | S-094 |
Limitation
We found no human study that establishes that micro- or nanoplastics cause a disease (level E; dated search record12). That is a gap in evidence, not evidence of safety. WHO wrote in 2019 that firm conclusions on risk from drinking water "cannot yet be determined", although no data suggested overt health concerns from that route. Reviewing food and air exposure in 2022, it judged the available data "of only very limited use for assessing the risk" (level P)42,11.
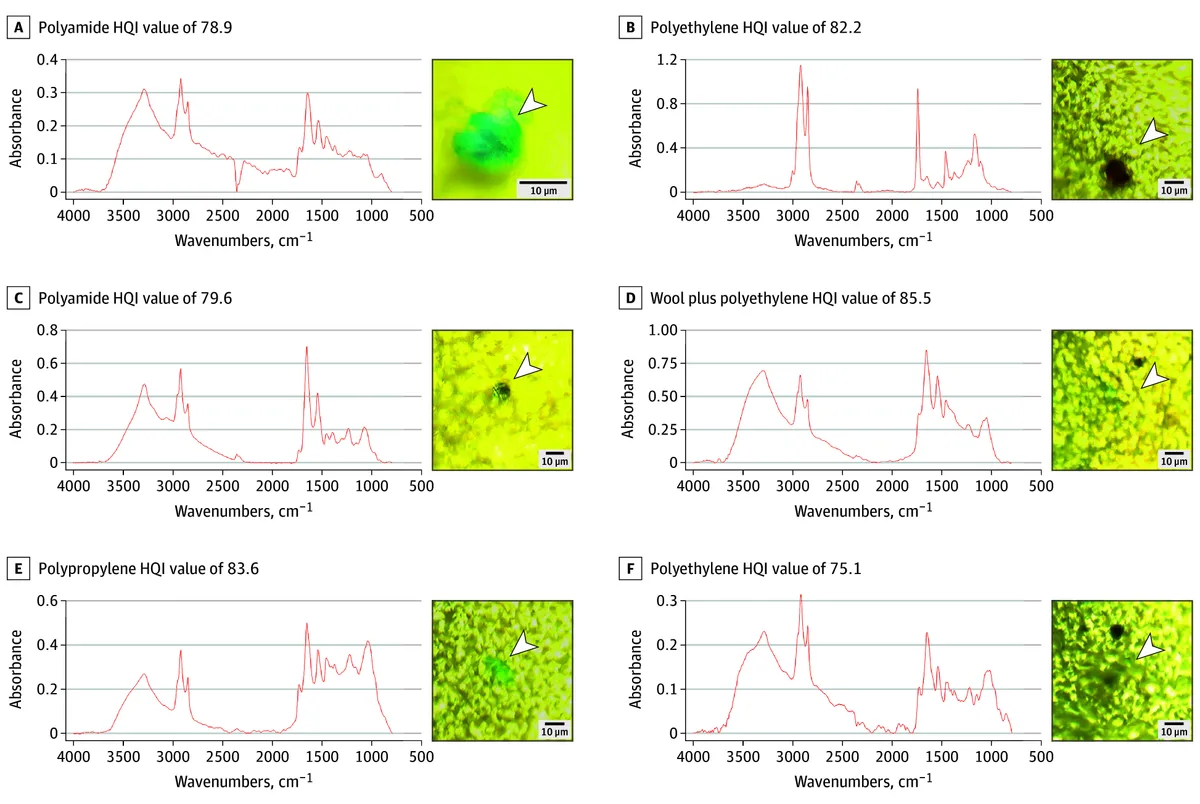
Thomas and colleagues propose confidence levels for reported plastic in humans, requiring at least two orthogonal techniques, procedural blanks and shared raw data (level P)43; the proposal is untested. Interlaboratory comparisons on the same tissue samples, with known spiked amounts, would show which numbers survive. Recovery tests matter too: one blood method recovered 7–109% of spiked plastic, and realistic detection limits were up to 20 times those in clean water4.
The health question needs cohorts that measure plastic in body samples from people without the disease, then record new heart attacks, strokes or diagnoses and confounders. The prospective studies we found, such as Marfella's, enrolled patients who already had arterial disease9. We found no completed cohort of disease-free people with measured exposure and new clinical events (level E; dated search record12).
Open questions are tracked on Knowledge Gaps.
 Illustration
Possibly some, but the amount is disputed. One 2025 study reported milligram-per-gram levels in frontal cortex by py-GC/MS; critics argue that brain fats can mimic polyethylene, and the authors acknowledge method uncertainties while standing by their findings (level D,6,7,28). A 2026 study that removed fats first reported about one hundredth of that level in five healthy brains (level C,8). Headlines about "a spoonful of plastic in the brain" extrapolate from the disputed number. Spectroscopy found a few microplastic particles in the olfactory bulb of 8 of 15 people (level C,21).
That is not established. One study found a higher rate of heart attack, stroke or death in patients with plastic detected in artery plaque, an association that does not prove cause (level C,9). A 2026 snapshot study found plastic more often in the coronary blood of heart-attack patients, but smoking predicted detection and the design cannot show cause (level C,26). Higher brain values in dementia could follow from the disease (level C,6).
Methods differ in what they see: spectroscopy counts particles above a few micrometers, while py-GC/MS reports total mass and can be inflated by fats or glove residues (level B,4,33). Blanks, recovery and digestion steps also vary between labs (43). Brain medians from two labs differ about a hundredfold (level D,6,8).
WHO's 2019 drinking-water report found no data suggesting overt health concerns but said firm conclusions on risk could not yet be drawn; its 2022 report judged data on food and air exposure of only very limited use for risk assessment (level P,42,11). Both statements describe missing data; neither shows that exposure is safe.
Instruments and their limits are on How We Measure It, size classes on What Is Nanoplastic and study summaries on Landmark Studies. Practical steps are on What You Can Do, blood-cleaning trials on Solutions by System.
Editorial categories of this site. A–E grade scientific findings, per claim, with a one-line rationale; D and E are not lower rungs of the A–C scale. P is not a grade: it marks facts checked against their primary record.
FOURTEEN ORDERS OF MAGNITUDE
A 22-second animated descent from the whole Earth to a particle 100 nm across, in six stops. Each stop gets one real reference size, from the planet's 12,742 km diameter to a cell membrane a few nanometers thick. The frames are illustrations of scale, not microscope images.
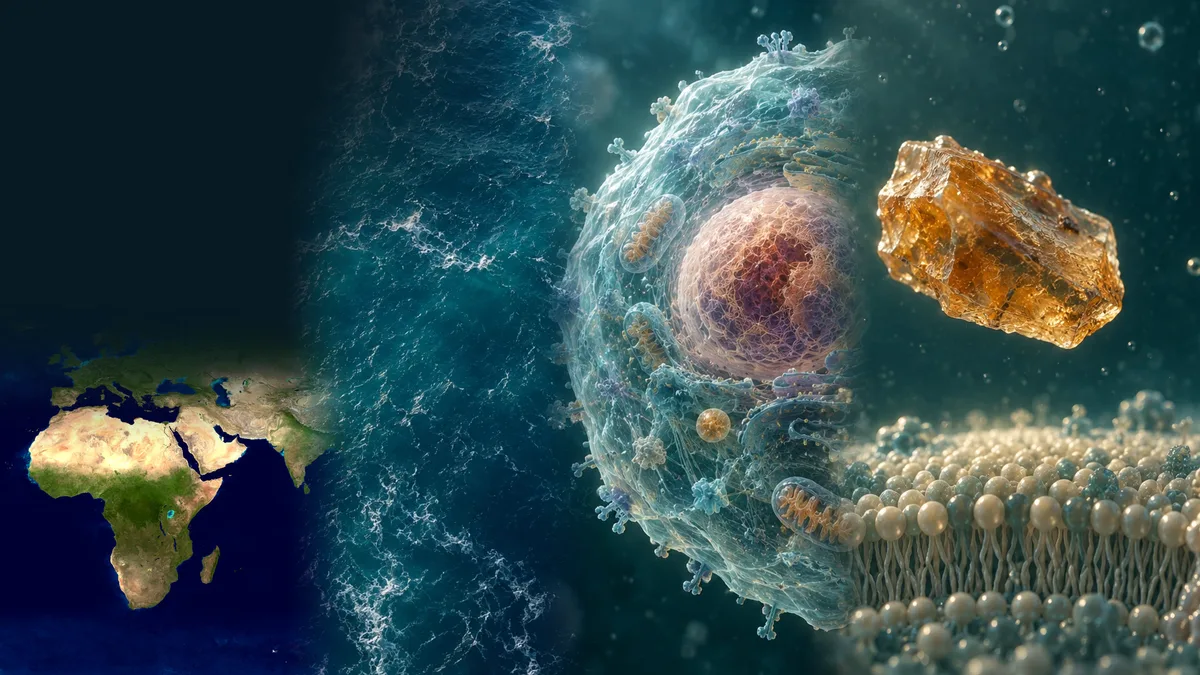 Illustration
"From planet to cell" opens from the rotating Earth on the home page and runs for just under 22 seconds at normal speed. It stops six times: the planet, the atmosphere, the water just below the surface, a millimeter of seawater, a cell and one particle 100 nm across. The journey can be paused, scrubbed or jumped stop by stop.
The scale bar falls from 10,000 km to 100 nm, a span of 14 orders of magnitude (level P; our calculation: ten million meters to one ten-millionth of a meter). The last particle is smaller than the shortest wavelength the human eye detects, 380 nm1. A conventional light microscope cannot resolve its shape, because Abbe's limit for such instruments is about 0.2 µm2.
14
orders of magnitude from the first to the last stop
journey scale bar, 10,000 km to 100 nm (10⁷ m to 10⁻⁷ m); our calculation3
P: arithmetic on the fixed chapter scales, not a scientific finding; Earth's 12,742 km diameter gives the same order
PProvenance≈12,742 km
Earth's mean diameter
twice NASA's volumetric mean radius of 6,371 km (doubling is our calculation)3
A: official NASA planetary reference value
AConsensus≈0.2 µm
resolution limit of a conventional light microscope
Abbe's diffraction limit, about half the wavelength of light; super-resolution fluorescence methods bypass it for labeled molecules2
A: textbook optics, stated by the Nobel committee; a smaller particle can still show up as a blur, but its shape is not resolved
AConsensusEach stop is a power of ten. One real object anchors each one, and the factor to the next stop shows how far the camera moves.
From planet to cell: six stops and reference sizes on one logarithmic ruler
| label | value | unit | kind | source | note |
|---|---|---|---|---|---|
| Stop 1 · Planet (journey scale) | 10000000 | m | stop | site-original | editorial stop fixed by the journey code |
| Earth, mean diameter | 12742000 | m | reference | S-300 | |
| Ocean, average depth | 3682 | m | reference | S-301 | |
| Low clouds, base up to about 2 km | 2000 | m | reference | S-306 | mid-latitudes; draw as a band from the surface to 2.0e3 |
| Stop 2 · Atmosphere (journey scale) | 1000 | m | stop | site-original | editorial stop fixed by the journey code |
| Sunlit (euphotic) zone, lower edge | 200 | m | reference | S-302 | |
| Stop 3 · Water (journey scale) | 1 | m | stop | site-original | editorial stop fixed by the journey code |
| Stop 4 · Microworld (journey scale) | 0.001 | m | stop | site-original | editorial stop fixed by the journey code |
| Human hair, average diameter | 0.00007 | m | reference | S-231 | |
| Cloud droplet, typical diameter | 0.00002 | m | reference | S-303 | |
| Stop 5 · Cell (journey scale) | 0.00001 | m | stop | site-original | editorial stop fixed by the journey code |
| Red blood cell, diameter 7–8 µm | 0.0000075 | m | reference | S-222 | |
| E. coli, length | 0.000002 | m | reference | S-222 | |
| Visible light, 380–700 nm | 5.4e-7 | m | reference | S-304 | draw as a band from 3.8e-7 to 7.0e-7 |
| Light microscope limit (Abbe) | 2e-7 | m | reference | S-305 | |
| Stop 6 · Nanoparticle (journey scale) | 1e-7 | m | stop | site-original | editorial stop fixed by the journey code |
| Cell membrane, 4–10 nm | 4e-9 | m | reference | S-222 | draw as a band from 4e-9 to 1.0e-8 |
The opening Earth is the NASA Blue Marble globe; the ocean, cell and particle frames are AI illustrations, not photographs or microscope images. The camera path is one continuous illustrative move; no single particle was tracked from sea to cell.
The final frame is not drawn to scale: a real 100 nm particle would be 10 to 25 times thicker than the membrane, not a few times. Nor is it evidence that particles enter cells; what is known about uptake is on Human Body. Size classes are on What Is Nanoplastic, detection on How We Measure It, the panels on Four Microworlds.
 Illustration
 Illustration
 Illustration
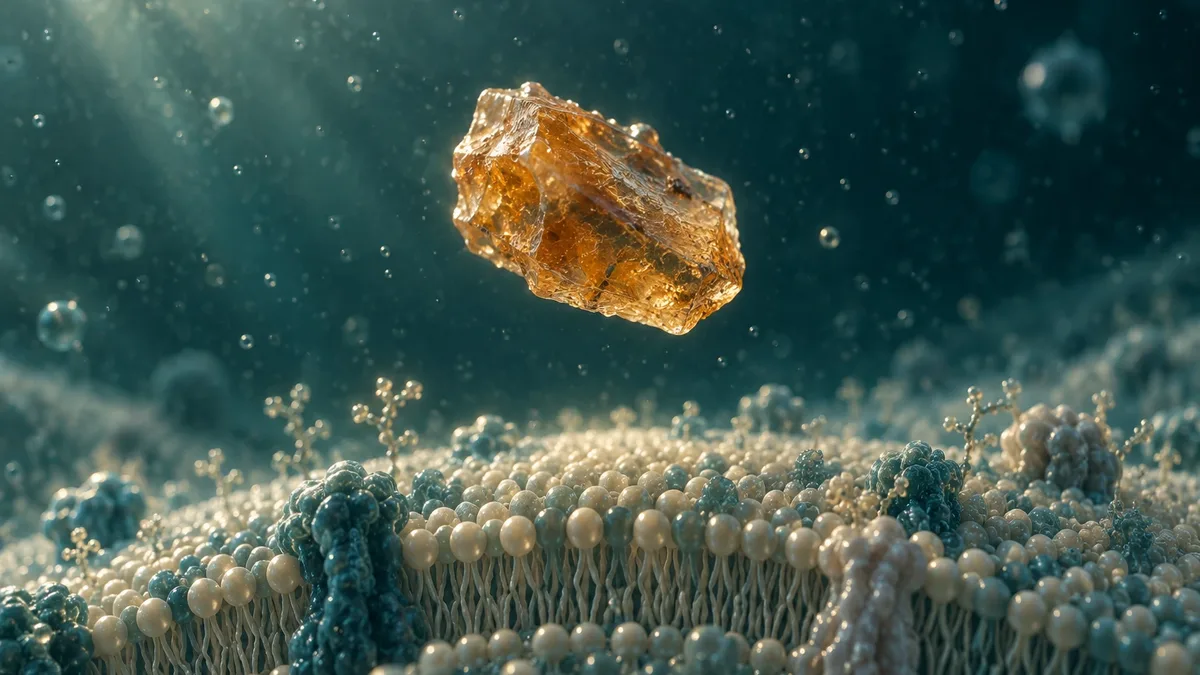 Illustration
Editorial categories of this site. A–E grade scientific findings, per claim, with a one-line rationale; D and E are not lower rungs of the A–C scale. P is not a grade: it marks facts checked against their primary record.
21 LANDMARKS, 2004 TO 2026
Twenty-one entries, covering 22 studies from 2004 to 2026, that named microplastics, put numbers on them and followed them into the human body and down to the nanoscale. Each card says what later work confirmed or disputed and how well the key finding holds in November 2026.
Some of the most quoted numbers about microplastics no longer stand as first published. Two 2021 estimates of weekly plastic intake, 0.1–5 g and about 4.1 µg, differ by a factor of about 24,000 to 1.2 million (our calculation) and cover different particle sizes1,2. The blood and brain concentrations behind 2022 and 2025 headlines are disputed on method3,4. That microscopic plastic is widespread at sea has held for two decades5,6.
A study is a landmark here if it changed what a field studied, created a method others adopted, set a number still quoted, or triggered a correction. We did not rank by citation counts. The page has 21 entries covering 22 studies, because one card pairs the two weekly-intake estimates.
The list is balanced across air, water, soil and the human body; soil is thinnest because field studies remain scarce. Disputed work is included on purpose, with both sides shown.
Each card gives what was measured, where, sample size, the main number, later changes and the main limitation. The level grades the key finding as of 3 November 2026, not the study's importance: A consensus, B well supported, C limited, D disputed (Evidence Levels). See also How We Measure It and Evidence by System.
The first decade was about seeing the problem: picking particles out of sediment and seawater, confirming them as plastic by infrared spectroscopy, and counting them.
Thompson and colleagues examined sediments at six sites around Plymouth, UK, and on 17 more British beaches, plus North Atlantic plankton samples archived since the 1960s. Infrared spectroscopy identified nylon, polyester and other polymers; the archive showed a significant increase. In tanks, amphipods, lugworms and barnacles ingested the particles. A 2024 review says the term was first applied to microscopic plastic debris here6. The core finding, microscopic plastic widespread at sea, is now consistently found worldwide. Limitation: UK shores and two plankton routes, counts not mass, smallest particles unidentifiable.
Read the study ↗Browne and colleagues found microplastic (here, below 1 mm) on shorelines at 18 sites on six continents, with more near dense populations. Polyester and acrylic fibers occurred in proportions resembling sewage effluent, and a single garment shed more than 1,900 fibers per wash. Later laboratory work found over 700,000 fibers from a 6 kg acrylic load26; per-wash numbers vary with fabric and conditions. Limitation: counts only, and the sewage link was inferred from polymer proportions, not traced.
Read the study ↗Eriksen and colleagues combined 680 net tows and 891 visual transects from 24 expeditions (2007–2013) with a dispersal model. They estimated at least 5.25 trillion floating particles weighing 268,940 metric tons, with far fewer small particles than fragmentation predicts. In 2023, pooling 11,777 stations, the same lead author's team estimated about 82–358 trillion particles weighing 1.1–4.9 million metric tons (Mt)27. We grade the numbers C, each being one modeled estimate; widespread floating plastic is not in doubt. Limitation: surface only, nets miss particles below 0.33 mm.
Read the study ↗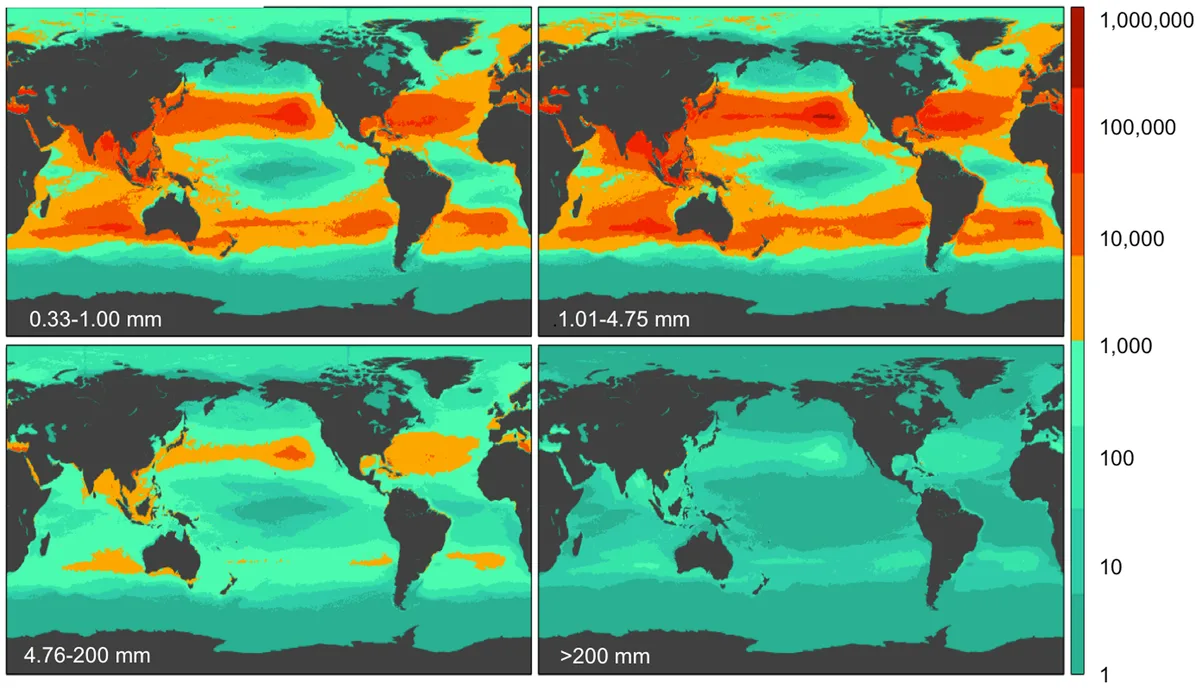
With presence at sea settled, the questions turned to budgets and pathways: how much is made, how much escapes, and whether it travels by river, sludge or wind. Most answers are estimates, and later work revised several.
Jambeck and colleagues linked waste, population and management data for 192 coastal countries. They estimated 275 Mt of plastic waste generated there in 2010, with 4.8–12.7 Mt entering the ocean. Later models changed the scope: 19–23 Mt into all aquatic ecosystems in 201628, and 0.8–2.7 Mt per year from more than 1,000 rivers29. Limitation: an estimate resting on assumed shares of mismanaged waste reaching the sea, with no measured flux.
Read the study ↗In a viewpoint, Nizzetto, Futter and Langaas combined sludge volumes, the share spread on farmland, and microplastic contents of sludge. They estimated that 63,000–430,000 metric tons of microplastics reach European farmland each year, and 44,000–300,000 metric tons North American farmland. Each range exceeds the 93,000–236,000 metric tons then estimated afloat in the oceans. It put soil on the research agenda. Limitation: a theoretical estimate, not checked against measured soil stocks.
Read the study ↗Geyer, Jambeck and Law compiled production, use and end-of-life data for resins, fibers and additives. By 2015, they estimated, 8,300 Mt of virgin plastic had been made and 6,300 Mt had become waste: about 9% recycled, 12% incinerated and 79% landfilled or left in the environment. The OECD's 2022 model again put recycling at 9%, with 460 Mt produced in 201930. Limitation: global mass-balance estimates from industry statistics, not tracked flows.
Read the study ↗Allen and colleagues collected five months of deposition in winter 2017–2018 at the Bernadouze station, 1,425 m up in the French Pyrenees. They counted an average of 365 particles per square meter per day, mostly fragments, from source areas up to 95 km away. The atmosphere became a transport route in its own right; a 2026 compilation holds 2,782 measurements24. The Author Correction only added acknowledgements and fixed a reference. Limitation: one site, one season, counts without mass.
Read the study ↗Brahney and colleagues sampled deposition at 11 sites in national parks and wilderness areas of the western United States. It averaged 132 particles per square meter per day, scaled to more than 1,000 metric tons per year on the region's protected lands. Wet deposition tracked nearby cities; dry deposition came from farther away. Limitation: the tonnage is an extrapolation from counts, and a global emission estimate later built on western US data31 fed models that overestimate measured air concentrations24.
Read the study ↗Li and colleagues exposed wheat and lettuce to fluorescent polystyrene (PS) beads of 0.2 µm and 2 µm, and to polymethylmethacrylate particles, in hydroponic culture, sand and sandy soil. Particles entered roots through cracks where lateral roots emerge, reached the vascular core and moved up to stems and leaves. Limitation: pristine spherical beads in the laboratory; uptake of weathered particles in working fields is not established.
Read the study ↗From 2019, groups looked for plastic in stool, placenta, blood, arteries and brain. Early studies counted particles by spectroscopy in a handful of samples; later ones reported mass by pyrolysis, the method now at the center of the dispute (see Human Body). Detection is reported consistently; the amounts are disputed, and no study here shows that plastic causes disease.
Schwabl and colleagues collected one stool sample each from eight healthy volunteers in Europe and Asia. Infrared microspectroscopy found microplastics in all eight: a median of 20 particles per 10 g, 50–500 µm across, nine polymer types, mostly polypropylene (PP) and polyethylene terephthalate (PET). It was the first published detection in human stool. Limitation: eight people, one sample each, only particles of 50 µm and larger.
Read the study ↗Ragusa and colleagues found 12 pigmented particles of 5–10 µm in four of six placentas by Raman microspectroscopy, on fetal and maternal sides. Three were polypropylene; for nine, only the pigments could be identified. A 2024 study using pyrolysis gas chromatography–mass spectrometry (py-GC/MS) reported plastic in all 62 placentas tested, mean 126.8 µg/g, mostly polyethylene32; in blood, that method gives false polyethylene signals3. Limitation: six samples, and most identifications rest on pigments, not polymers.
Read the study ↗Two 2021 intake estimates differ by a factor of about 24,000 to 1.2 million (our calculation). Senathirajah and colleagues combined particle counts from 59 publications, for particles up to 1 mm, with average particle masses: 0.1–5 g per person per week. The upper end became WWF's 2019 "credit card a week"33. Mohamed Nor and colleagues modeled eight foods and inhalation for particles of 1–5,000 µm: median adult intake 583 ng per day, about 4.1 µg per week (our calculation)2. Pletz argues the 5 g figure is orders of magnitude too high because sizes and masses were combined wrongly34. Limitation: both are estimates with different size windows.
Read the study ↗Leslie and colleagues applied double-shot py-GC/MS, for particles of 700 nm and larger, to whole blood from 22 healthy donors in the Netherlands. Plastic was quantifiable in 17, mostly PET, styrene polymers and polyethylene (PVC was not targeted), with a mean summed concentration of 1.6 µg/mL, the first mass of plastic reported in blood. Rauert and colleagues later found that blood lipids create false polyethylene signals and matrix suppression makes PET unreliable3. A 2025 follow-up by overlapping authors, with a changed workflow, detected plastic in all 102 samples but quantified it in only 20%, averaging 386 ng/mL35. Limitation: 22 donors, nothing below 700 nm.
Read the study ↗Marfella and colleagues analyzed carotid plaque from 304 surgical patients by py-GC/MS, with supporting electron microscopy and carbon-isotope analysis, and followed 257 for a mean of 34 months. Polyethylene was detected in 150 of the 257 (58%) and PVC in 31. Those with detectable plastic had a higher risk of heart attack, stroke or death (hazard ratio 4.53; 95% CI 2.00–10.27). Hołda and Batko's letter notes no anti-contamination steps beyond glass tubes and no operating-room blanks; the authors' reply was inaccessible to us36. The paper says contamination "cannot be firmly ruled out". Limitation: one cohort, residual confounding, an association.
Read the study ↗Nihart and colleagues analyzed liver, kidney and frontal cortex from New Mexico decedents who died in 2016 or 2024 (20–28 per year group), plus 12 brains from people with dementia. By py-GC/MS, median brain concentration was 4,917 µg/g in 2024 against 3,345 µg/g in 2016, mostly polyethylene, and highest with dementia. These are different people at each date, not accumulation within people, and the authors assume no causal role in dementia. A Matters Arising argues that limited contamination controls, missing validation and incomplete digestion of lipid-rich brain may have inflated the values4. Limitation: one pyrolysis method.
Read the study ↗Limitation
The brain dispute side by side. Challenge: digestion leaves lipid residue that can mimic polyethylene, and controls were limited4. Defense in the paper: infrared spectroscopy of five brains confirmed polyethylene predominance, a second laboratory replicated key results, and reagent and storage blanks were run; the authors note residual biomatrix that could interfere22. The reply discusses "the uncertainties in even the best current methods"; only its opening was accessible to us37. A 2026 paper summarizes its arguments: the lipid comparison mixes dry- and wet-weight percentages, polymers without known lipid interference rose too, and blanks held no detectable polymer38. A March 2025 correction fixed duplicated images and scale bars, added an ethanol step and clarified Supplementary Table 12; no concentration changed39.
Below 1 µm, particles slip past filters and most spectroscopy. The landmarks here are mostly methods, and each first number carries the limits of the method that produced it.
Ter Halle and colleagues isolated colloids from North Atlantic subtropical gyre seawater, confirmed nanoscale particles by dynamic light scattering and fingerprinted them by py-GC/MS. The anthropogenic signal matched PVC, PET, PS and polyethylene: the first nanoplastic reported in a natural sample. Later basin-scale measurements support it23. Limitation: polymers were identified but concentrations not reported, and polyethylene signals changed with weathering.
Read the study ↗Materić and colleagues adapted thermal desorption–proton transfer reaction–mass spectrometry (TD-PTR-MS) to plastics, detecting below 1 ng of polystyrene in 1 mL samples, about 100 times more sensitive than earlier methods by their comparison. In Austrian Alpine snow they found several microplastic polymers, but only PET in the nanometer range. The method later enabled basin-scale ocean measurements23. Limitation: semi-quantitative, one site, and fingerprints that dissolved organic matter can complicate.
Read the study ↗Qian and colleagues built a stimulated Raman scattering microscope that matches single particles, down to about 100–200 nm, against seven common polymers. Bottled water from three brands bought at one retailer held about 240,000 plastic particles per liter (±130,000), about 90% nanoplastics. The count is disputed: Materić notes that the Milli-Q procedural blanks held about as many particles as the samples40; the authors reply that this water was itself contaminated and so was not a valid blank41. Limitation: three brands, seven polymers, unidentified particles not counted.
Read the study ↗Ten Hietbrink and colleagues sampled 12 stations on a November 2020 cruise of RV Pelagia, from the subtropical gyre to the European shelf, surface to seafloor. TD-PTR-MS found 1.5–32 mg/m³ of PET, PS and PVC nanoplastics. Extrapolated from the nine open-ocean stations to the temperate to subtropical North Atlantic mixed layer, this gives an estimate of 27 Mt, rivaling estimates for larger floating plastic. Limitation: one cruise extrapolated to a basin; polyethylene and PP were not detected.
Read the study ↗
From 2024 the field began auditing itself: chemists tested the methods behind tissue headlines, modelers checked emission estimates against measurements, and new tissue studies built in contamination tests. On 13 January 2026 The Guardian said it had identified seven human-tissue studies challenged in published criticism42.
The 2025 blood-method test (Rauert) and the 2026 glove and confidence-level papers are carded on Evidence by System3,43,44.
Evangelou, Bucci and Stohl compared 2,782 airborne microplastic measurements from 76 studies at 283 locations (2014–2024) with size-matched model runs. Models driven by three earlier emission estimates overestimated measured median concentrations by two to four orders of magnitude. Measured medians were 0.08 particles/m³ over land and 0.003 over the ocean. After rescaling, land emits about 23 times more particles than the ocean (our calculation), but the ocean dominates by mass. Limitation: particle numbers from methods and size ranges that differ.
Read the study ↗Li and colleagues analyzed 156 samples of tumor and surrounding brain from 113 surgical patients in China, and 35 healthy brain samples from five post-mortem donors. Infrared imaging gave particle counts, py-GC/MS gave mass, including a fraction below 1 µm, and a second infrared method disagreed on 2 of 18 checked particles. A hot-ethanol wash removed a lipid peak before pyrolysis; operating-room air, saline and surgical materials were tested. Plastic was in 99.4% of patient and all healthy samples, at higher levels beside tumors than in healthy brain; the healthy-brain py-GC/MS median was 50.3 µg/g, a value from the publisher's source-data file. A correction fixed figure rounding45. Limitation: five healthy donors, surgical versus post-mortem tissue, correlations only.
Read the study ↗How six famous numbers aged
| label | value | unit | year | later | status | source |
|---|---|---|---|---|---|---|
| Floating plastic particles, world ocean surface | ≥5.25 trillion | particles (model estimate) | 2014 | ≈82–358 trillion (2023 model estimate) | refined upward | S-064; S-065 |
| Plastic entering the ocean | 4.8–12.7 | Mt per year (2010, from land) | 2015 | 0.8–2.7 Mt per year from rivers (2021); 19–23 Mt to all aquatic ecosystems (2016 data) | refined, scope differs | S-014; S-069; S-012 |
| Weekly microplastic intake per person | 0.1–5 | g per week (particles up to 1 mm) | 2021 | ≈4.1 µg per week, adult median, 1–5,000 µm (2021) | disputed | S-104; S-103; S-272 |
| Plastic in human blood, mean of 22 donors | 1.6 | µg/mL | 2022 | PE interference, PET suppression (2025); 20% of 102 samples above LOQ (2025) | disputed | S-087; S-042; S-043 |
| Plastic in human brain, median 2024 decedents | 4917 | µg/g | 2025 | Matters Arising and reply (13 November 2025) | disputed | S-092; S-045; S-046; S-258 |
| Airborne microplastic over land, models driven by earlier emission estimates | 105–1,506 | particles/m³, simulated median | 2026 | 0.08 particles/m³ measured median (same study) | models overestimate | S-052 |
We review the list at each evidence snapshot and whenever a correction, retraction or published critique appears. Crossref notices were checked for every DOI on 3 November 2026; none of the 22 studies is retracted, and corrections are described on their cards. Levels change with the evidence. New studies from the last 60 days go to This Week first; findings grouped by level are on Evidence by Status.
Study card: year, system and evidence level of a landmark study.
Editorial categories of this site. A–E grade scientific findings, per claim, with a one-line rationale; D and E are not lower rungs of the A–C scale. P is not a grade: it marks facts checked against their primary record.
HOW WE GRADE A FINDING
Every key finding on this site carries a grade from A (consensus) to E (unknown), and factual records carry a separate mark, P. This page gives the rubric, worked examples, and how grades are assigned and revised. The levels are this site's editorial categories, not a universal scientific standard.
A grade on this site belongs to a finding, not to a study, a journal or a topic. It answers one question: how much independent, concordant evidence stands behind this exact statement? Two published estimates of weekly plastic intake differ about a millionfold, from roughly 4.1 µg to 5 g (our calculation from1 and2). So the intake figure is graded D, while the fact that people take in plastic is not in question.
Method
A grade is per finding. A strong study can support a weak claim, and a single paper can contain an A finding and a D finding side by side. The grade of a study never transfers automatically to the claims made from it, and a broad finding's grade never transfers to a precise number.
The rubric is quoted exactly from the site's editorial brief3, each definition followed by what it means in practice.
A consensus: multiple independent studies or a systematic review plus a statement by a scientific body. We read it as two routes, several independent studies or a systematic review. Both also need a written statement by a scientific body, such as a national academy or a UN agency.
B well supported: several independent studies with concordant findings. Different teams, places or methods arrive at the same answer.
C limited: few studies, narrow conditions, or methodological caveats. It may be correct, yet rests on one or two studies, a laboratory setup, a small sample or a method with blind spots.
D disputed: conflicting results; both sides must be shown. Published work points different ways, and the page names who says what and why.
E unknown: no reliable evidence found; state the search scope. We looked and found nothing we could rely on, and we say where and when we looked.
P provenance: checked against the primary record. Since 3 November 2026, A–E apply to scientific findings only4. Bibliographic facts, legal texts, official metadata, definitions quoted from a standard, our own arithmetic and statements about this site's process carry P. A confirmed publication date is a checked fact, not consensus.
Each mark on the page is a black-and-white shape beside its letter; the level's name is always available as text. A is a solid circle, B a three-quarter-filled circle, C a quarter-filled circle, D a circle half solid and half hatched, and E an empty dashed circle. P is an outlined, unfilled square, so it cannot be read as a grade. D and E are not lower rungs below C: they mark conflict and absence of evidence.
The evidence levels of this site (rubric version 1.1) and the separate provenance mark
| label | value | unit | group | position |
|---|---|---|---|---|
| A consensus | multiple independent studies or a systematic review plus a statement by a scientific body | amount of concordant evidence | 1 | |
| B well supported | several independent studies with concordant findings | amount of concordant evidence | 2 | |
| C limited | few studies, narrow conditions, or methodological caveats | amount of concordant evidence | 3 | |
| D disputed | conflicting results; both sides must be shown | conflict (not a lower rung) | apart | |
| E unknown | no reliable evidence found; state the search scope | absence (not a lower rung) | apart | |
| P provenance | checked against the primary record | factual records, not a scientific grade | separate |
Two systems elsewhere are related, not copied. GRADE rates the certainty of clinical evidence from high to very low, starting from study design5. The IPCC combines the amount of evidence with the degree of agreement6. Our A–C sequence borrows the second idea; D and E have no direct counterpart.
The full catalog of graded findings lives on Evidence by Status.
Microplastics are consistently found in ocean surface waters worldwide. Grade A. Decades of surveys, a 20-year review7 and the European academies' evidence review8 agree. The counts are separate findings: more than 5.25 trillion floating particles (2014 estimate) and 82 to 358 trillion for 2019 are model estimates, graded C9,10.
Data are insufficient for a full human health risk assessment of micro- and nanoplastics. Grade A. The World Health Organization concluded this for drinking water in 2019 and for food and air in 202211,12. The European Food Safety Authority noted missing nanoplastic data in 201613; its page reviewed 21 October 2026 still calls knowledge limited, with an opinion due by the end of 202714. This finding is about missing evidence, not harm or safety.
Plastic particles travel through the air and settle in remote places. Grade B. Independent teams found them in a remote Pyrenees catchment15 and western US protected areas16. Others found them in snow from the Alps to Arctic sea ice17 and as nanoplastics in polar ice18. We found no scientific body's statement on remote deposition, so it stays at B. Single-study numbers, such as 132 particles per square meter per day16, are C.
Spreading sewage sludge on farmland adds microplastics to soil. Grade B. In 31 Chilean fields, the median count rose from 1.1 to 3.5 particles per gram of dry soil as sludge applications rose from one to five19. In 16 Spanish fields, sludge-amended soils held about 2.6 times more particles than unamended ones (our calculation)20. A European mass-flow estimate points the same way21. Each study's number alone is C.
Plastic detected in carotid plaque is associated with heart attack, stroke or death. Grade C. Marfella and colleagues detected polyethylene in plaque from 150 of 257 Italian surgical patients, with a hazard ratio of 4.53 over about 34 months22. It is one observational study; letters question contamination control and confounding23.
Sand filters retain model nanoplastics in drinking-water treatment. Grade C. In a pilot rapid sand filter with aged sand, 99.5% of labeled test particles stayed in the first 0.9 m during one nine-hour run24. A model of the full-scale treatment train gave more than 3-log removal, dominated by slow sand filtration25. One group, engineered particles, a modeled full-scale value.
How much plastic sits in the human brain is disputed. Grade D. Nihart and colleagues reported a 2024 frontal-cortex median of 4,917 µg/g (about 4.9 mg/g) by pyrolysis gas chromatography–mass spectrometry, against 3,345 µg/g in different people who died in 2016, a cross-sectional comparison26.
A Matters Arising of 13 November 2025 cites limited contamination controls and missing validation, arguing that lipid-rich tissue can mimic a polyethylene signal27. The authors reply that the lipid comparison mixes dry- and wet-weight percentages, that polymers without known lipid interference rose too, and that blanks held no detectable polymer28,29. A 2026 framework asks for at least two independent methods30.
The weekly mass of plastic a person takes in is disputed. Grade D. Senathirajah and colleagues estimated 0.1–5 g per week by ingestion of particles up to 1 mm, converting counts into mass2,31. Pletz argues that this conversion overestimates the mass by several orders of magnitude32. Mohamed Nor and colleagues modeled a median adult intake of about 4.1 µg per week from food and air, for 1–5,000 µm, graded C on its own1.
A regional or global mass of nanoplastics in farm soils is not established. Grade E. Method studies, crop-tissue studies and spiked-tracer experiments do not give native soil mass. The only field quantification we found is one 2026 study of polystyrene at one compost-amended site in France: 2.57 µg/g in the 200–1,000 nm fraction of the topsoil, about 28 times a reference plot33.
A 2024 isotope estimate at a second French field covers only the mobile fraction in soil water, about 0.25 µg/kg down to 55 cm34. Search scope: Crossref and web searches on 3 November 2026 for nanoplastic quantification in agricultural soil, 2024–2026, and this site's registry.
Long-term health effects of nanoplastics in people are not established. Grade E. We found no completed study following initially healthy people with a nanoplastic-specific exposure measure. Marfella's association (level C, above) concerns surgical patients and micro- and nanoplastics together22. A Beijing cohort registered in August 2026 expects results by the end of 202935. Search scope: ClinicalTrials.gov and a web search on 3 November 2026, WHO 202212 and two reviews36,37.
The U.S. definition of a HEPA filter is at least 99.97% removal of 0.3 µm particles. P. A definition quoted from an agency page, not a measured result38.
One 1 mm sphere has the mass of a trillion 100 nm spheres of the same plastic. P. Our own arithmetic, explained on How to Read the Numbers.
Four roles touch every grade. The writer proposes a level and a rationale in the claims file. A verifier opens each cited source and marks the claim confirmed, contradicted, unsupported or unknown. A reviewer argues against the grade, and the editor decides. Details are on How We Work and Methods & Sources.
Every page is still a draft. A published grade will carry its date, sources and approving role; those fields are planned, not yet in the ledgers.
A grade is a snapshot, and five things move it. New independent studies that agree can lift a finding from C to B, and a scientific body's statement can then lift it to A. A correction, a retraction or a credible critique can move it down or to D. A new reliable measurement turns an E into a graded finding.
A mistake in how we applied the rubric, our arithmetic or a citation also changes a grade, without any new paper. We plan a public grade history with old level, new level, date and reason; it has no entries yet.
A grade is not a measure of risk. An A finding can be bad news, and an E finding can matter a great deal. A grade is also not a measure of importance or of the quality of one paper. One primary study supports at most C for its own result, because it cannot show independent replication.
The levels are not steps on one scale. A to C describe how much concordant evidence exists; D describes conflict, and E absence. So D must show both sides and E must state where we searched. P is not a grade. Unanswered questions are listed on Knowledge Gaps.
No. It means the finding rests on few studies, narrow conditions or a method with known caveats. Many C findings will move up as studies accumulate; some will move down.
One paper often contains several findings of different strength. Marfella et al. 2024 reports detection in plaque and an association with outcomes; each is graded separately (level C,22).
The record was checked against its primary source: a publication date, a legal text, a definition or our own arithmetic. It says the fact is right, not that a scientific question is settled.
Yes, through Corrections & Contact. Send the finding, the grade you would give and your reason. A misapplied rubric or an arithmetic slip is a valid report without a new source.
Version 1.1, 3 November 2026: adds the provenance mark P; states how we read the A rule; limits the single-study rule to one primary study's own result. Version 1.0, 3 November 2026: first rubric and examples. The A–E wording matches the editorial brief verbatim. Any change to a definition raises the version and is listed here with its date.
Editorial categories of this site. A–E grade scientific findings, per claim, with a one-line rationale; D and E are not lower rungs of the A–C scale. P is not a grade: it marks facts checked against their primary record.
COUNTING WHAT LIGHT CANNOT RESOLVE
Standard methods for plastic particles start at 20 µm or 1 µm, so nanoplastics are largely missing from routine monitoring. This page explains what each instrument can and cannot tell, how labs contaminate their own samples, and why careful labs given the same sample report very different numbers.
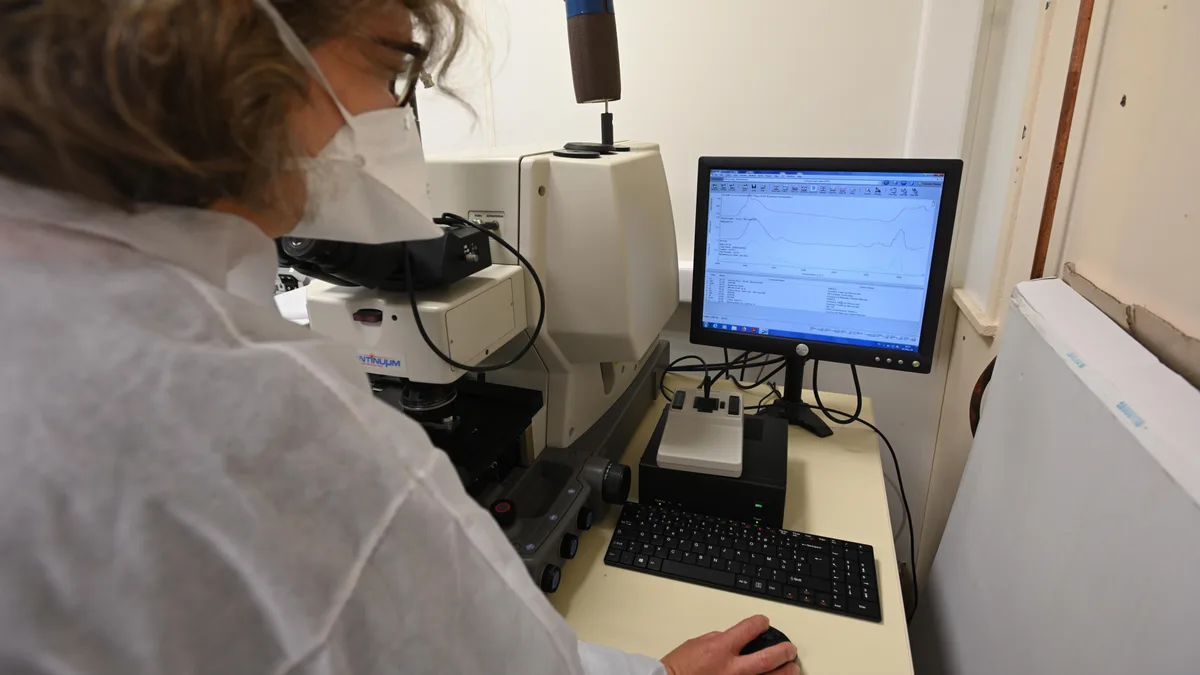
Standard methods miss nanoplastics (below 1 µm): the EU drinking-water method counts nothing below 20 µm1, and ISO 16094-2 starts at 1 µm2. Those are scopes, not instrument limits; one specialist lab has identified particles down to 500 nm by Raman microscopy, recovering 67% of test beads (level C)3. Every step can also add plastic. In a 2026 test, touching a surface with lab gloves left a mean of about 2,000 false "microplastics" per square millimeter (level C)4.
≈2,000 /mm²
false microplastic hits left by dry contact with lab gloves
nitrile and latex gloves, infrared and Raman library matching; cleanroom nitrile gloves ≈100 /mm²; Clough et al. 20264
one lab's test; a 2020 study of 10 glove types found the same stearate artifact (S-291)
CLimited4 of 50
freshwater and drinking-water studies meeting every quality criterion
Koelmans et al. 2019, 50 studies of freshwater, groundwater, tap and bottled water5
systematic quality review; a 2018 biota review found the same weaknesses (S-315)
BWell supported≈1,000×
modeled rise in count when the lower cutoff falls from 300 µm to 1 µm
power-law model, slope 2.2 (marine surface water median), up to 5 mm; our calculation; estimate, not a measurement6
Arithmetic only: extends a fitted power law below its valid range (roughly 50–350 µm in Kooi's samples); the resulting count increase is not established.
PProvenanceA nominal mesh or pore size is not an exact gate. Elongated particles slip through lengthwise, aggregates are counted as larger objects, and small particles lodge in or are lost from membranes7,3. A size range means the nominal cutoff plus a shown recovery.
The EU drinking-water method samples at least 1,000 liters through 100 µm and 20 µm filters and accepts spike recoveries of 60–140%. It reports particles of 20 µm–5 mm and fibers of 20 µm–15 mm per cubic meter1. Sediment and tissue are digested8, which can lose or alter particles.
Contamination is the harder problem; guidelines ask for clothing policies, cleaned glassware, clean-air cabinets and blanks treated like samples9. The 2025 North Atlantic survey used pre-combusted glass vials and set any signal below three standard deviations of its blanks to zero10.
Blanks vary: in a 22-laboratory exercise on clean water they carried 91 particles on average, standard deviation 141 (level C)11.
In a 2024 bottled-water study, ultrapure Milli-Q water run through the whole procedure held about as much plastic as the samples. Materić argued that it was the right procedural blank and that setting it aside for clean filters makes the counts unreliable12. The authors replied that the Milli-Q water was itself contaminated, with a different polymer profile, and that their filter blanks, exposed to the same lab air, controlled the remaining sources (level D)13.
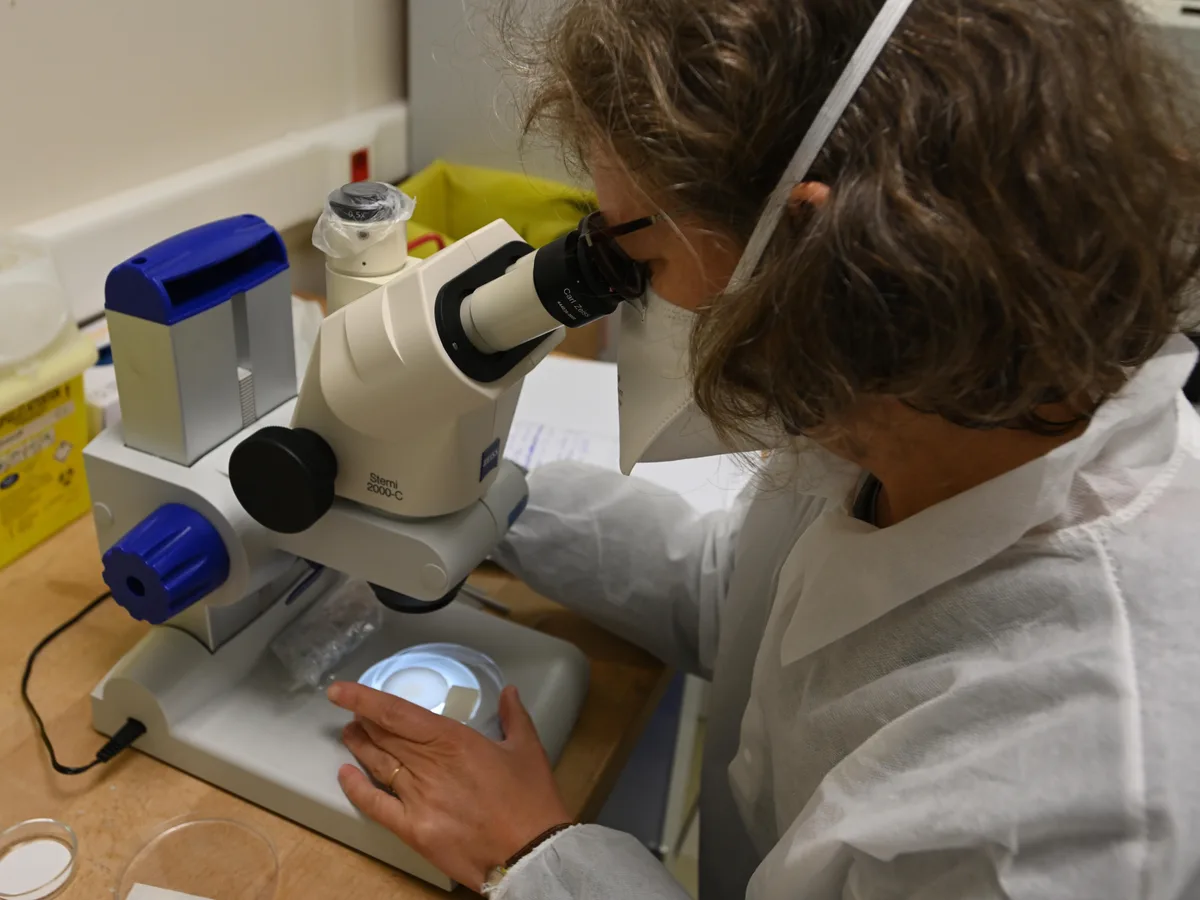
 Illustration
Particle methods give count, size, shape and, with spectroscopy, polymer. Visible light cannot resolve detail finer than roughly 200–300 nm (our calculation from the Abbe limit14); smaller particles can be detected, not imaged.
Optical microscopy is cheap but has no chemistry. In the 22-lab test, recovery averaged 76% (standard error 10%), excellent mainly above 50 µm11. In a 12-lab test, particles below 1 mm were undercounted by 20% even with best practice (level C)15.
Nile red dye binds to fat-loving (lipophilic) surfaces and makes plastic glow under a fluorescence microscope. The original protocol covers 20–1,000 µm16; the JRC/BAM study grouped staining with the less specific techniques17.
µFTIR matches an infrared spectrum per particle to a polymer library. Mid-infrared light cannot resolve detail finer than about 4–7 µm, and the routine range starts near 20 µm14; an 84-lab comparison put the limit at 10–20 µm7.
µRaman uses a visible laser and reaches about 0.5 µm14, but fluorescence from dyes, additives and matrix can swamp its spectra17. An automated 2026 workflow reached 500 nm and recovered 67 ± 10% of 500 nm test beads. It oversized particles by about 0.5 µm and needed each particle centered in the laser focus (level C)3. In potable water, only 0.36% of its 0.5–10 µm particles were plastic3.
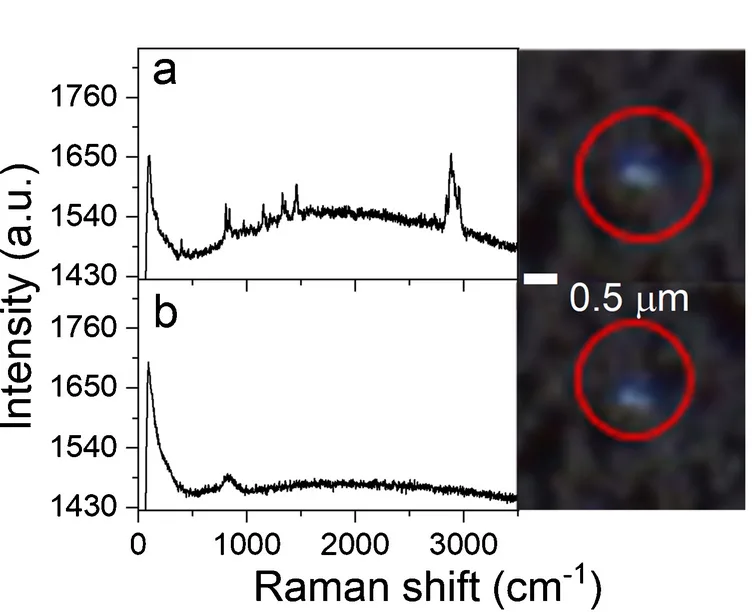
O-PTIR (optical photothermal infrared) reads infrared absorption with a visible probe beam. A 2025 tissue study reports about 500 nm lateral resolution18, and the instrument can record a Raman spectrum from the same spot14.
Thermoanalytical methods heat a sample and identify polymers from breakdown products, giving mass per polymer but no number, size or shape19,20. In pyrolysis GC/MS (py-GC/MS), each polymer is quantified from indicator compounds. One 2025 blood workflow used 1-eicosene for polyethylene (PE) and reached detection limits from 14 ng/mL for polypropylene (PP) to 245 ng/mL for PE (level C)21.
TED-GC/MS (thermal extraction desorption GC/MS) traps gases released from a larger sample portion before analysis19. Both weigh whatever polymer reaches the instrument: polymer-related mass in a prepared fraction. py-GC/MS has reported nanoplastic mass this way in surface water, groundwater and wastewater22,23. That label needs evidence that the signal came from particles, not dissolved polymer.
Limitation
Testing py-GC/MS on human blood, Rauert and colleagues found extraction recoveries of 7–109% and realistic detection limits up to 20 times higher than those calculated in pure water. Under their extraction and marker conditions, the method was not yet suitable for PE and polyvinyl chloride (PVC) in biological matrices (level C)24. Nardella and colleagues report a working full-scan blood workflow with 1-eicosene as the PE marker21; the two studies validated different steps.
TD-PTR-MS (thermal desorption proton-transfer-reaction mass spectrometry) fingerprints polymers by their vapor, with a detection limit below 1 ng of polystyrene (PS) in 1 mL samples25. In a 2025 survey, 1.5 mL subsamples of North Atlantic seawater passed through 1.0 µm filters held polyethylene terephthalate (PET), PS and PVC but no PE or PP. Whether PE was altered, below detection or masked stayed open (level C)10.
SRS microscopy (stimulated Raman scattering) images particles fast enough to count. Its resolution is about 365 nm; Qian and colleagues detected particles down to 100 nm against a seven-polymer library and estimated sizes below 365 nm from signal strength, assuming solid spheres: a method demonstration (level C)26. Their count of about 240,000 particles per liter in 3 bottled-water brands, about 90% nanoplastics, is disputed over its blanks (level D; see the blanks dispute above)12,13.
AFM-IR reads infrared absorption under an atomic force microscope tip. A 2026 study identified single PS particles down to 80 nm and silica down to 20 nm, but throughput was too low to confirm nanoplastics in ambient air without enrichment (level C)27.
Size without chemistry. Field-flow fractionation, nanoparticle tracking analysis and dynamic light scattering size particles but cannot tell plastic from clay or protein28,19. Single-particle ICP-MS counts nanoplastics by their carbon or metal signal, so far mainly in lab tests29.
Metal-doped tracers sidestep detection in lab tests: in simulated sewage sludge, over 98% of such nanoplastics ended up in sludge, with over 93% recovered30; field particles carry no tag.
What each method can tell, and what it cannot
| label | value | unit | lower_um | plot | reports | shown_range | resolution | standard | cannot_tell | source |
|---|---|---|---|---|---|---|---|---|---|---|
| Optical microscopy | 50 | µm | 50 | bar | count, size, shape | good recovery above 50 µm (22 labs, clean water) | n/a | not alone | polymer; small, clear particles | S-039, S-037 |
| Nile red | 20 | µm | 20 | bar | count, size | 20–1,000 µm protocol | n/a | none | which polymer | S-318, S-038 |
| µFTIR | 20 | µm | 20 | bar | count, size, polymer | routine above 10–20 µm | 3.7–7.4 µm | EU from 20 µm; ISO from 1 µm | below about 10 µm; stearate look-alikes | S-319, S-326, S-291 |
| µRaman | 0.5 | µm | 0.5 | bar | count, size, polymer | routine 1–5 µm; 500 nm beads at 67% recovery, one lab | about 0.5 µm | EU from 20 µm; ISO from 1 µm | fluorescent particles; exact size near 500 nm | S-325, S-326 |
| O-PTIR | 0.5 | µm | marker | polymer, image | no recovery range reported | about 500 nm | none | shape below 500 nm; recovery | S-320 | |
| SRS microscopy | 0.1 | µm | marker | count, estimated size, 7 polymers | one demonstration, bottled water | about 365 nm; detects to 100 nm | none | shape below 365 nm; other polymers | S-033 | |
| AFM-IR | 0.08 | µm | marker | polymer per particle | test aerosols, one lab | detects 80 nm PS, 20 nm silica | none | concentrations (too slow) | S-327 | |
| py-GC/MS, TED-GC/MS | ng/mL | none | mass per polymer | size set by prior filtration; blood LOD 14–245 ng/mL | n/a | ISO 16094-3 draft, mass only | size, number, shape; particulate or not | S-043, S-042, S-041 | ||
| TD-PTR-MS | ng | none | mass per polymer | fraction through a 1.0 µm filter; LOD below 1 ng PS | n/a | none | size, number; masked PE | S-031, S-067 | ||
| FFF, NTA, DLS | nm | none | size distribution | not reported in cited reviews | n/a | none plastic-specific | whether it is plastic | S-028, S-027 | ||
| EU 2024/1441 scope | 20 | µm | 20 | reference | particles, fibers per m³ | 20 µm–5 mm | n/a | legal method | below 20 µm | S-132 |
| ISO 16094-2 scope | 1 | µm | 1 | reference | count, size, polymer | 1–5,000 µm, ten polymers | n/a | ISO standard | below 1 µm | S-040 |
Size cutoffs. Small particles vastly outnumber large ones: above a lower size limit of roughly 50–350 µm, depending on the sample type, counts follow power laws; below it, measured counts fall short of the fitted line (level B)6,16,32. Across more than 60,000 particles measured by FTIR imaging, median slopes ran from 2.2 in marine surface water to 3.1 in organisms (level C)6.
Take a constructed example: one lab counts above 300 µm, another down to 1 µm, in the same water. A slope of 2.2 gives the second about 970 times more particles, a slope of 3.1 about 160,000 times (our calculation, up to 5 mm; level P). This calculation extends a fitted power law down to 1 µm; in Kooi's samples, the fit already fails below roughly 50–350 µm. The factors illustrate that assumption, not a measured increase (level E; searched S-314, S-313, S-026, S-027 and S-028, 3 November 2026).
Same water, different cutoff: modeled count relative to a 300 µm cutoff
Our calculation. Count between the cutoff L and 5,000 µm, proportional to L^(1−α) − 5000^(1−α), with α = 2.2 (median, marine surface water) and α = 3.1 (median, biota) from Kooi et al. 2021. Model, labeled 'model'; extrapolation below the fitted lower limit (roughly 50–350 µm, sample-type dependent; Kooi et al. 2021) is not established, so the 100 µm point and all smaller cutoffs are marked extrapolated. No laboratory icons: the comparison is a constructed example.
| label | value | unit | cutoff_um | value_slope_3_1 | extrapolated |
|---|---|---|---|---|---|
| 300 µm | 1 | × count at 300 µm | 300 | 1 | false |
| 100 µm | 3.8 | × count at 300 µm | 100 | 10 | true |
| 20 µm | 27 | × count at 300 µm | 20 | 296 | true |
| 10 µm | 61 | × count at 300 µm | 10 | 1268 | true |
| 1 µm | 972 | × count at 300 µm | 1 | 159638 | true |
Count versus mass. One 1 mm PE sphere weighs about 0.5 mg, as much as a trillion 100 nm spheres (our calculation, density 0.95 g/cm³; level P); see How to Read the Numbers.
Sample volume. The EU method samples at least 1,000 liters and must analyze at least 10% of the recovered material, so at least 100 liters1. The North Atlantic survey collected 2 liters and analyzed 1.5 mL subsamples10: about 67,000 times less analyzed volume (our calculation; level P). Each stray particle weighs more in a small portion.
Method
Same sample, many answers: a real test. In 2025, 84 laboratories registered to receive identical tablets of PET and aged PE particles of about 10–200 µm, and 56 reported results. All that reported identified both polymers; reproducibility standard deviations, in percent of the reference value, were 62–117% (PE) and 46–62% (PET) with thermal methods and 121–129% and 64–70% with spectroscopy. Dissolving and filtering the tablets was one of the most critical steps (level C)7.
Between-lab spread. In the JRC/BAM comparison, 98 datasets on one PET-in-water sample spread almost evenly between the lowest and highest values. Libraries, match thresholds and data treatment varied strongly, and only 69% of labs reporting counts said how they sized particles17. A 2026 comparison across seven countries with shared protocols found identification accuracy from 54% to 93% and PE recovery from below 5% to above 130%33. Large spread recurs across exercises (level B)15,11,7.
Look-alikes. Leachates of 10 glove types read as PE under µRaman, µFTIR and py-GC/MS, because stearates and fatty acids share PE's long hydrocarbon chains (level B)31,4. Biological matrices can also yield common py-GC/MS markers for PE and PVC21,24. A 2026 framework asks for two orthogonal techniques before plastic is reported in human samples34.
How far this affects brain-tissue figures is disputed (level D). Monikh, Materić and colleagues argue that the 2025 brain study lacked adequate contamination controls and validation, and that undigested lipids can inflate the PE signal35. Campen and colleagues reply that the lipid comparison mixes dry- and wet-weight percentages, that polymers without known lipid interference rose over time too, and that procedural blanks held no detectable polymer36,37.
They concede that tissue digestion has no agreed method and that alkaline digestion may overestimate polymer content37. We read only the reply's opening paragraph, which acknowledges uncertainty "in even the best current methods"36; the points above follow a 2026 paper's summary37. For health questions, see Human Body.
ISO/TR 21960:2020 summarizes the state of knowledge, ISO 24187:2023 sets principles for microplastic analysis38,39, and
ISO 16094-2:2025 covers drinking water and other low-solids water by microscopy and vibrational spectroscopy, sizing and counting particles of 1–5,000 µm and identifying ten named polymers2. Its thermo-analytical sister, ISO 16094-3, gives polymer mass without a size range. Its final draft (FDIS) went to ballot on 15 September 2026, and it was not published when we checked on 3 November 202640,20.
ASTM D8332-20 and D8333-20 cover collecting and preparing water samples for Raman, infrared or py-GC/MS41,42. Legal status is on Policy and Regulation.
Quality criteria came first: biota studies scored an average reliability of 0 on ten criteria43. A 2019 review found only 4 of 50 freshwater and drinking-water studies meeting every criterion (level B)5. In 2021 the JRC/BAM report named the missing tools: method validation, reference materials and proficiency testing17.
Of the plastic-specific documents listed here (ISO 16094-2 and -3, ISO 24187, ISO/TR 21960, ASTM D8332 and D8333, EU 2024/1441), none sizes and counts plastic below 1 µm (level P; checked 3 November 2026). General nanoparticle-sizing standards, which do not identify polymers, were not searched. See Knowledge Gaps.
It needs assumed size, shape and density distributions. Koelmans and colleagues published such a conversion; its output is an estimate, not a measurement (level B,32).
Size classes are defined on What Is Nanoplastic. How to Read the Numbers turns these limits into questions for any headline, and Landmark Studies shows which instruments produced the best-known results.
Editorial categories of this site. A–E grade scientific findings, per claim, with a one-line rationale; D and E are not lower rungs of the A–C scale. P is not a grade: it marks facts checked against their primary record.
FIVE QUESTIONS FOR ANY NUMBER
Microplastic numbers for the same thing can differ a thousandfold or a millionfold, often for good reasons. This guide gives five questions to ask of any figure, on this site or in the news, and shows how the home counters and indicators should be read.
A liter of bottled water held about 325 plastic particles in a 2018 survey and about 240,000 in a 2024 study1,2. That is roughly 740 times more (our calculation), and both numbers can be right, although the 2024 count is disputed (see below). The teams looked for different sizes with different instruments in different bottles.
A microplastic number makes sense only once you know what was counted, how small the method could see, and whether anyone measured anything. Five questions sort that out in under a minute.
Mason and colleagues tested 259 bottles from 11 brands bought in 9 countries, staining particles with Nile Red down to 6.5 µm1. They averaged 10.4 particles per liter above 100 µm and about 315 more between 6.5 and 100 µm. The stain also lights up some non-plastic material, and particles under 100 µm were not confirmed by infrared, so small counts may run high (level C)1.
Qian and colleagues used stimulated Raman scattering microscopy on 3 brands, looking for 7 polymers down to about 100 nm2. They reported about 240,000 particles per liter, roughly 90% of them nanoplastics. It is a method demonstration, not a market survey.
The count is disputed (level D). In a published letter, Materić notes that ultrapure Milli-Q water run through the whole procedure held about as much plastic as the bottled water, and that the clean filters used as blanks miss contamination from handling3. The authors reply that the Milli-Q water was itself contaminated, with a different polymer profile, and that their filter blanks, exposed to the same lab air, controlled the remaining sources4.
Bottled water: reported particles per liter and the smallest size each count includes
| label | value | unit | lower_limit | source |
|---|---|---|---|---|
| Mason et al. 2018, particles above 100 µm (Nile Red) | 10.4 | particles/L | 100 µm | S-074 |
| Mason et al. 2018, all particles from 6.5 µm (Nile Red) | 325 | particles/L | 6.5 µm | S-074 |
| Qian et al. 2024, all particles from about 100 nm (SRS microscopy; count disputed) | 240000 | particles/L | ≈100 nm | S-033 |
Reporting guidelines ask authors to state exactly these things: size limits, blanks, recovery and sample numbers6.
Labs still disagree. In a 2019 exercise, 12 experienced laboratories analyzed identical bottles of spiked seawater, and even with best practice they undercounted particles smaller than 1 mm by about 20%7. In 2026, laboratories in seven countries using the same polymer standards and protocols still differed substantially in polymer identification and recovery8. Method choice alone can move a number (level B).
Mass grows with the cube of diameter. One spherical particle 1 mm across has the same mass as 10¹² (a trillion) spheres of 100 nm made of the same plastic (our calculation). For polystyrene, that one sphere weighs about 0.55 mg (our calculation, density 1.05 g/cm³). A sample of nanoplastics can have enormous counts and almost no mass.
The two metrics can even rank sources in opposite order. A 2026 study of airborne microplastics from 5 to 100 µm estimated that land emits about 23 times more particles than the ocean (our calculation from its totals). Yet the ocean emits more mass, about 4,000 against 500 metric tons a year (model estimates, level C)9. The site keeps counts and masses apart.
Same mass, different count: one 1 mm sphere versus 100 nm spheres
| label | value | unit | mass_mg |
|---|---|---|---|
| one sphere, diameter 1 mm | 1 | particle | 0.55 |
| spheres, diameter 100 nm, same total mass | 1000000000000 | particles | 0.55 |
Kooi and Koelmans proposed treating particle size as a power-law distribution, so counts can be rescaled between size ranges11,10. A 2021 analysis imaged more than 60,000 particles by infrared, down to 11 or 20 µm. Median slopes for particle length ran from 2.2 in marine surface water to 3.1 in organisms (level C)12.
With those slopes, lowering a cutoff tenfold would raise the count about 16 to 126 times (our calculation, valid when the largest particles are far above the cutoff). When a new study reports "far more particles than before", first check whether its cutoff moved.
Whether the power law continues below the measured range is not established for environmental samples (level E). In the 2021 data the smallest particles already fell below the fitted line. The authors cite a power law down to 0.1 µm only from a laboratory fragmentation test12. Search scope: that dataset and a web search on 3 November 2026 for field size distributions below 1 µm.
Headline numbers are often estimates, and estimates can be badly off. Evangelou and colleagues ran an atmospheric model with three published emission inventories against 2,782 measurements from 76 studies. The simulations overestimated measured median concentrations and deposition by two to four orders of magnitude, mainly because emissions had been overestimated (level C)9.
Extrapolations from one expedition carry similar caveats. Ten Hietbrink and colleagues measured nanoplastics of three polymers (PET, polystyrene, PVC) along one North Atlantic transect. They estimated about 27 million metric tons (27 Mt) in the mixed layer of the temperate to subtropical North Atlantic (estimate, level C)5. That is three polymers in one layer of one basin, not all ocean plastic.
Estimate
The home counters are estimates, not measurements. Each counter multiplies a named study value, chosen in settings, by the time elapsed since you opened the page. Σ adds the air and water flows only. With the defaults, 99.7% of it is the OECD estimate of plastic of all sizes entering the ocean, mostly large debris13, so Σ is neither a micro- or nanoplastic total nor global production. Soil has no counter: we found no sourced global estimate. Human intake is shown separately, by mass. Model v7 has run on the home page since 4 November 2026; every input and the revision are documented on Flows & Model14.
A percentage only means something with its denominator. "At least 99.97% of particles 0.3 µm across" is the U.S. Department of Energy definition of a HEPA filter, as summarized by the EPA15. It is a theoretical rating at the hardest size to catch, not a field measurement (level P).
Two figures circulate for sand filtration of nanoplastics. In a pilot rapid sand filter with aged sand in Zurich, 99.5% of model nanoplastics about 200 nm across stayed in the first 0.9 m over nine hours (measured, level C)16,17. The "more than 3 log", or about 99.9%, comes from a computer model of a full-scale treatment train, dominated by its slow sand step (modeled, level C)17. Neither says how much plastic has left the planet's air or water.
The home page shows two editorial indicators, not measured shares. "0 / 4" counts the reviewed domains (air, water, soil, human body) that meet the four conditions for a proven complete solution on Solutions by System. None did in the review checked on 3 November 2026 (level P)18.
The "≈0%" symbol on the v6 home cards had no numerator, denominator or size range. It stood for a status in words, "no proven removal at scale", and since 4 November 2026 the cards show those words instead. A local 99.5% and that status do not contradict each other, and neither says that prevention or local treatment fails.
A range is the answer, not a weakness. Jambeck and colleagues estimated that 4.8 to 12.7 Mt of plastic waste of all sizes entered the ocean from land in 2010 (estimate, level C)19. The top is about 2.6 times the bottom (our calculation). Quote both ends, never the midpoint alone.
An order of magnitude is a factor of ten: "two orders" is a hundredfold, "six orders" a millionfold. On a log axis each equal step is ten times the last, so this site uses log scales when studies are far apart.
In June 2019 a WWF report prepared by Dalberg, based on a study WWF commissioned from the University of Newcastle, said people may ingest about 5 g of plastic a week20. That is the weight of a credit card. The peer-reviewed version, Senathirajah and colleagues, gives 0.1 to 5 g per week by ingestion, for particles up to 1 mm, as a global average21. The headline kept only the top of the range.
Mohamed Nor and colleagues modeled a different scope: intake from eight food types plus inhaled air, for particles from 1 to 5,000 µm. Their adult median is about 583 ng per day, or about 4.1 µg per week (level C)22. Five grams is about 1.2 million times more (our calculation). The ratio compares two outputs with different scopes; it is not an uncertainty range.
Why so far apart? Senathirajah and colleagues converted counts into mass with averaged particle masses; Pletz argued that this inflates the mass by several orders of magnitude23. Cox and colleagues, often cited alongside, counted particles only: 74,000 to 113,000 a year for Americans including inhalation, after a 2020 correction, with no mass estimate24,25.
Run the five questions. Size range: different. Count or mass: counts converted to mass. Measured or estimated: both estimated. Samples: a few food types. Compared with what: a credit card, an arbitrary unit. The 5 g figure is disputed (level D); 4.1 µg is one model's median (level C). The site shows both with their scopes.
Mass equivalent of one week's modeled intake for adults (mg), log scale, with reference objects shown apart
| label | value | unit | kind | source |
|---|---|---|---|---|
| Mohamed Nor et al. 2021: median adult intake, eight food types plus inhaled air, 1–5,000 µm | 0.0041 | mg/week | model median | S-103 |
| Senathirajah et al. 2021: low end of range, ingestion, particles up to 1 mm | 100 | mg/week | low end of a disputed published range | S-104 |
| Senathirajah et al. 2021: high end of range, ingestion, particles up to 1 mm | 5000 | mg/week | high end of a disputed published range | S-104 |
| Reference object, not an intake: one 1 mm polystyrene sphere | 0.55 | mg | reference mass (our calculation) | site-derived |
| Reference object, not an intake: one credit card, as used in the 2019 headline | 5000 | mg | reference mass | S-105 |
≈740×
bottled water counts, 2024 versus 2018 study (our calculation)
240,000 particles/L from ≈100 nm (3 brands, SRS) vs 325 particles/L from 6.5 µm (11 brands, Nile Red); not a change over time2
our arithmetic; the 2018 input is a single study (level C); the 2024 count is disputed over its blanks (level D, S-294, S-295); also uses S-074
PProvenance≈1,200,000×
credit-card intake estimate versus a model median (our calculation)
5 g/week (top of 0.1–5 g, ingestion, up to 1 mm) vs 4.1 µg/week (adult median, food plus air, 1–5,000 µm)21
our arithmetic on two published outputs with different scopes; the 5 g estimate is disputed (level D, S-272); median from S-103
PProvenance≈23×
more airborne particles from land than ocean, yet less mass
model estimate scaled to 2,782 measurements, particles 5–100 µm, 2026; 6.1 × 10¹⁷ vs 2.6 × 10¹⁶ particles/yr9
count and mass rank the sources in opposite order (0.0005 vs 0.004 Tg/yr)
CLimitedNo. It comes from 3 brands, 7 target polymers and a detection floor of about 100 nm; it shows what a sensitive method can see, not what a typical bottle holds. The count itself is disputed: a published letter argues the procedural blank held as much plastic as the samples (3), and the authors reply that this blank water was itself contaminated (4) (level D,2).
Conversion needs size, shape and density for every particle. The credit-card dispute turns on exactly this step (level D,23).
No. Each is a named study value multiplied by elapsed time, an estimate; Σ adds air and water only, and the default water value covers plastic of all sizes. Flows & Model documents every input (level P,14).
Ask the five questions of any new number. If size range, metric or method is missing, treat it as unreadable rather than wrong. For how instruments set size limits, see How We Measure It. For what the grades mean, see Evidence Levels. For the counter inputs, see Flows & Model; for the home indicators, Planet Overview; for intake and tissue figures, Human Body.
Editorial categories of this site. A–E grade scientific findings, per claim, with a one-line rationale; D and E are not lower rungs of the A–C scale. P is not a grade: it marks facts checked against their primary record.
WHY OCEAN PLASTIC DOES NOT ADD UP
Far more plastic is estimated to enter the sea than floats at its surface, and no budget is closed. A 2025 study estimates about 27 Mt of nanoplastic in the North Atlantic mixed layer alone, an extrapolation from one cruise that we grade C.
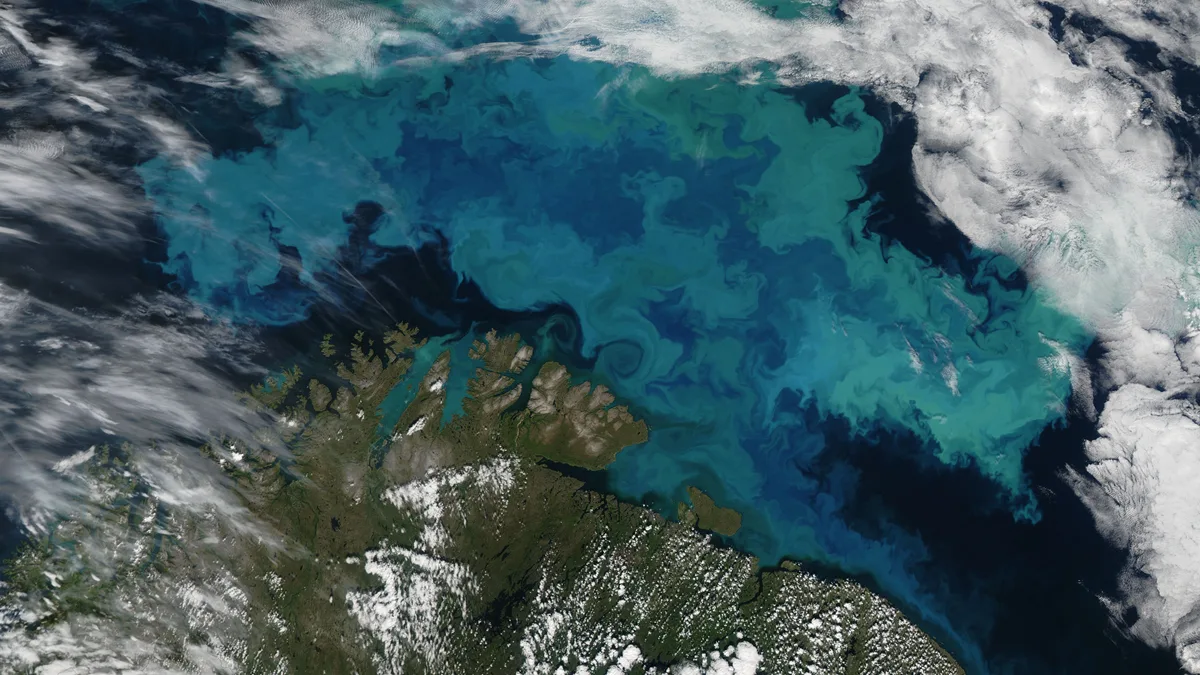
For years the ocean's plastic did not add up. One model put plastic waste entering the sea from coastal land at 4.8–12.7 million metric tons (Mt) in 20101. Net and visual surveys suggested only about 270,000 metric tons afloat2. Several explanations compete, and none closes the budget. Plastic sinks, settles on the seafloor and freezes into ice; rivers hold much of it back; newer models put the input far lower; and nets miss small particles. In 2025 a Dutch team estimated about 27 Mt of nanoplastic in the North Atlantic mixed layer alone, an extrapolation from one cruise (level C)3.
≈27 Mt
nanoplastic in the mixed layer of the temperate to subtropical North Atlantic
estimate, not measurement; PET, PS and PVC below 1 µm; 12 stations sampled in November 2020; mass extrapolated from the nine open-ocean stations over the November climatological mixed layer between 8.5° N and 55° N; TD-PTR-MS3
single cruise and single lab; the authors report concentrations as a lower limit; PE not detected, PP in one sample that the authors excluded as possible contamination
CLimited82–358 trillion
plastic particles floating at the ocean surface in 2019
model estimate from 11,777 net samples, 1979–2019, nearly 95% with 320–350 µm mesh, so smaller particles are not counted; mean 171 trillion4
single model; its mass of 1.1–4.9 Mt (mean 2.3 Mt) is converted from counts at a fixed 0.0136 g per particle, not weighed
CLimited≈3.2 Mt
initially buoyant plastic in the whole ocean, coasts included, in 2020
estimate, not measurement; 95% interval 3.0–3.4 Mt; sizes 0.1–1,600 mm; PE, PP and PS only; model fitted to about 22,000 observations5
more than 95% of this mass is in items larger than 25 mm; a different inventory from the OECD stock below
CLimited≈30 Mt and ≈109 Mt
plastic accumulated in the ocean and in rivers by 2019
estimates, not measurements; OECD Global Plastics Outlook 2022 model of mismanaged and littered waste leaking to water since 1951, built around large items; not a count of particles by size6
one model; not to be added to or subtracted from the 3.2 Mt buoyant-plastic estimate
CLimited4.8–12.7 Mt
plastic waste entering the ocean from coastal land in 2010, one model
estimate, not measurement; 192 coastal countries; Jambeck et al. 20151,6,5
separate estimates, not one range: the OECD model gives 1.7 Mt reaching the ocean in 2019, and Kaandorp et al. 2023 about 0.5 Mt of initially buoyant plastic in 2020
CLimitedEstimates of how much plastic reaches the sea differ by more than an order of magnitude, partly because they count different things. Jambeck and colleagues estimated that 4.8–12.7 Mt of plastic waste from 192 coastal countries entered the ocean in 2010 (level C)1. Meijer and colleagues modeled river emissions at 0.8–2.7 Mt per year, 80% of it from more than 1,000 rivers, many of them small and urban (level C)7.
The OECD estimated that 6.1 Mt leaked into rivers, lakes and seas in 2019, of which 1.7 Mt reached the ocean6. It attributes its lower values to its assumptions: about a third of mismanaged waste burned in open pits, about 44% buried in dumpsites, and years of retention in rivers. How much plastic of all kinds enters the sea is disputed, and different base years and definitions limit comparison (level D)6.
Kaandorp and colleagues fitted a model to about 22,000 surface, beach and deep-sea observations. It puts the 2020 input of initially buoyant plastic at about 0.5 Mt, with rivers adding only 57,000–69,000 t (level C)5. It leaves out polyvinyl chloride (PVC) and polyethylene terephthalate (PET), which it cites as 35–40% of the mass entering the sea5. This is a separate quantity, not the low end of one range.
Stocks are no more certain. The OECD model estimates about 30 Mt in seas and oceans and 109 Mt in rivers by 2019 (level C)6. It follows leaked waste since 1951, is built around large items and does not sort particles by size. Kaandorp's 3.2 Mt of buoyant plastic is a different inventory; the two must not be added or subtracted5.
Plastic held in rivers is retained upstream, not stored in the sea: rivers act as reservoirs as well as conduits8.
Surface surveys see only part of the stock. Most use neuston or manta nets with a mesh of about 0.33 mm, so smaller particles pass through (level P)2,4.
From net tows and visual surveys made in 2007–2013, Eriksen and colleagues estimated at least 5.25 trillion floating particles weighing 268,940 t2. Their 2023 update put the 2019 total at 82–358 trillion particles (an estimate, level C)4. Its mass of 1.1–4.9 Mt (mean 2.3 Mt) was not weighed. The authors multiplied counts by a fixed 0.0136 g per particle from earlier literature, a simple conversion they acknowledge (level C)4.
Count and mass tell different stories. In the Great Pacific Garbage Patch, Lebreton and colleagues estimated 79,000 t (45,000–129,000 t) of plastic floating over 1.6 million km². Microplastics made up 94% of the 1.8 trillion pieces but only 8% of the mass, and fishing nets at least 46% (level C)9. Several of the authors are linked to The Ocean Cleanup (level P)9.
Below the surface, a synthesis of 1,885 depth profiles collected from 2014 to 2024 found microplastic abundances from 0.0001 to 10,000 particles per cubic meter10. Particles of 1–100 µm were spread more evenly with depth than larger ones (level B)10.
On the deep seafloor, bottom currents concentrate particles. In the northern Tyrrhenian Sea, Kane and colleagues found up to 190 pieces per 50 g of sediment, the highest count then reported for any seafloor setting (level C)11. From 51 samples in the Great Australian Bight, Barrett and colleagues extrapolated about 14 Mt of microplastic in the top 9 cm of the world's seafloor (level C)12.
Arctic sea-ice cores from Fram Strait and the central Arctic held up to about 12,000 particles per liter of melted ice. Two thirds fell in the smallest class detected, 11 µm (level C)13. One Antarctic sea-ice core averaged 52.3 ng/mL of polyethylene (PE), polypropylene (PP) and PET nanoplastics, measured with the mass-spectrometry method used in the North Atlantic study below (level C)14.
 Illustration
Nanoplastics, below 1 µm, pass through any net. Ter Halle and colleagues first identified them in North Atlantic gyre water in 2017, without a mass15. In November 2020, ten Hietbrink, Materić and colleagues sampled 12 stations from the subtropical gyre to the European shelf3.
All were sampled at 10 m. The nine open-ocean stations were also sampled at 1,000 m and 30 m above the seafloor, and the three shelf stations 5–10 m above the seafloor. They analyzed the water passing 1 µm filters by thermal-desorption proton-transfer-reaction mass spectrometry (TD-PTR-MS).
PET, polystyrene (PS) and PVC appeared at every station in the mixed layer, averaging 18.1 mg/m³ across all 12 and 25.0 mg/m³ at the three shelf stations near Europe. At the nine open-ocean stations the mixed layer averaged 15.1–16.7 mg/m³, against 10.9 mg/m³ at 1,000 m and 5.5 mg/m³ near the bottom, mostly PET there (level C)3. PE was not detected. PP appeared in one mixed-layer sample (station 8); the authors excluded it as possible contamination3.
The authors scaled the open-ocean values to the November mixed layer between 8.5° N and 55° N. That gives 15.20 Mt inside the gyre and 11.73 Mt outside it, about 27 Mt in all (an estimate, level C)3. By polymer that is 11.95 Mt PET, 6.52 Mt PS and 8.47 Mt PVC (our sums of the paper's regional values, level P).
The paper sets this against 0.36 Mt of larger buoyant plastic in the same water, modeled by Kaandorp and colleagues. Dividing 26.93 Mt by 0.36 Mt gives about 75 (our ratio, level P)3,5, but the two cover different polymers and sizes, and one is a lower-limit extrapolation. The authors suggest weathering may have altered PE and PP beyond recognition, or that they fell below detection3. The result covers one basin, one season and one depth per layer.
Estimate
The 27 Mt figure is an extrapolation, not a measured total (level C). If the paper's six standard errors (three polymers in two regions) are independent, they combine to about ±2.8 Mt (our calculation in quadrature, level P); the paper itself gives no combined error, and this covers only the statistical part. Nine open-ocean stations stand for about 1.7 million cubic kilometers of water (our sum of the paper's volumes, level P).
The authors call their concentrations semiquantitative and a lower limit, because not all plastic is converted into detectable ions. From a PS spike test that recovered about 7%, they infer that actual PS concentrations might be 14 times higher. That is their interpretation, not a correction factor: recovery for PET and PVC was not tested, lab blanks averaged 0.90 mg/m³, and the team screened for false positives from organic matter. Confirmation would need an independent laboratory, a second method such as pyrolysis GC/MS, other seasons and other ocean basins.
Nanoplastics in the North Atlantic, November 2020: concentration by depth and estimated mass by polymer
| label | value | unit | panel | se | gyre | outside_gyre |
|---|---|---|---|---|---|---|
| mixed layer, 10 m, all 12 stations (includes 3 shelf stations) | 18.1 | mg/m³ | concentration | 2.1 | ||
| mixed layer, gyre stations 1–5 | 15.1 | mg/m³ | concentration | 3.3 | ||
| mixed layer, outside gyre stations 6–9 | 16.7 | mg/m³ | concentration | 3.5 | ||
| intermediate water, 1,000 m, stations 1–9 | 10.9 | mg/m³ | concentration | 1.6 | ||
| bottom water, 30 m above seafloor, stations 1–9 | 5.5 | mg/m³ | concentration | 0.6 | ||
| mixed layer, coastal shelf stations 10–12 | 25 | mg/m³ | concentration | 4.2 | ||
| PET | 11.95 | Mt | mass estimate | 6.74 ± 1.13 | 5.21 ± 0.84 | |
| PS | 6.52 | Mt | mass estimate | 4.10 ± 1.46 | 2.42 ± 1.09 | |
| PVC | 8.47 | Mt | mass estimate | 4.37 ± 1.28 | 4.10 ± 0.96 | |
| modeled larger buoyant plastic, same mixed layer (Kaandorp et al. 2023, cited in the paper) | 0.36 | Mt | mass estimate |
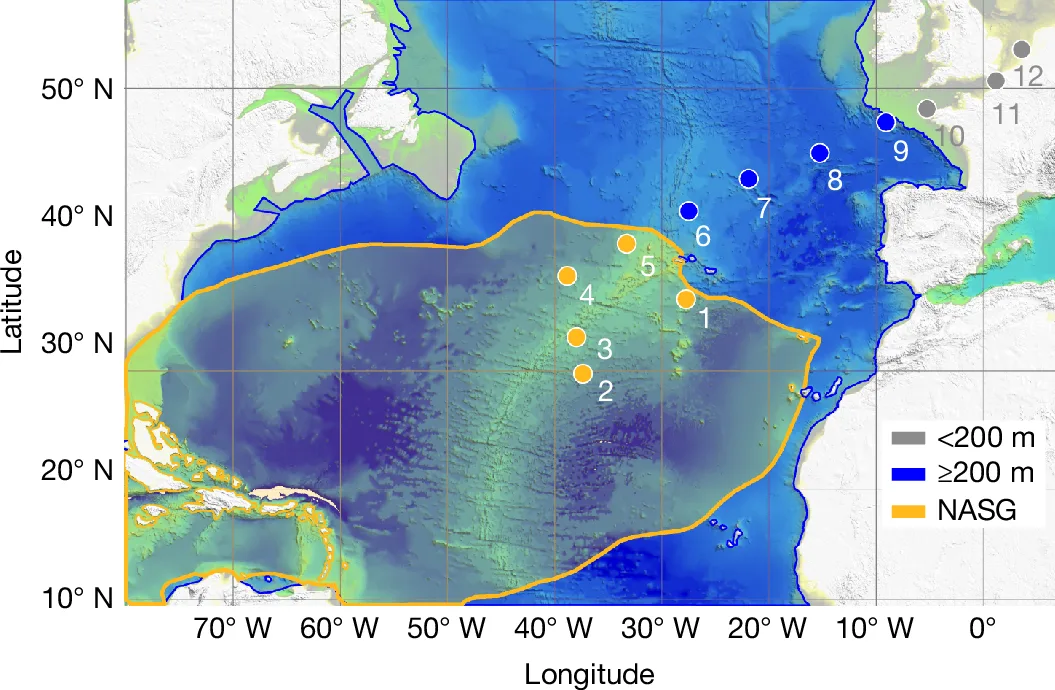
Most ocean plastic passes through fresh water first, and some stays there. Nava and colleagues sampled surface water in 38 lakes and reservoirs in 23 countries with one method and found plastic larger than 250 µm in every one (level C)16. The highest concentrations, about 5.4–11 particles per cubic meter in Lake Tahoe, Lake Maggiore and Lake Lugano, matched or exceeded those reported in subtropical ocean gyres (level C)16. The lake values are our reading of the paper's Extended Data Fig. 2 (level P).
Nanoplastic data for fresh water are thin. One 2022 study used pyrolysis GC/MS to quantify six polymers: 0.28–0.79 µg/L in surface water and 0.02–0.20 µg/L in riverbank-filtered groundwater, mostly PP and PE (level C)17. Since 1 µg/L equals 1 mg/m³, that surface range is 0.28–0.79 mg/m³, well below the North Atlantic mixed-layer mean of 18.1 mg/m³ (our conversion, level P). Different instruments, separation steps and polymers mean the ratio does not rank fresh water against the sea.
Groundwater matters because it is a drinking-water source; what reaches people is on the Human Body page. Data quality is a known weakness: of 50 freshwater and drinking-water studies reviewed in 2019, only four met all proposed quality criteria18.
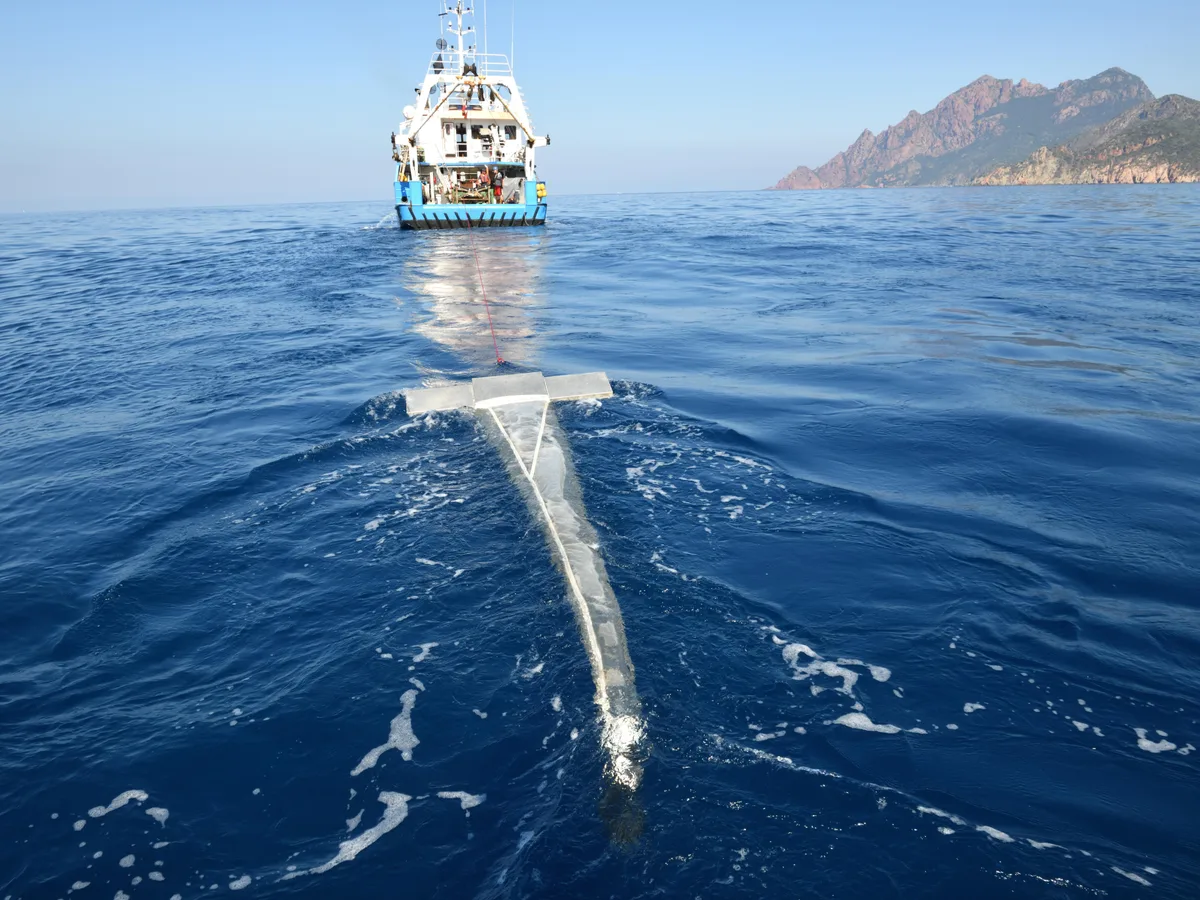
Encounters with plastic are documented across marine life. A 2015 review of 340 publications counted 693 species that had encountered marine debris by entanglement or ingestion; plastic made up 92% of the encounters (level B)19. A 2021 synthesis of 171,774 fish of 555 species found plastic in 386 species, 210 of them commercially fished. Where microplastics were counted, 26% of fish had ingested plastic (level B)20.
Swallowing plastic is not the same as being harmed by it. A 2016 systematic review found that 83% of 296 tested threats from marine debris were demonstrated, but 89% of the demonstrated impacts were molecular, cellular or tissue changes. Deaths and changes in communities came mainly from plastic debris larger than 1 mm, such as rope, straws and fragments (level B)21. A 2020 meta-analysis of 139 studies in water and on land found that only 17% of the concentrations used in experiments had been found in nature (level B)22.
Food-web and carbon-cycle consequences are not established. Predatory fish higher in the food web are the most likely to contain plastic20, a sign of exposure, not proof that plastic builds up along food chains. In one laboratory test, copepods given 20.6 µm polystyrene beads at 1,000 per milliliter produced fecal pellets that sank 2.25 times more slowly (level C)23. That dose is about 100,000 times the highest subsurface count in the 2025 synthesis (our comparison, level P)10.
Lanternfish feeding near the surface and releasing particles at depth are a likely route for microplastics to the seafloor20. We found no field measurement showing that plastic changes the ocean's carbon export (level E; site registry and a web search, 3 November 2026). For nanoplastics, ten Hietbrink and colleagues note that most toxicity studies use concentrations not anchored in robust environmental measurements (level C)3. Seafood and people are covered on Human Body.
The ocean plastic budget is not closed, and its input estimates are not one range. They differ in year, polymers, pathways and assumptions: 4.8–12.7 Mt of all plastic in 2010, 1.7 Mt in 2019 and about 0.5 Mt of buoyant plastic in 20201,6,5.
Kaandorp's model concludes there is no missing sink for buoyant plastic5; the North Atlantic study suggests a large nanoplastic mass that no budget included3. Both can hold: one covers buoyant pieces larger than 0.1 mm, the other dense polymers below 1 µm. Neither closes the budget for all plastic.
Methods are not standardized, so counts from different nets, filters and instruments rarely compare directly10. We found no comparable basin-scale nanoplastic mass survey of the Pacific, Indian or Southern Ocean (level E; site registry and two web searches, 3 November 2026).
Plastic already in the sea will stay. In one 2024 Earth system model, cutting pollution by more than 5% a year from 2026 stabilizes the global ocean microplastic inventory (an estimate, level C)24. No trajectory reduces it substantially by 2100, and deeper layers keep accumulating. A 2024 review projects that environmental microplastic contamination could double by 204025.
Limitation
Counts and masses in this page are never interchangeable. A trillion small particles can weigh less than one fishing net, and each survey sees only the sizes its net, filter or instrument can catch: 0.33 mm for most surface nets, 0.25 mm in the lake survey, 11 µm in the Arctic ice cores and below 1 µm in the North Atlantic nanoplastic study.
Separate published estimates of plastic mass in rivers and the ocean, not one budget
| label | value | unit | group | source | level | kind | low | high |
|---|---|---|---|---|---|---|---|---|
| rivers, global, 2019 (OECD model, built around large items) | 109 | Mt | modeled stock from waste leakage | S-011 | C | model estimate | ||
| ocean, global, 2019 (OECD model, built around large items) | 30 | Mt | modeled stock from waste leakage | S-011 | C | model estimate | ||
| initially buoyant plastic 0.1–1,600 mm, PE, PP and PS, whole ocean incl. coasts, 2020 | 3.2 | Mt | fitted mass budget | S-071 | C | model estimate | 3 | 3.4 |
| nanoplastic below 1 µm, PET, PS and PVC, North Atlantic mixed layer only, 2020 | 27 | Mt | extrapolated from samples | S-067 | C | extrapolated from 9 open-ocean stations; lower limit per authors | ||
| microplastic, top 9 cm of the global seafloor | 14 | Mt | extrapolated from samples | S-335 | C | extrapolated from 51 samples in one region | ||
| floating plastic caught by surface nets (mostly ≥ 0.33 mm), global, 2019 | 2.3 | Mt | extrapolated from samples | S-065 | C | model from net samples; value is the paper's mean; mass from counts at a fixed 0.0136 g per particle | 1.1 | 4.9 |
| floating plastic, Great Pacific Garbage Patch | 0.079 | Mt | extrapolated from samples | S-068 | C | model calibrated with surveys; minimum estimate | 0.045 | 0.129 |
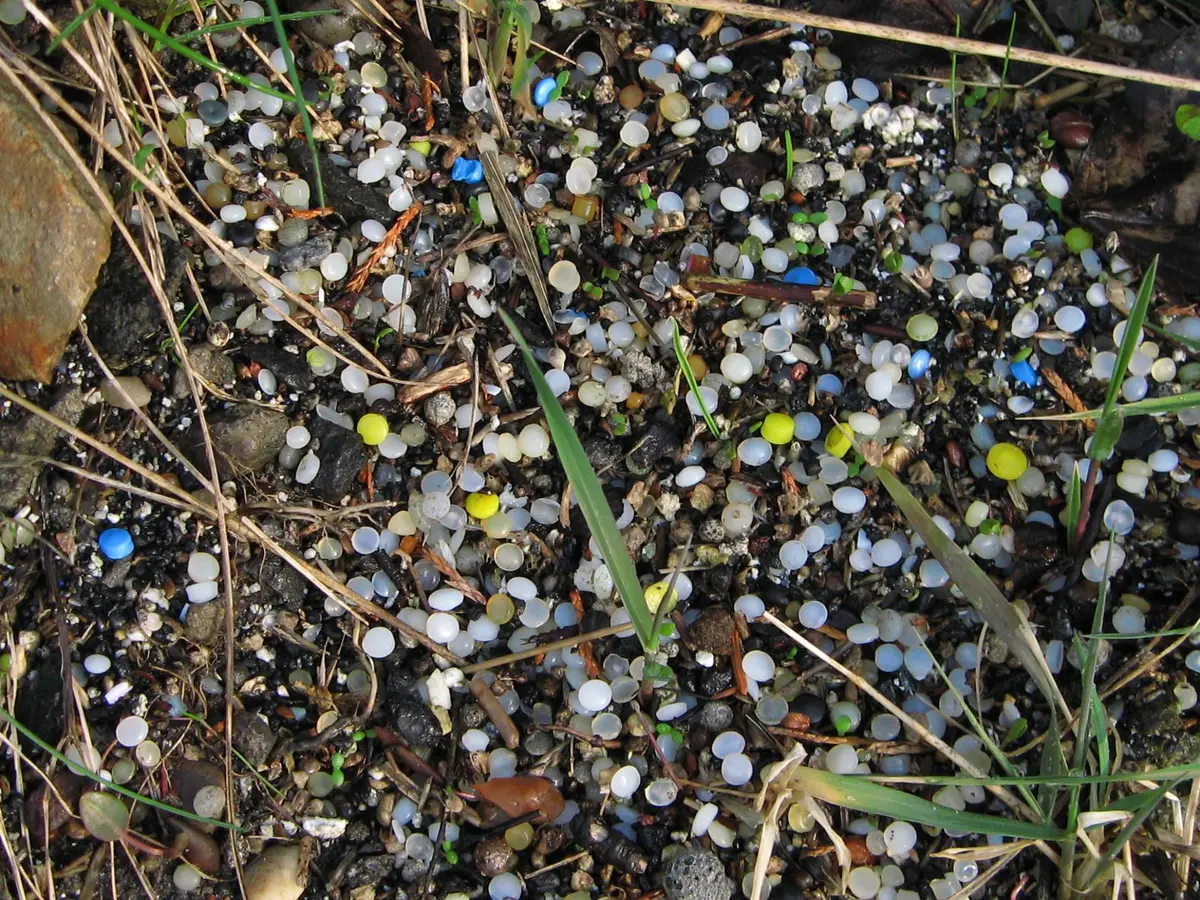
No. One 2018 estimate puts about 79,000 t of plastic over 1.6 million km², in 1.8 trillion scattered pieces, most of them small; on average that is about 49 kg per square kilometer (our calculation, level P). Most of the mass is in large items such as nets (level C,9).
In the mixed layer of the temperate to subtropical North Atlantic, one 2025 study estimates about 27 Mt of nanoplastic, against 0.36 Mt of larger buoyant plastic in a separate model. The two cover different polymers and sizes. We found no comparable survey of another ocean, so a global answer is not established (level C,3).
Yes. Dense polymers such as PET and PVC sink, and floating ones can sink once they are coated by organisms or caught in marine snow. One model estimates that 220,000 t of initially buoyant plastic reach marine sediments each year (estimate, level C,5).
Not always. A survey of 38 lakes and reservoirs found plastic in every one, and the three most polluted matched or exceeded concentrations reported in subtropical ocean gyres (level C,16).
How ocean plastic fits into the planet-wide flows behind the home counters is on Flows & Model, and how sea spray returns particles to the air is on Atmosphere. Land sources and farm soils are on Soil. River barriers, ocean cleanup and their removal totals are on Solutions by System. Instruments and their size limits are on How We Measure It, and pellet and treaty rules on Policy & Regulation.
Editorial categories of this site. A–E grade scientific findings, per claim, with a one-line rationale; D and E are not lower rungs of the A–C scale. P is not a grade: it marks facts checked against their primary record.
FROM THE ATMOSPHERE TO THE HUMAN BODY
Plastic particles are found in air, water and soil worldwide and are detected in the human body. The home counters are estimates, not measurements. None of the four systems shown meets our criterion for a proven complete solution: 0 / 4.
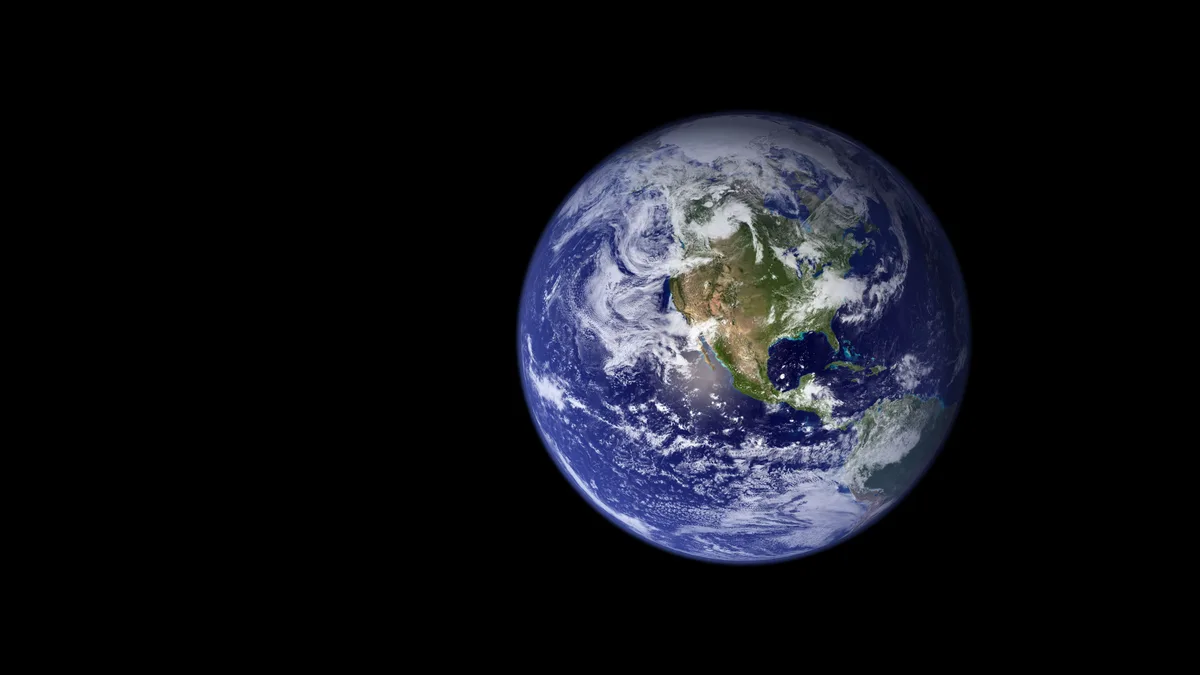
Plastic particles are consistently found in air, water and soil (level A)1. They are detected throughout the human body, though how reliably amounts are measured is debated (level B)1,2. A 2025 study of 12 stations estimated about 27 million metric tons (27 Mt) of nanoplastic in the mixed upper layer of the temperate to subtropical North Atlantic3. The authors put this in the range of earlier estimates for larger plastic in the Atlantic or even the global ocean (level C)4.
≈22 Mt
plastic leaked into the environment worldwide in 2019
all plastic sizes; 88% macroplastics, 12% microplastics below 5 mm; OECD model estimate for 2019, against about 460 Mt produced that year5
single global model estimate from an intergovernmental agency, not a measured total
CLimited≈27 Mt
nanoplastic estimated in the upper North Atlantic
mixed layer of the temperate to subtropical North Atlantic; PET, PS and PVC below 1 µm; 12 stations on one transect, extrapolated to the basin4
single study; polyethylene and polypropylene were not detected and may have been masked; not yet replicated
CLimited100–10,000×
how far models overshot measured airborne microplastic
three earlier emission inventories, size-aligned in a transport model, against measured global medians; 2,782 measurements of air concentration and deposition from 76 studies at 283 locations, 2014–2024; particles 5–100 µm6
particle numbers (the authors converted mass data to numbers); one study, though built on a large compiled dataset
CLimitedThe third number measures uncertainty rather than pollution. Laid beside 2,782 measurements of air concentration and deposition, the models overshot the measured medians by two to four orders of magnitude (level C)6.
Three numbers at three scales
| label | value | unit | level | source |
|---|---|---|---|---|
| plastic leaked into the environment, world, 2019 (all sizes, modeled) | 22 | Mt | C | S-011 |
| nanoplastic, North Atlantic mixed layer (PET, PS, PVC < 1 µm, extrapolated) | 27 | Mt | C | S-067 |
| model overestimate of measured airborne microplastic concentration, lower bound | 100 | × | C | S-052 |
| model overestimate of measured airborne microplastic concentration, upper bound | 10000 | × | C | S-052 |
The home counters multiply a flow by elapsed time: since you opened the page, since midnight or since 1 January. Each flow is a named study value chosen in settings, and every counter is an estimate, not a measurement. Σ adds air and water only. With the defaults it is 1.7045 Mt a year (54 kg/s), and 99.7% of that is plastic of all sizes entering the ocean, mostly large debris (level P)7.
So Σ is not a micro- or nanoplastic total. The model subtracts nothing where flows overlap, and Σ is not plastic production. Soil has no counter because we found no global estimate of plastic entering soil each year (level E)7. Human intake is a separate mass counter. The default air flow comes from the 2026 comparison above: about 0.0045 Mt per year for particles of 5–100 µm (level C)6.
Estimate
Every number in the home counters is an estimate, not a measurement: a chosen study value multiplied by elapsed time. It is not a sensor reading and not global plastic production. Choosing another study in settings changes the counters, not any scientific result or evidence level.
0 / 4 is a count, not a score. A proven complete solution must meet four conditions. It works on dispersed particles across the whole system, covers nanoplastics below 1 µm, is shown outside the laboratory and does not simply move particles elsewhere8. No method meets all four for any system shown (level E)1. We searched Crossref, PubMed, agency pages and the web for 2016–2026, last on 3 November 2026. Prevention and local treatment are not judged by this count.
Local results are shown separately. In a pilot rapid sand filter at Zurich's waterworks, 99.5% of palladium-labeled model nanoplastics stayed in the top 0.9 m of sand (level C)9. A model of the full-scale plant, built on those tests, credits slow sand filtration with about 3 log units (99.9%) of removal. Retention is not destruction. The cards and methods are on Solutions by System, the findings per system on Evidence by System.
From Planet to Cell follows the particles from orbit down to a cell membrane. Four Microworlds shows air, water, soil and tissue as animated illustrations. How to Read the Numbers explains why particle counts and masses from different studies rarely compare directly, and Evidence Levels explains the A to E grades used here.
 Illustration
Editorial categories of this site. A–E grade scientific findings, per claim, with a one-line rationale; D and E are not lower rungs of the A–C scale. P is not a grade: it marks facts checked against their primary record.
WHERE EVERY IMAGE COMES FROM
Every image on this site is listed with its source, credit and license or terms of use. The list separates real imagery, data graphics made from cited data, and AI illustrations.
Every image on this site is listed below with its source, credit and license or terms of use. There are three kinds. Real photographs and micrographs appear only after their license is verified; captions name the instrument or setting. Data graphics are made here from cited data, and each caption names its source. AI illustrations show what no camera can, such as particles enlarged for visibility; each is labeled "Illustration" and never presented as a measurement.
The four microworld visuals on the home page are such illustrations: they were generated on 14 October 2026 with OpenAI's gpt-image model through Codex, OpenAI's coding agent, at the site owner's request (the owner's statement, matched by the local Codex records). Their prompts and file lineage are recorded; the original PNGs also carry C2PA credentials naming OpenAI, whose signatures have not been independently validated (P)1. Each is labeled as an illustration and shows no real tissue and no measurement.
Reuse follows each image's own terms. Graphics made by this site are released under {{SITE_LICENSE}}; the data they draw on keeps its own terms. To report a wrong or missing credit, use Corrections & Contact. Our image rules are in How We Work.
| lane | license class | images |
|---|---|---|
| L1 | Public domain, CC0, NASA or US Gov | 13 |
| L1 | CC BY | 14 |
| L1 | CC BY-SA | 10 |
| L1 | Other terms | 1 |
| L2 | Site original | 78 |
| L3 | Site original | 23 |
| total | 139 |
Journey frame: through clouds toward the ocean (illustration) Illustration · AI generated
Journey frame: plastic fragment among smaller particles (illustration) Illustration · AI generated
The Blue Marble (2002): Western Hemisphere globe Real image
The Blue Marble: Land Surface, Ocean Color and Sea Ice (2048 × 1024) Real image
The Blue Marble: Clouds (2048 × 1024) Real image
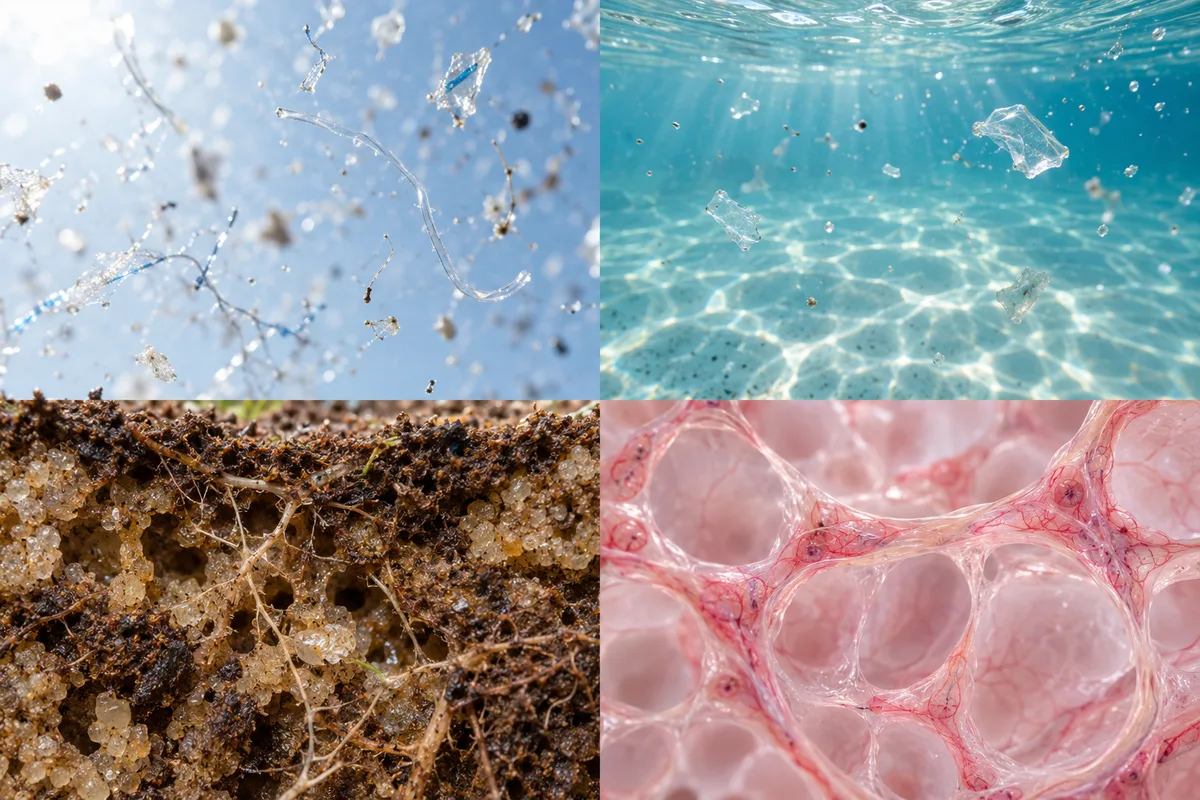
Microworld panels: air, water, soil and lung tissue (AI illustration, 2 × 2 atlas) Illustration · AI generated
Journey frame: ocean through clouds (AI illustration) Illustration · AI generated
Journey frame: a single cell (AI illustration) Illustration · AI generated
Journey frame: a particle above a cell membrane (AI illustration) Illustration · AI generated
Enamel kettle on a gas stove Real image
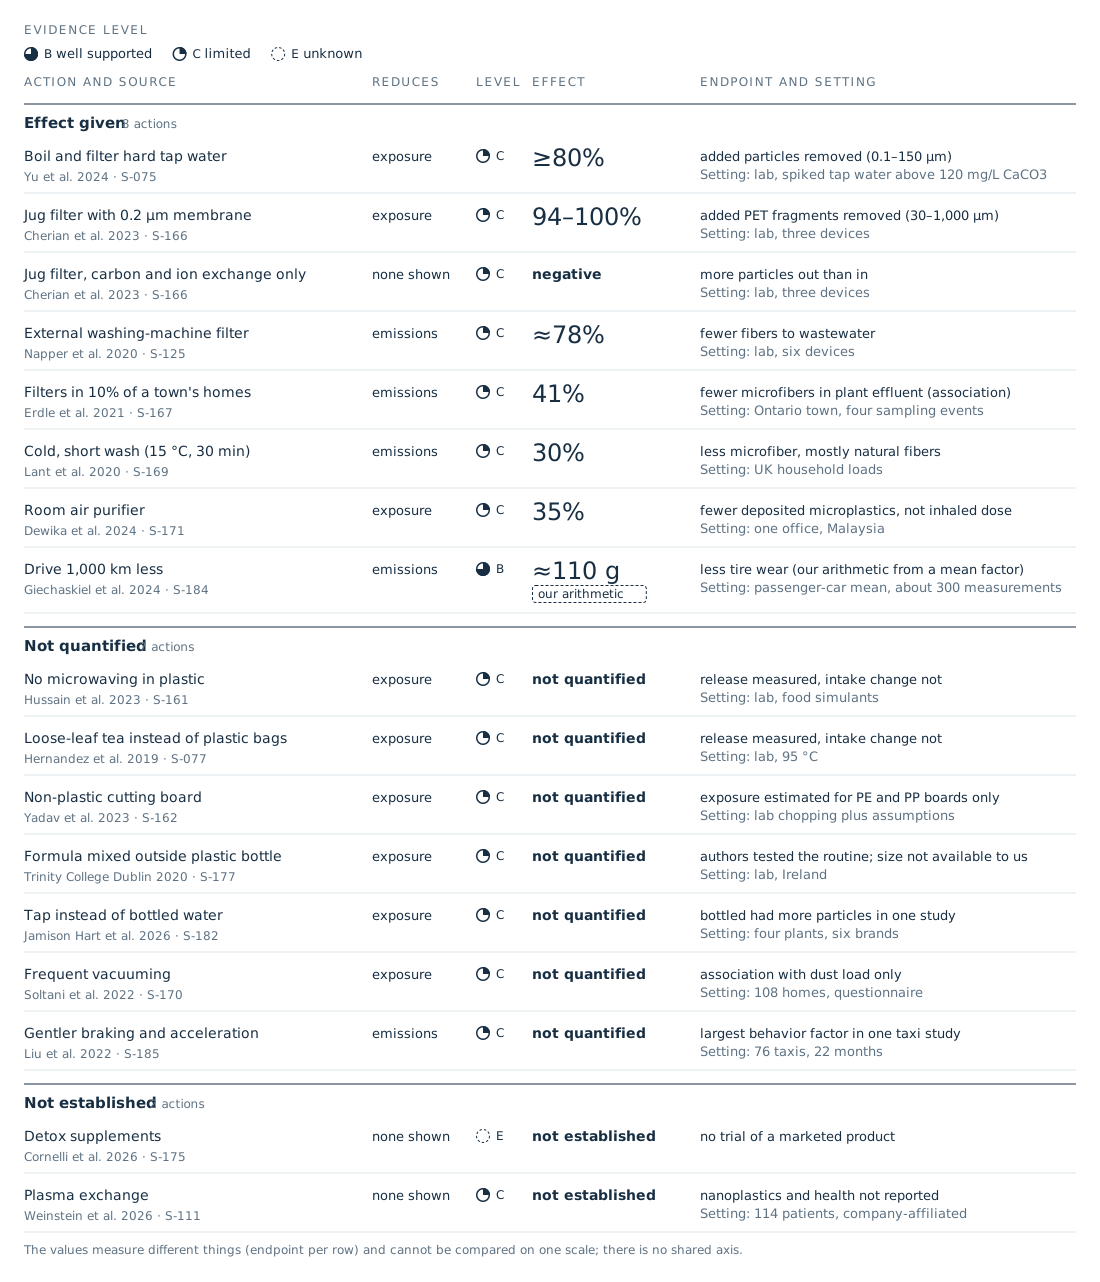
Everyday actions by evidence and measured effect Data graphic
Plastic microwave rice cooker Real image
Canister vacuum cleaner on a tiled floor Real image
External washing-machine filter with captured lint (illustration) Illustration · AI generated
Sediment plume at sea Real image
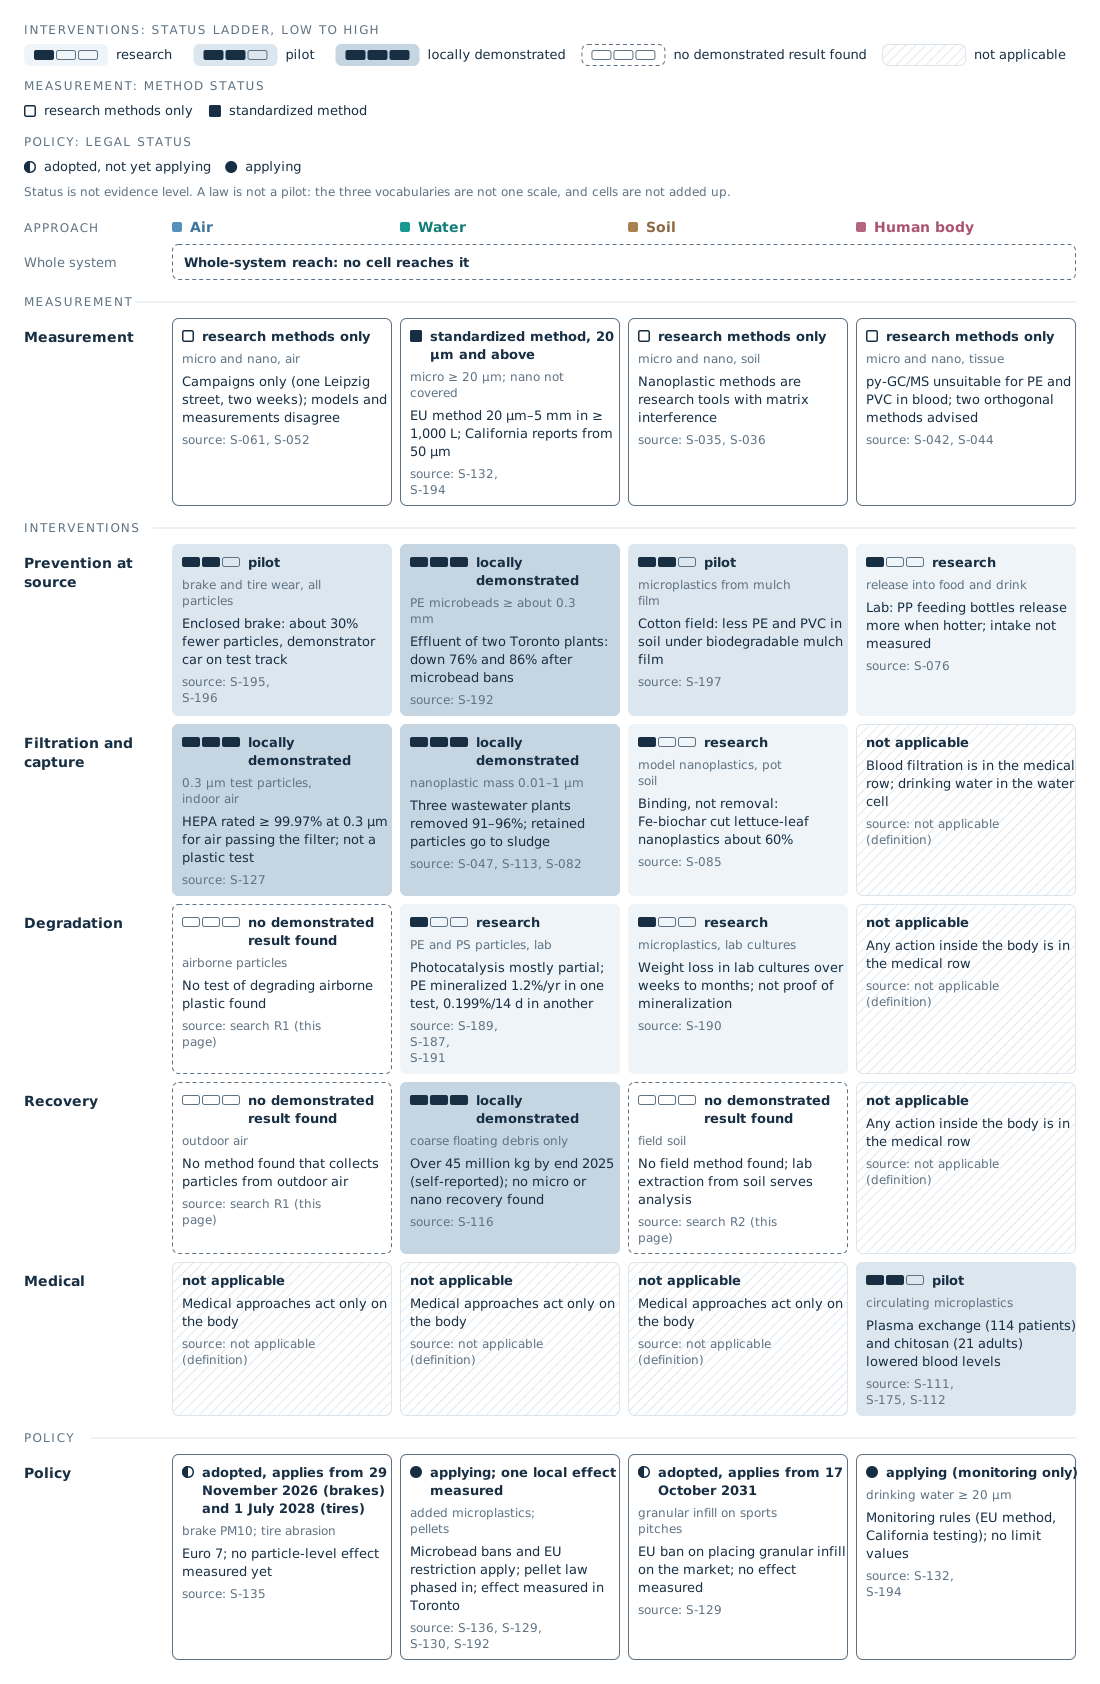
Solutions by approach and system: status on 3 November 2026 Data graphic
Inner Harbor Water Wheel (Mr. Trash Wheel), Baltimore Real image
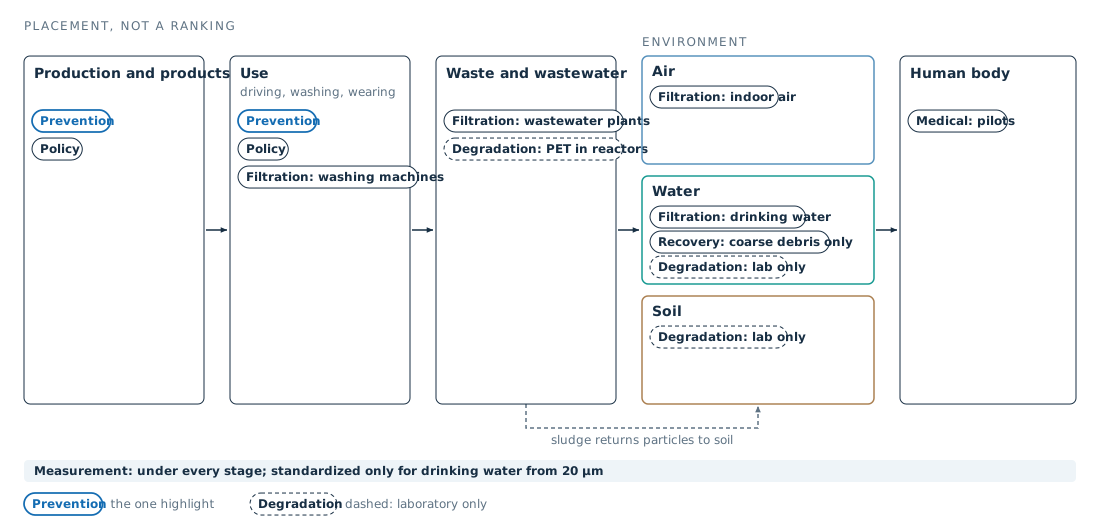
Where each approach acts along the chain Data graphic
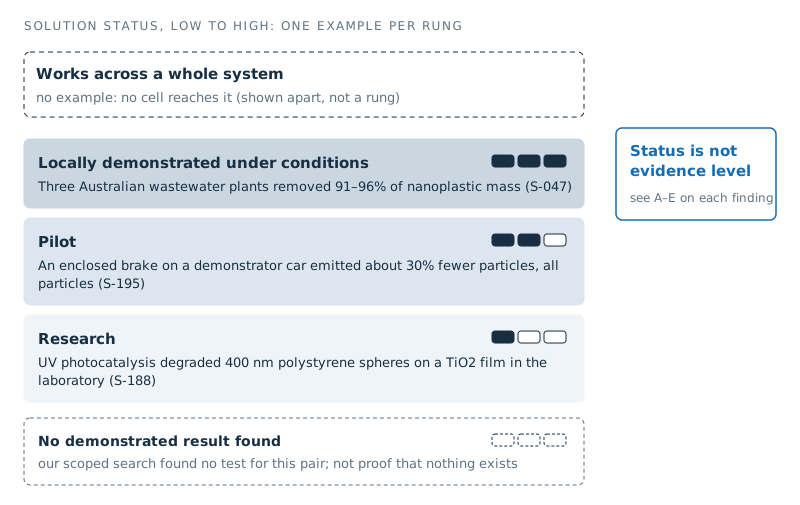
The solution status scale with one example per rung Data graphic
Atmospheric Wet Deposition Sampler Real image
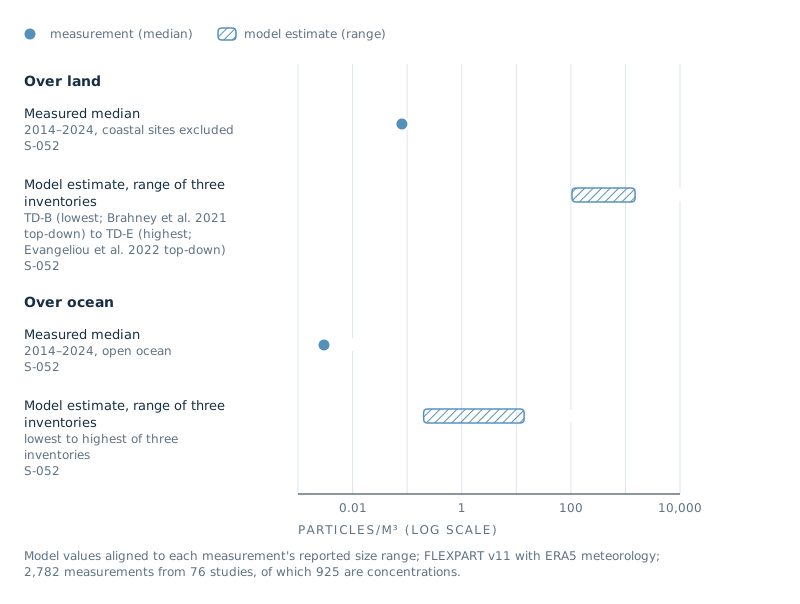
Measured vs modeled microplastic concentrations in air, global medians Data graphic
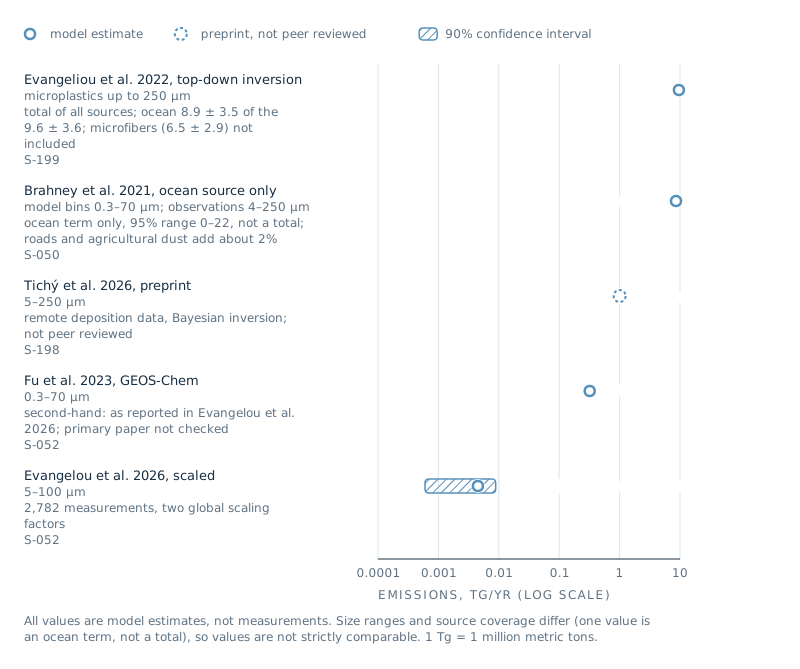
Global microplastic emissions into the air: published estimates Data graphic
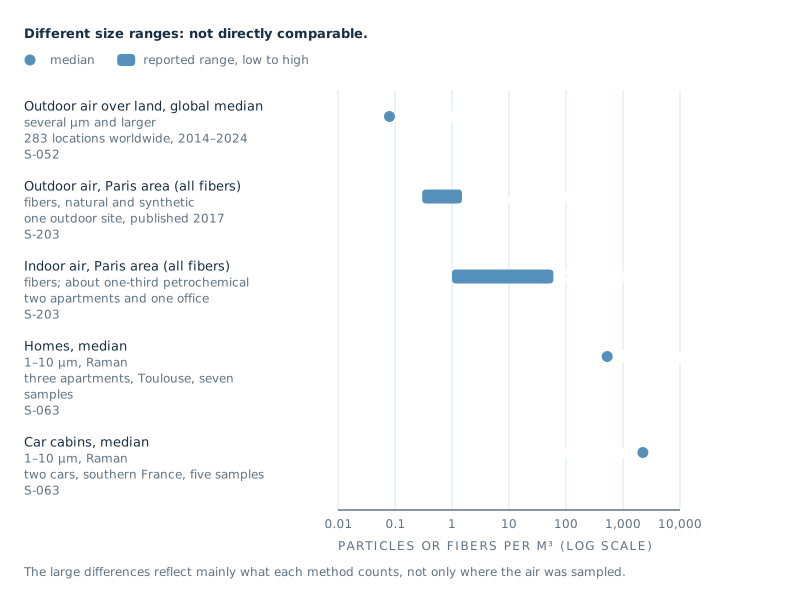
Airborne plastic indoors and outdoors: what each study counted Data graphic
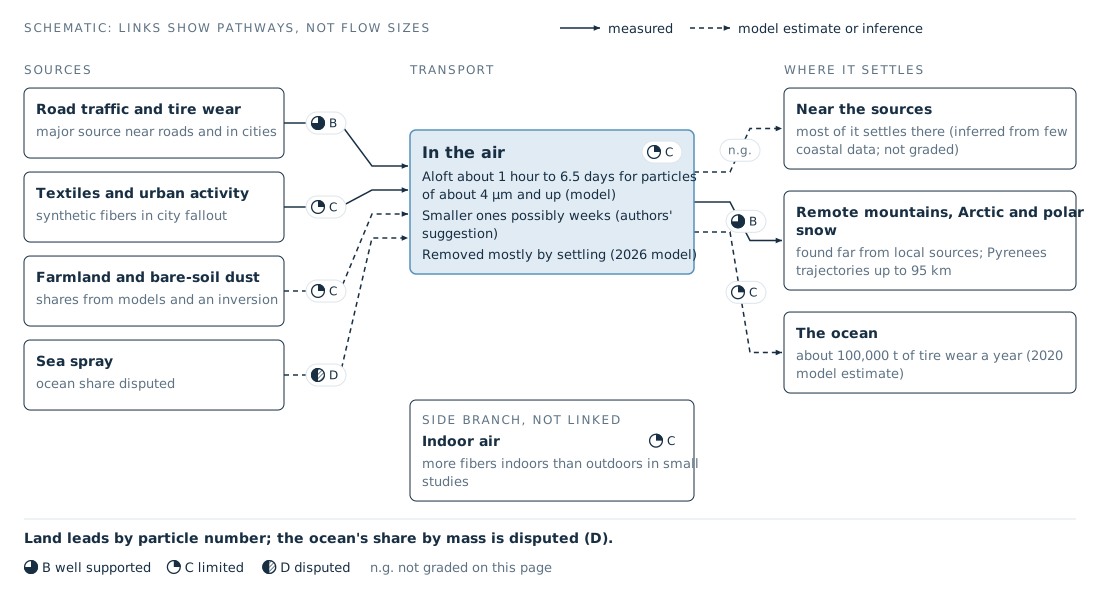
Airborne microplastic from source to deposition Data graphic
Fiber and pollen grain in daylight air (illustration) Illustration · AI generated
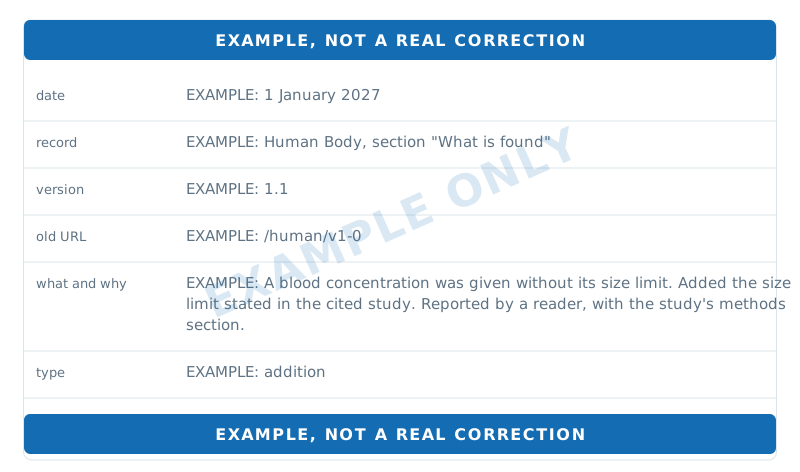
Example corrections log entry (not a real correction) Data graphic

Report a correction (icon) Data graphic
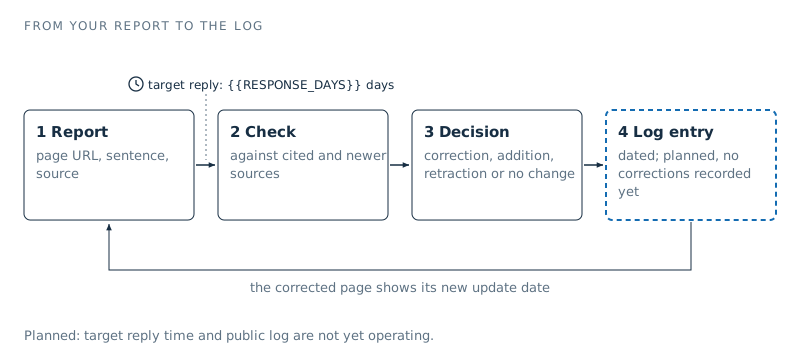
From a reader report to a dated corrections log entry Data graphic
Figure 4B: HR-SEM of polystyrene particles before and after simulated thermal treatment Real image
Polyethylene balls Real image
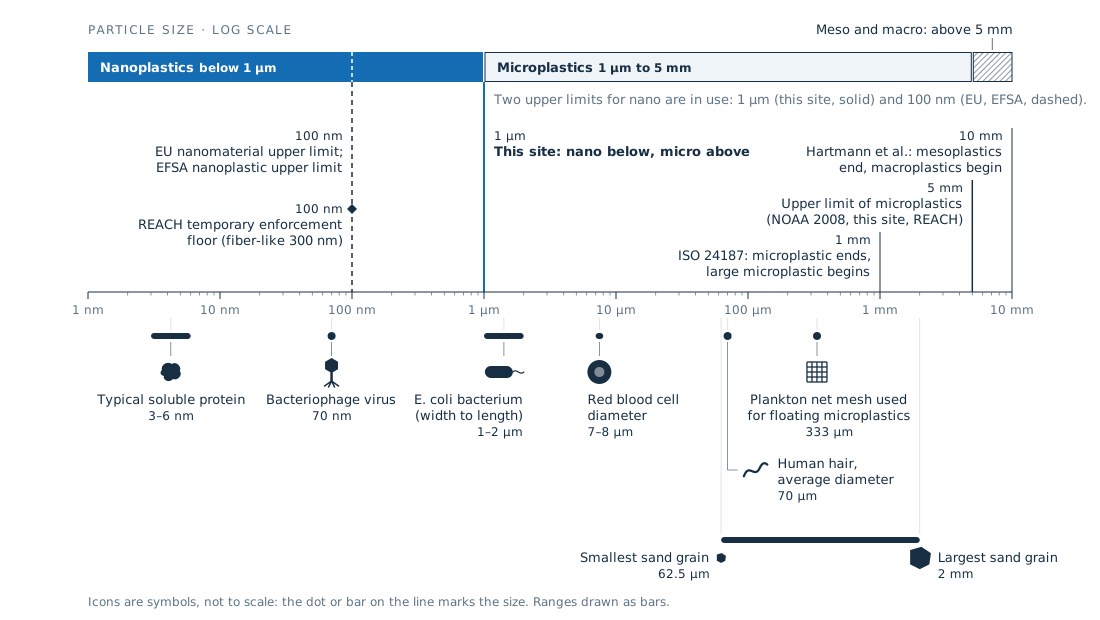
Where nanoplastics sit on the size scale Data graphic
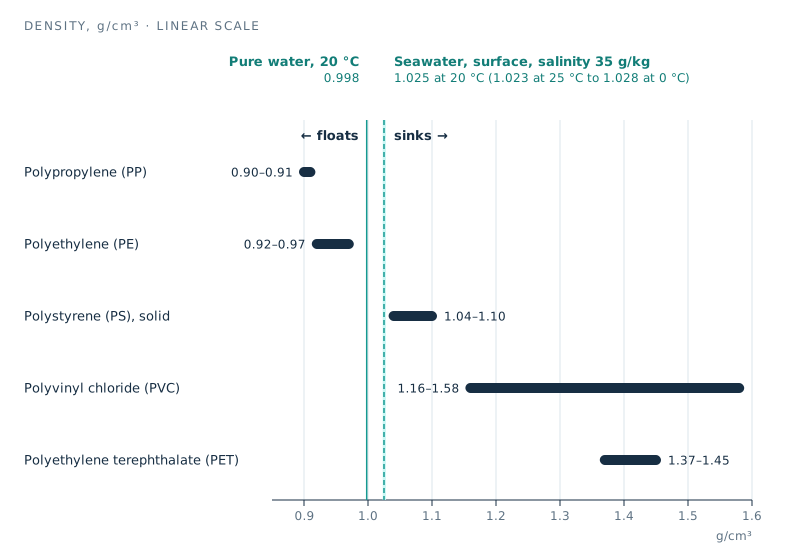
Common plastics by density, compared with water Data graphic
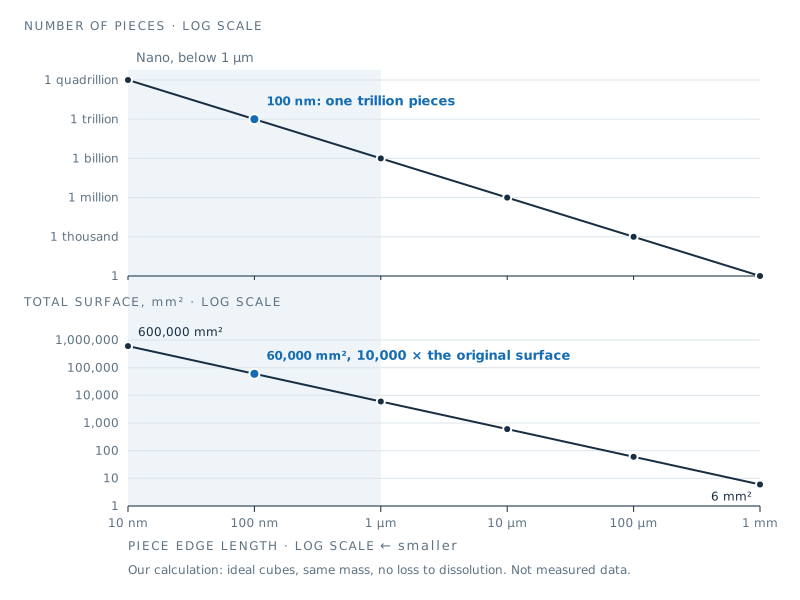
Same mass, smaller pieces: number and total surface of one 1 mm cube Data graphic
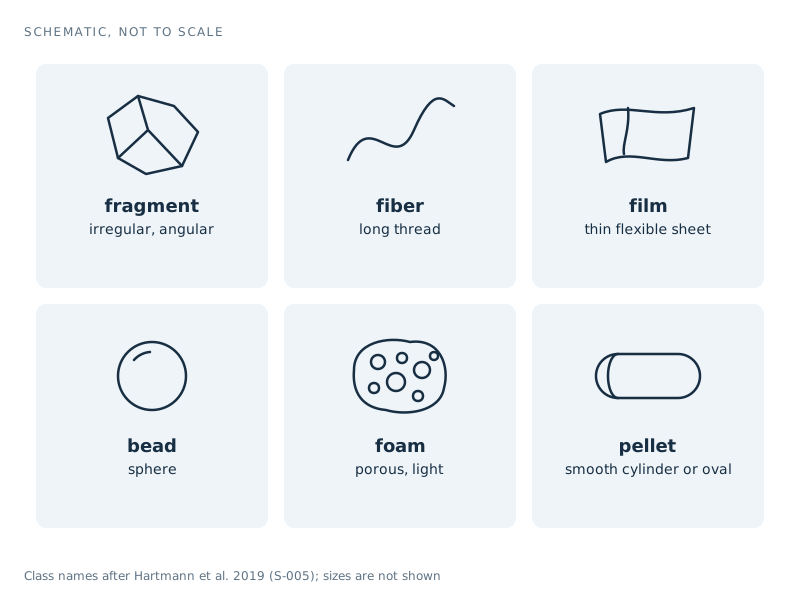
Six shape classes used to sort plastic particles Data graphic
Austria Center Vienna from SSW on 2014-08-22 Real image
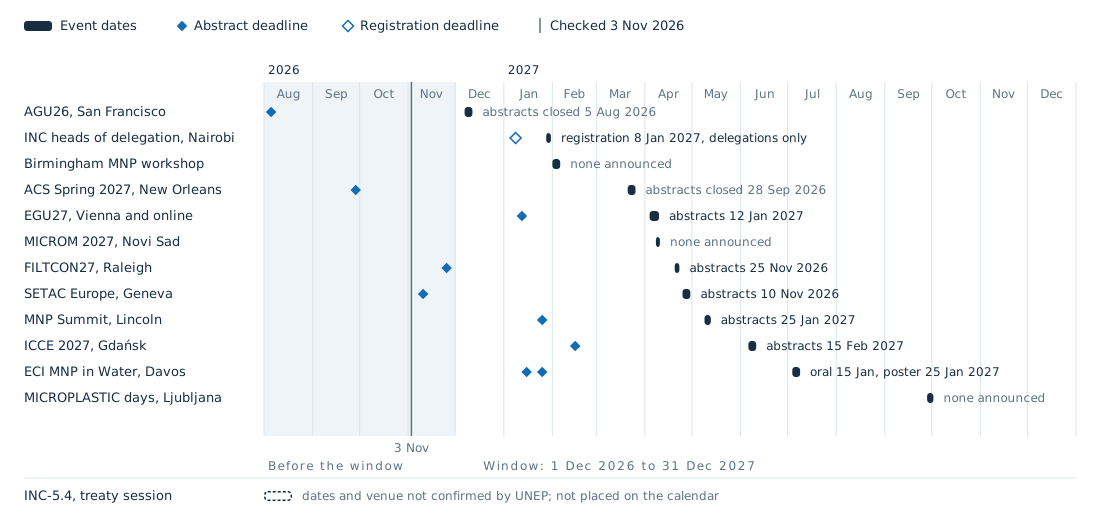
Micro- and nanoplastics events, December 2026 to December 2027 Data graphic
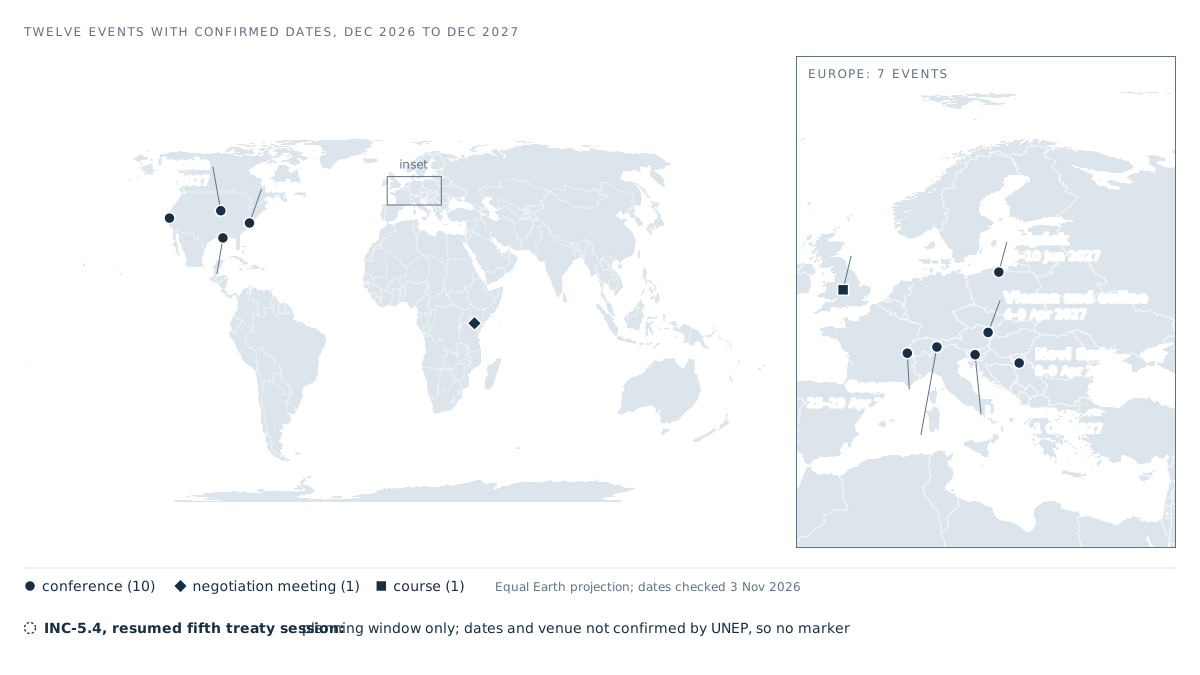
Where the twelve listed events meet, December 2026 to December 2027 Data graphic

Event card template (example: EGU27, Vienna) Data graphic
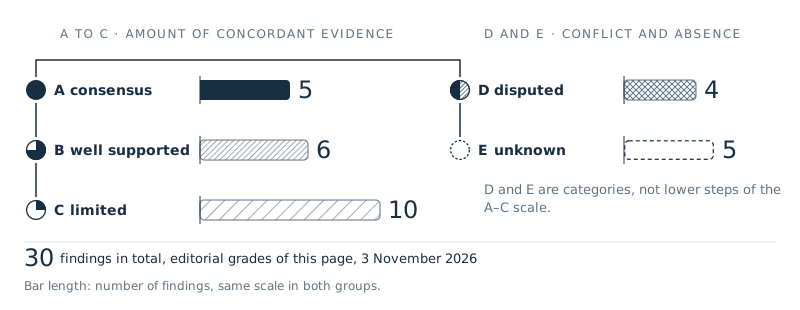
30 findings on the evidence ladder, 3 November 2026 Data graphic
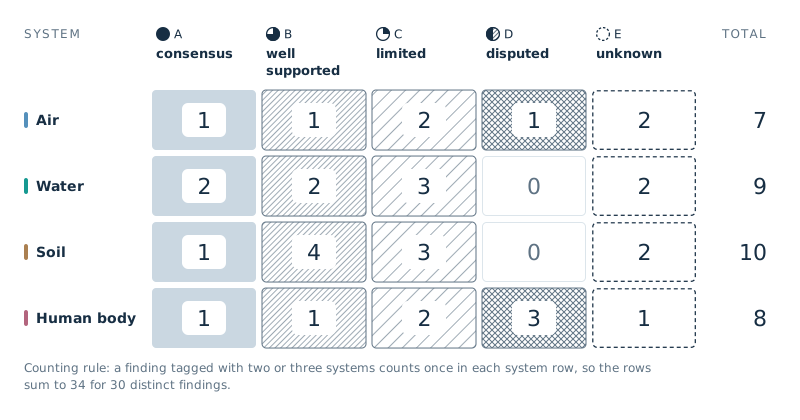
Findings by system and evidence level, 3 November 2026 Data graphic
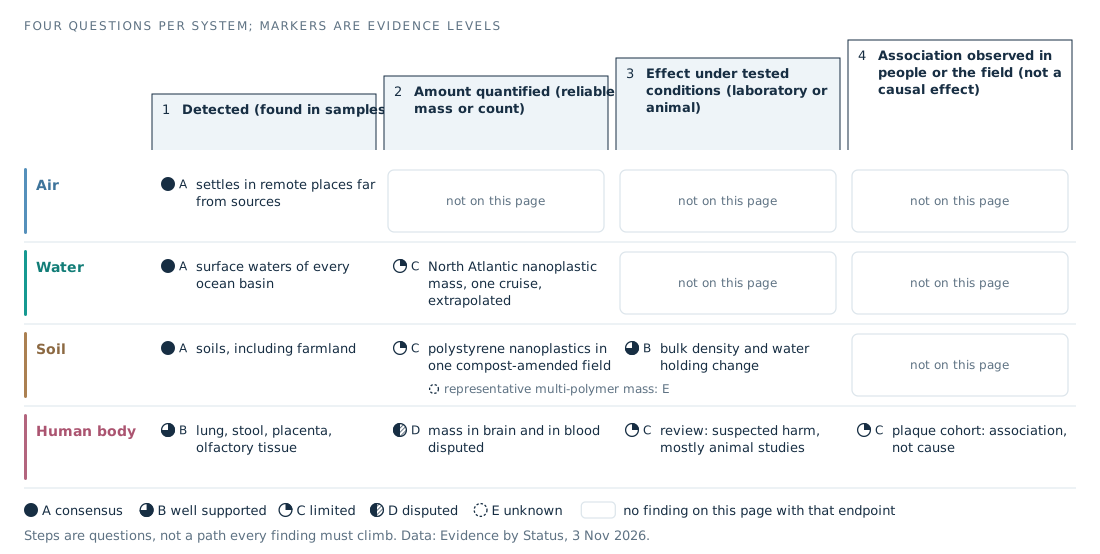
Where each system stands on four questions Data graphic
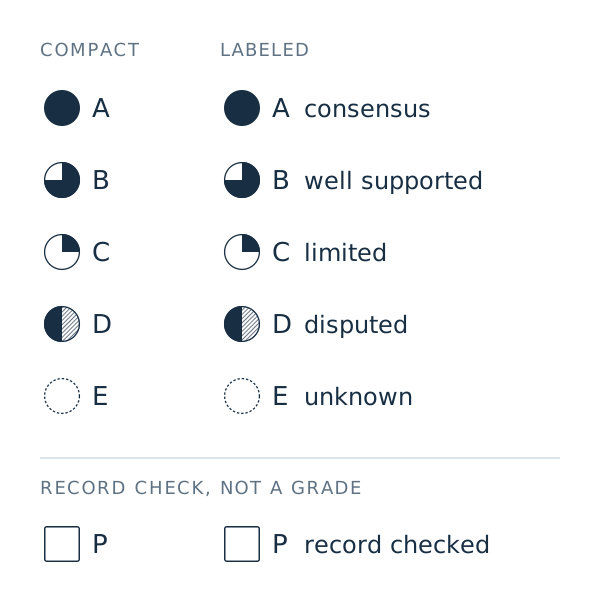
Evidence glyphs A to E and the provenance mark P Data graphic
Particles in focus, out of focus and in darkness (illustration) Illustration · AI generated
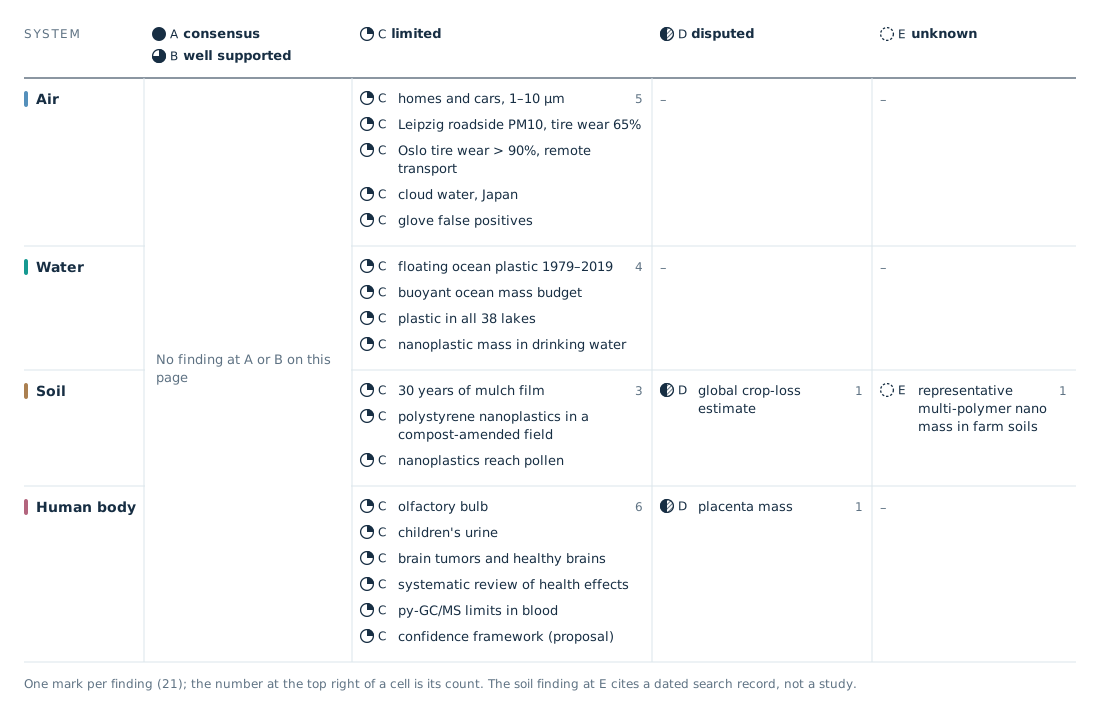
The findings on this page by system and evidence level Data graphic
Atmospheric deposition monitoring site visit Real image
Atmospheric Wet Deposition Sampler (NADP.jpg) Real image
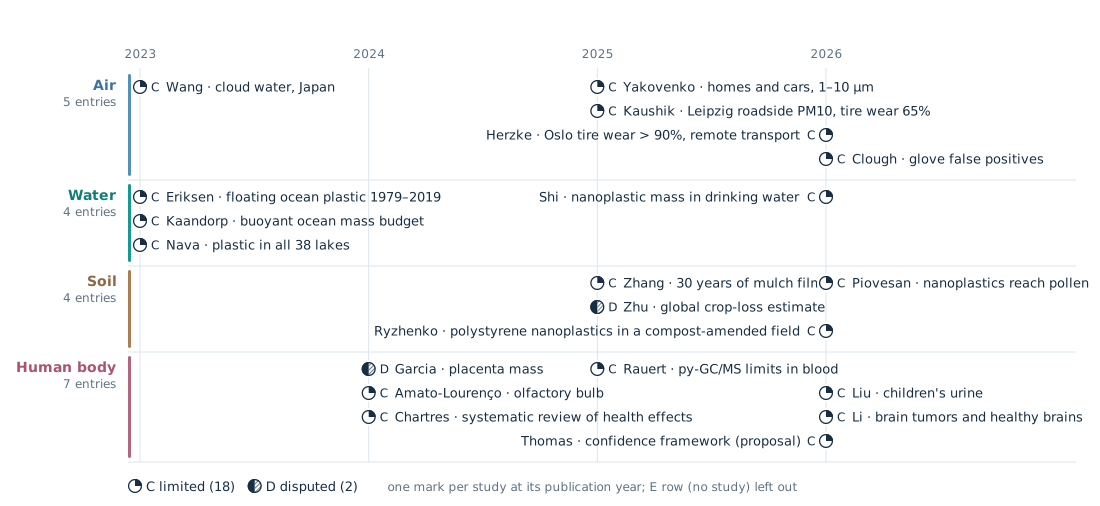
The studies on this page by year and system Data graphic
Lung air sacs with a few plastic fragments (illustration) Illustration · AI generated
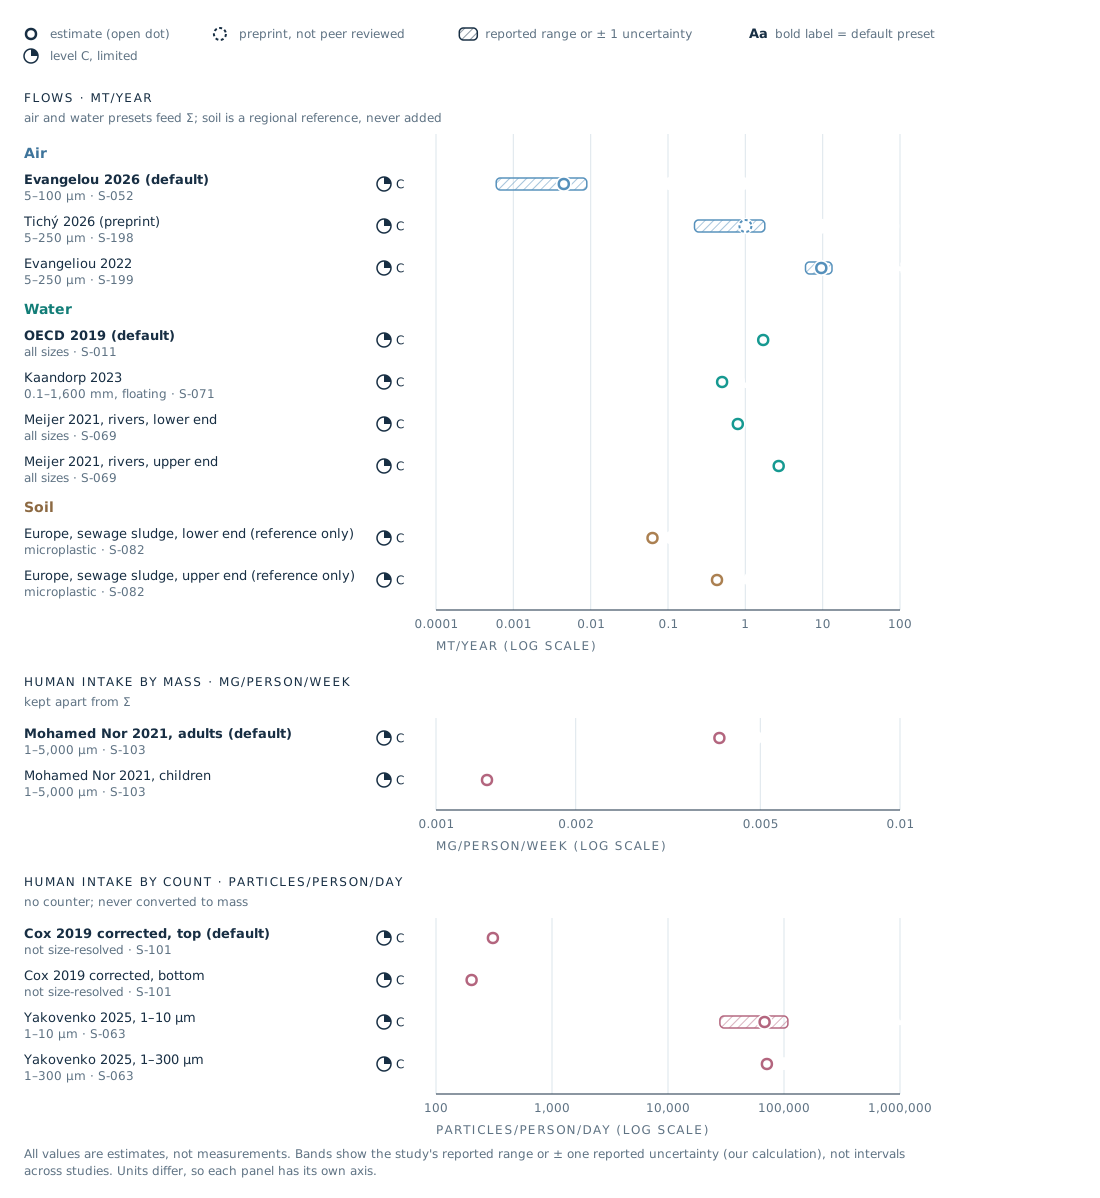
Every v7 preset on its own scale (log) Data graphic
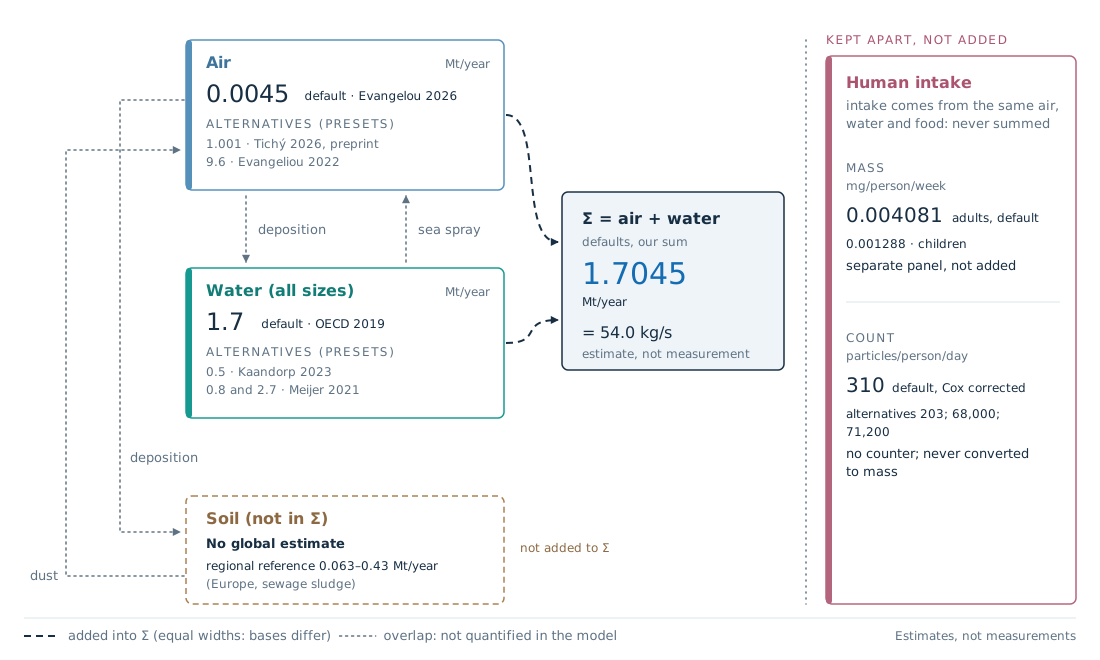
What the v7 counters add, and what they keep apart Data graphic
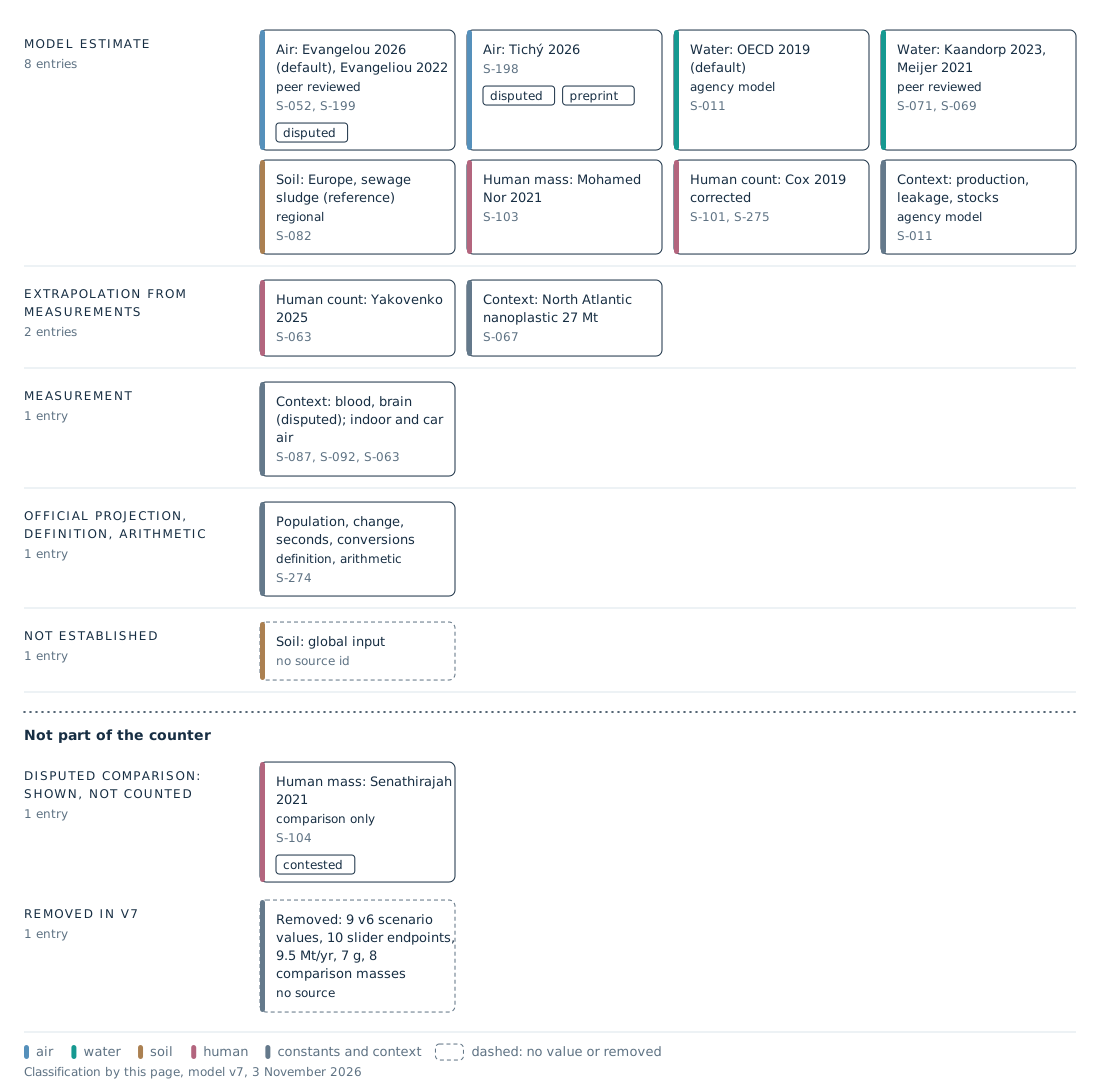
What kind of number is each v7 entry? Data graphic
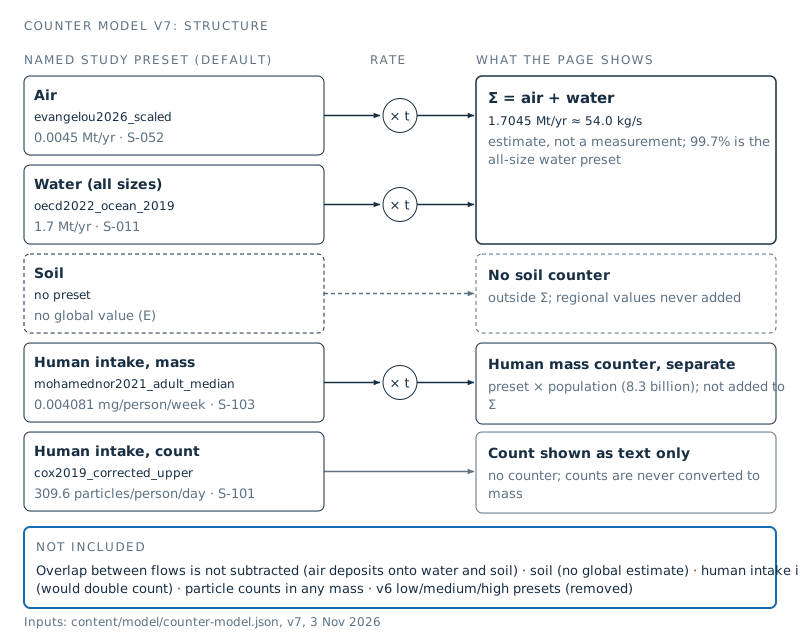
Structure of counter model v7 Data graphic
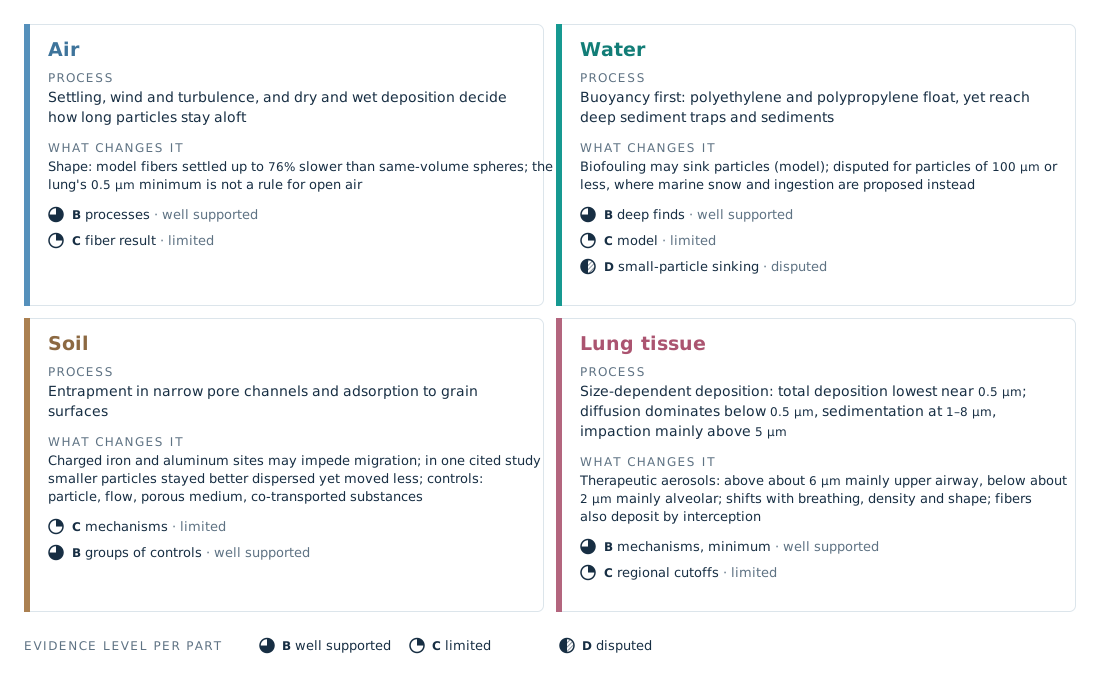
What controls particles in each microworld Data graphic
Fibers and fragments in daylight air (illustration) Illustration · AI generated
Floating and sinking films in sunlit shallows (illustration) Illustration · AI generated
Lung air sacs with capillaries (illustration) Illustration · AI generated
Soil cross-section: fragments held in pores between grains, roots and fungal threads Illustration
The four microworlds (card) Illustration · AI generated
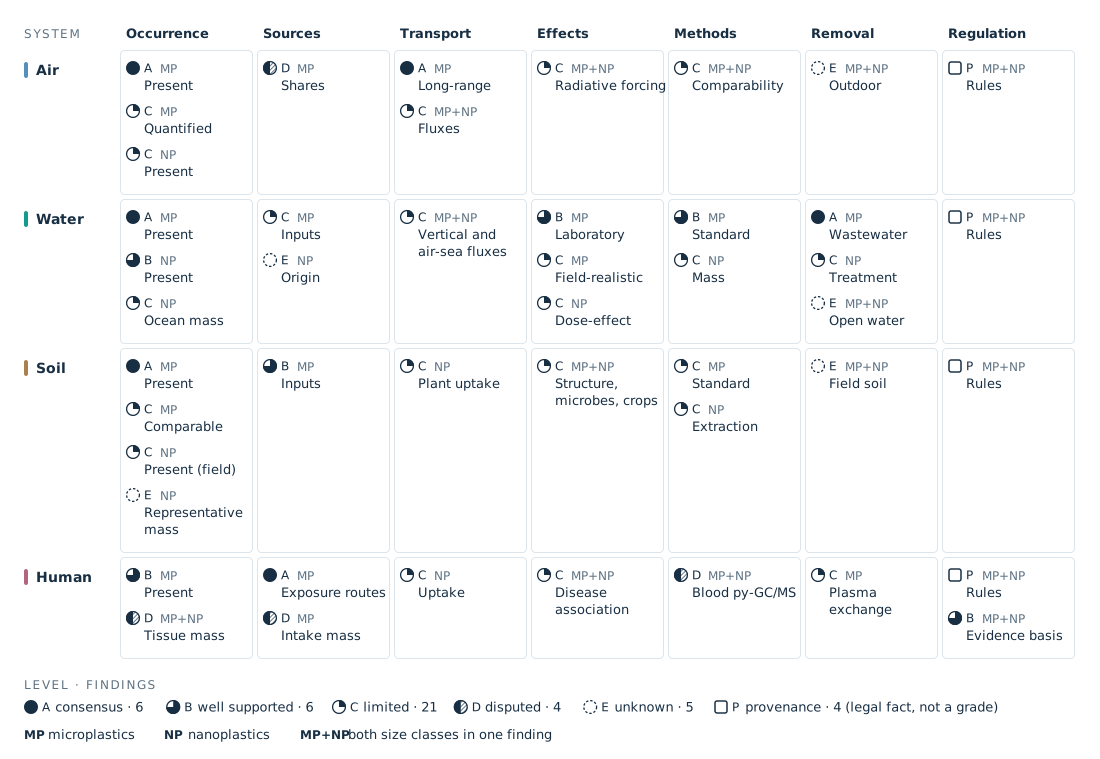
Knowledge map: evidence level of each finding, by system and question Data graphic
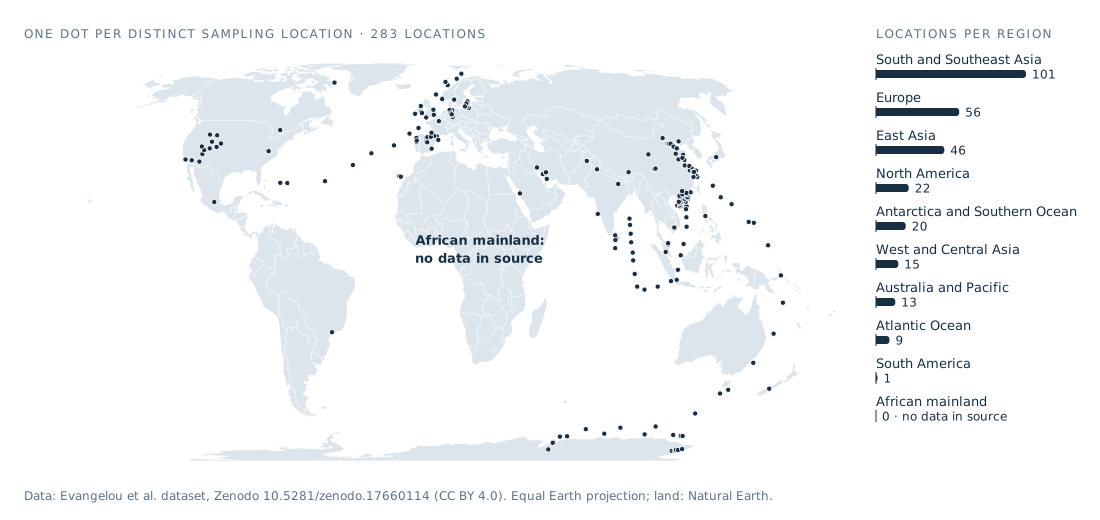
Where airborne microplastics have been measured Data graphic
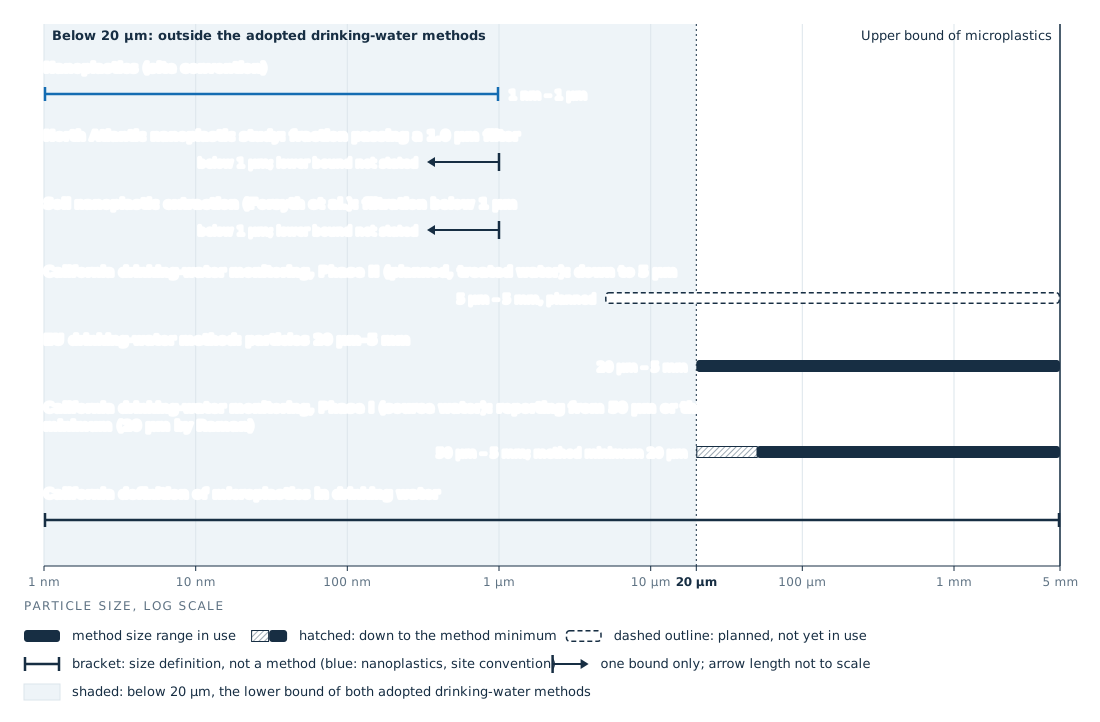
Which particle sizes current methods and rules cover Data graphic
A narrow beam in a dark volume of particles (illustration) Illustration · AI generated
Particles above and below a detection threshold (illustration) Illustration · AI generated
Microphotographs and μFTIR spectra of the main microplastics found in the digested olfactory bulb (Figure 2) Real image
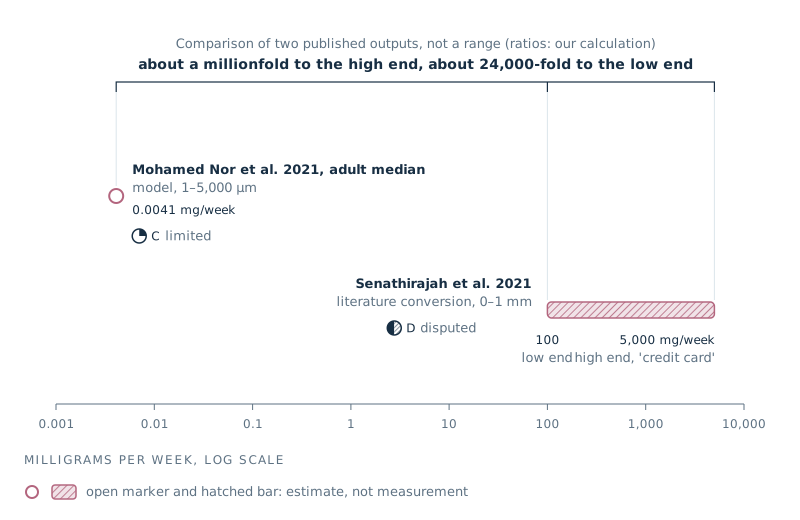
Weekly intake estimates for one adult, log scale Data graphic
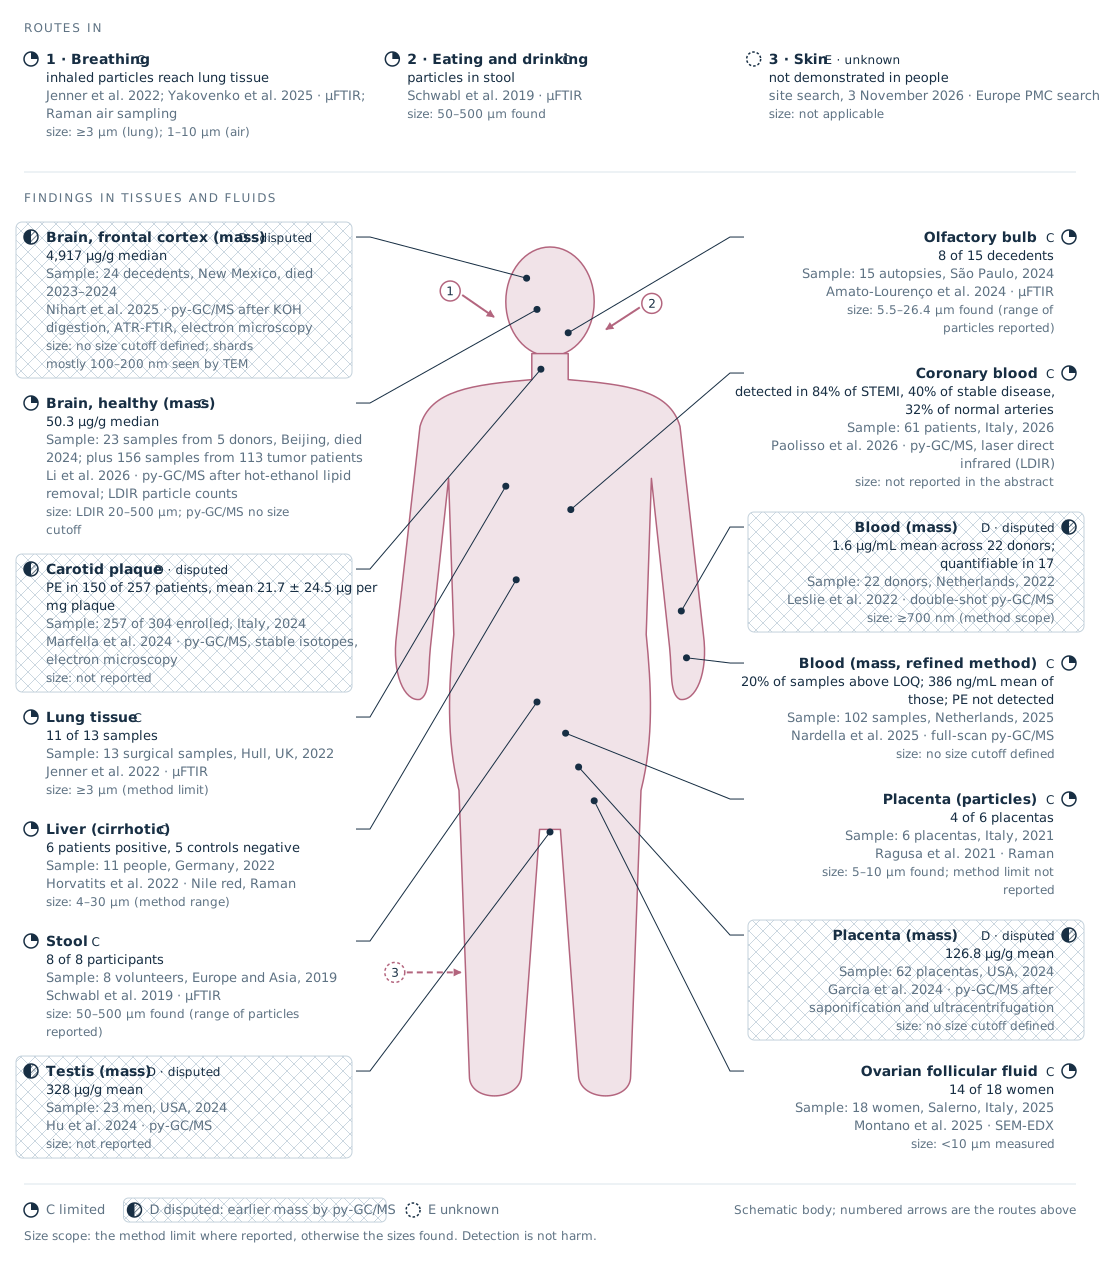
Where plastic particles have been reported in the human body Data graphic
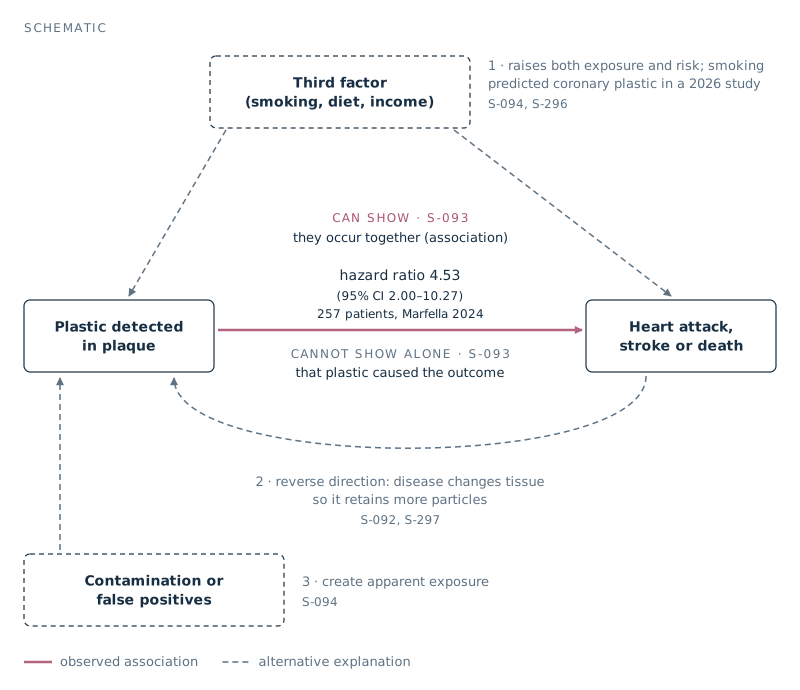
What an observational study can and cannot show Data graphic
A plastic fragment beside a blood cell Illustration
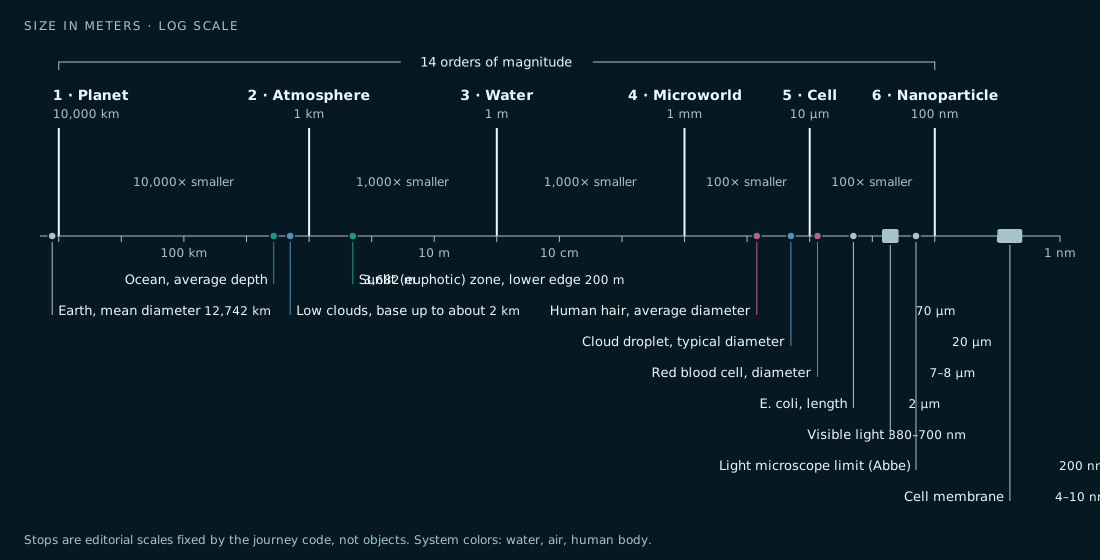
From planet to cell: six stops and reference sizes on one logarithmic ruler Data graphic
Journey frame: ocean through clouds (v6) Illustration · AI generated
Journey frame: particle above a membrane (v6) Illustration · AI generated
From planet to particle: four stops of the journey Illustration
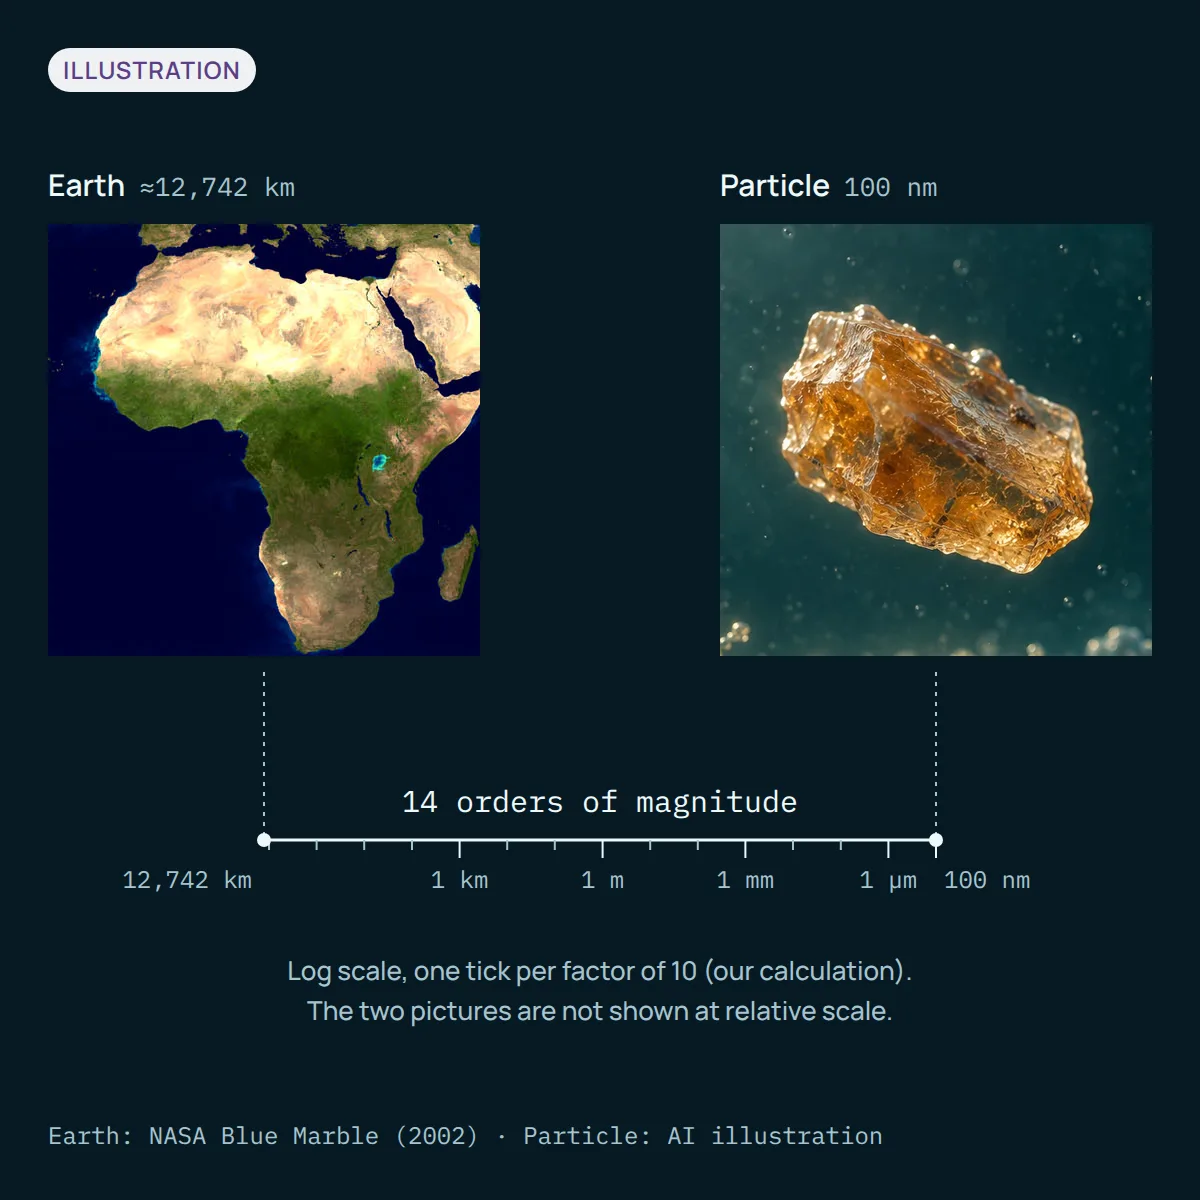
From Earth to a 100 nm particle: 14 orders of magnitude Illustration
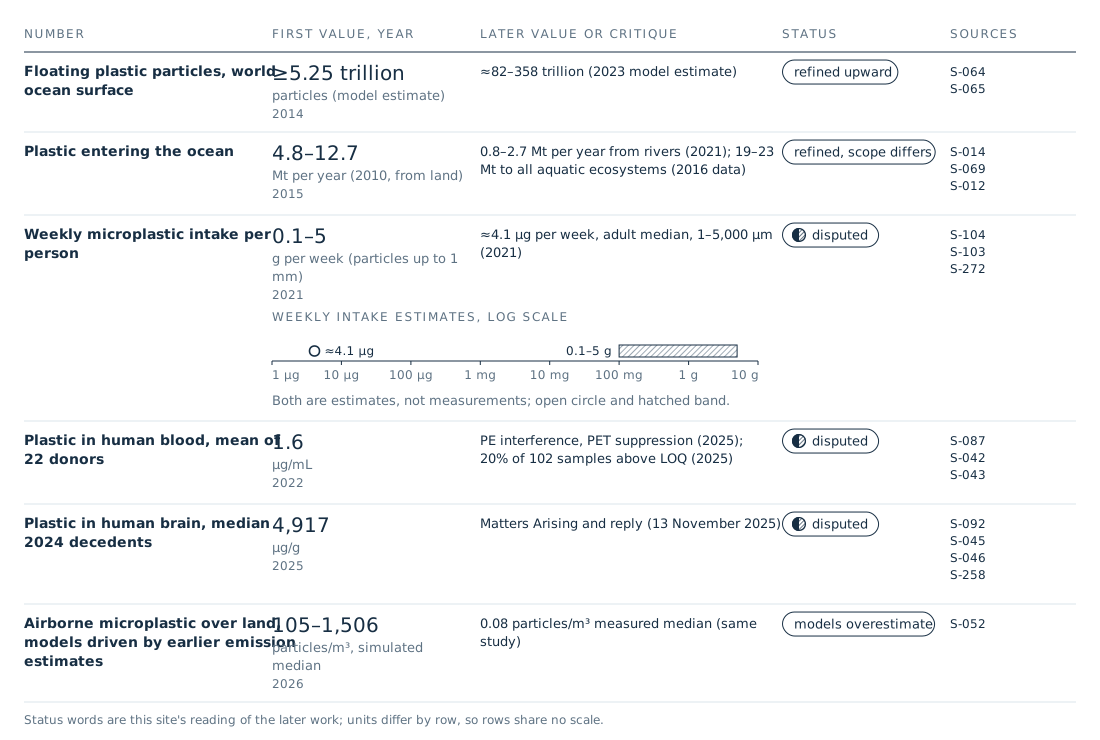
How six famous numbers aged Data graphic
RV Pelagia Real image
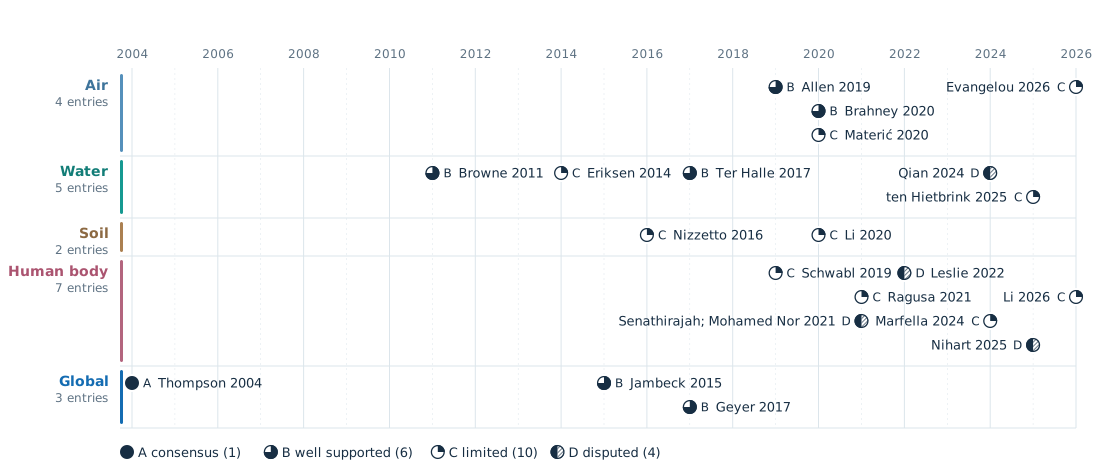
Landmark studies 2004 to 2026 by system and evidence level Data graphic
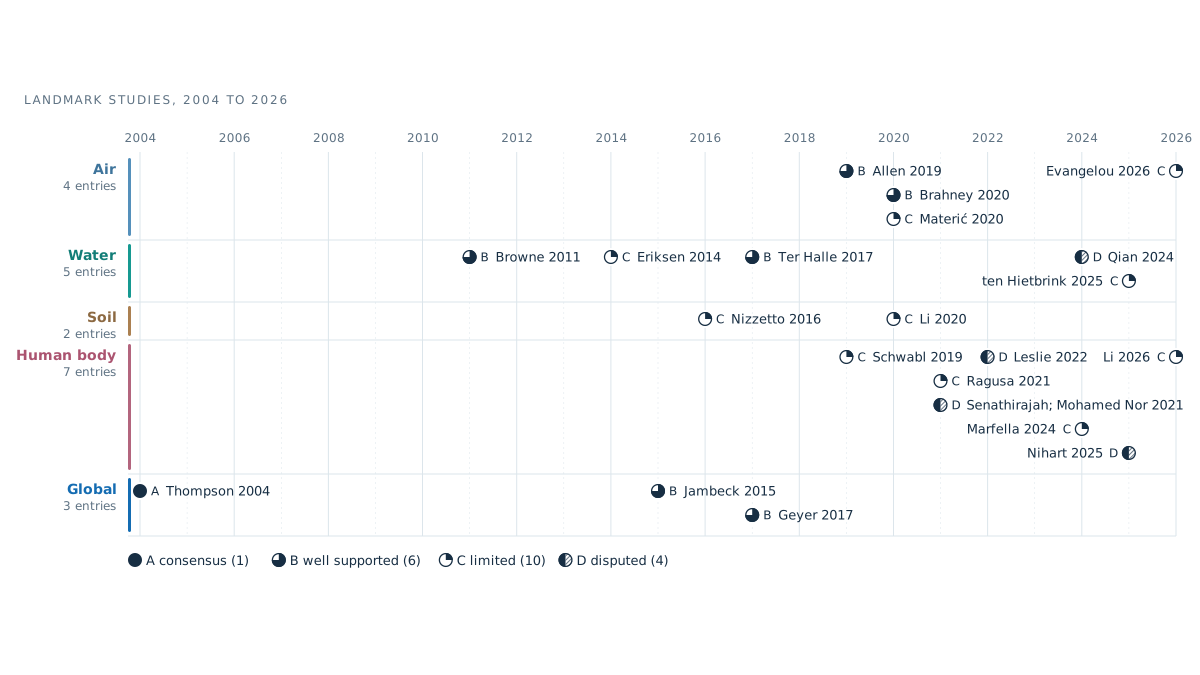
Landmark studies 2004 to 2026 by system and evidence level Data graphic
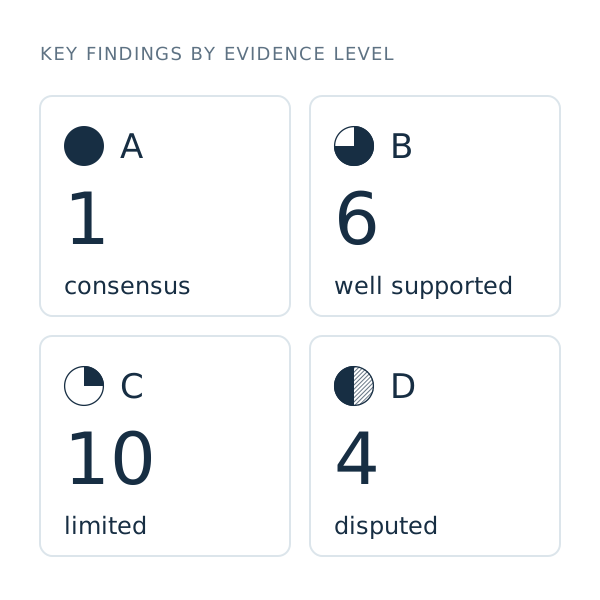
Key findings of the 21 entries by evidence level Data graphic
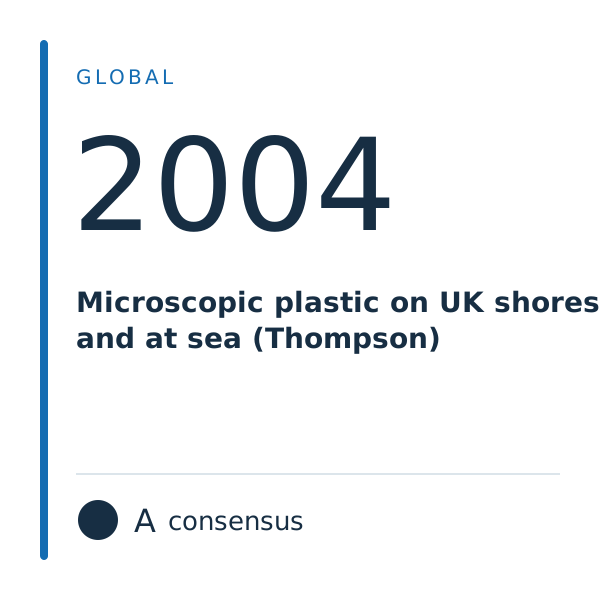
Study card template (example: Thompson 2004) Data graphic
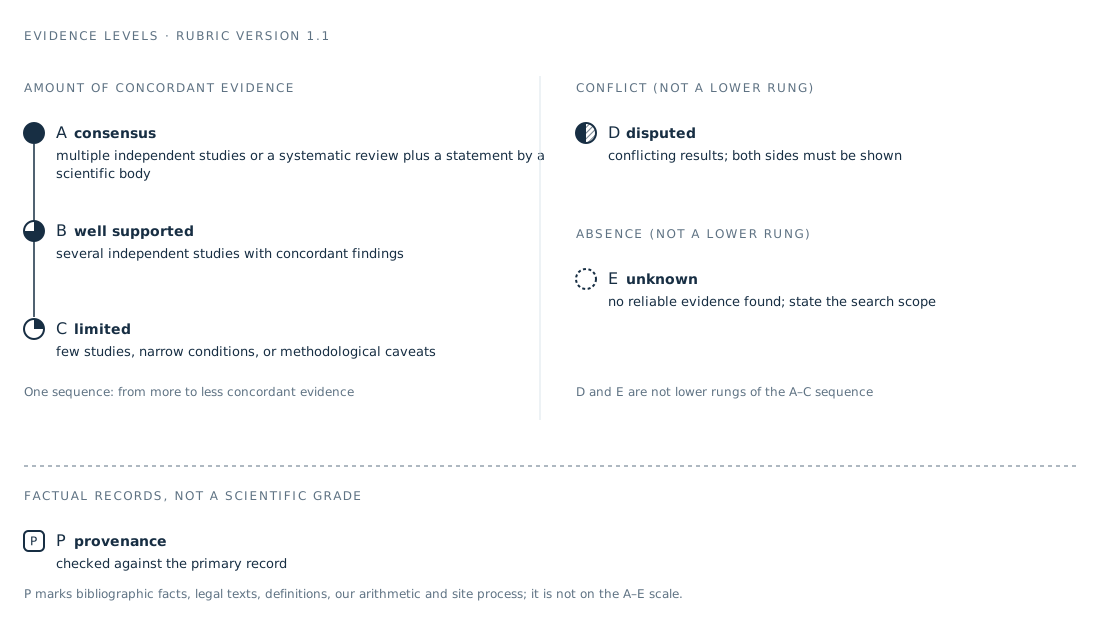
The evidence levels of this site (rubric version 1.1) and the separate provenance mark Data graphic
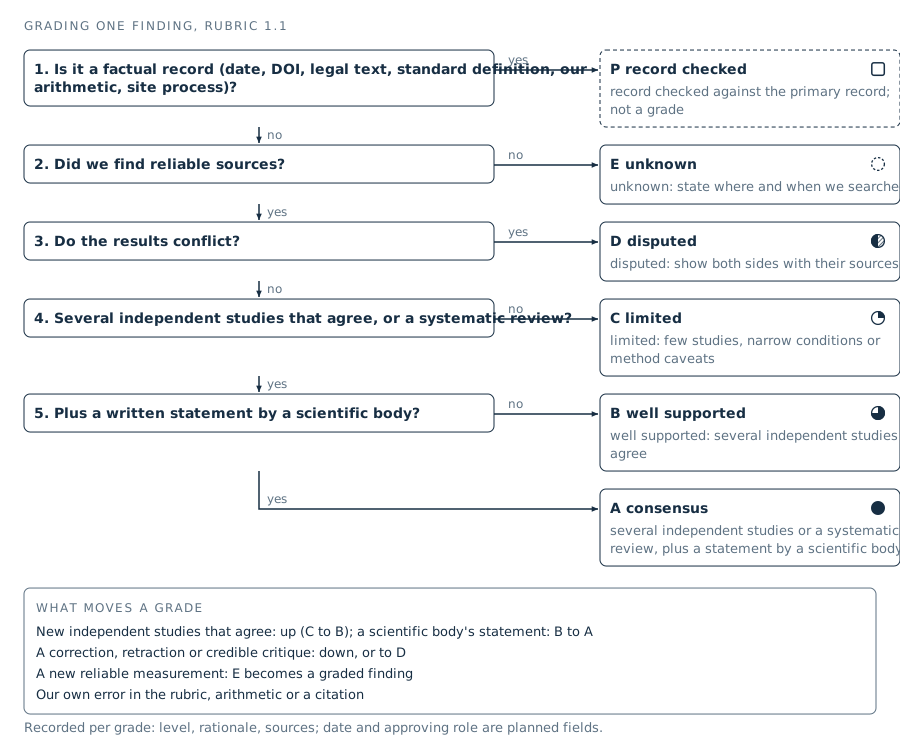
Decision flow for grading one finding Data graphic
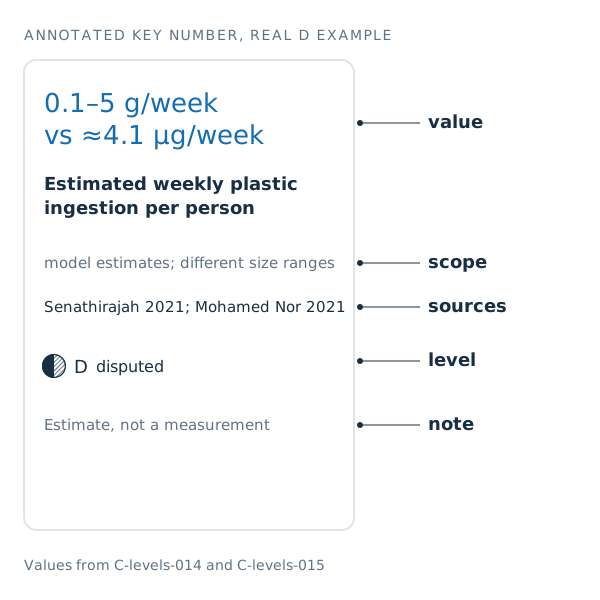
Annotated graded key number Data graphic
Fig. 6 (left): small polypropylene particle on Al-coated PC filter and Raman spectra depending on laser focus Real image
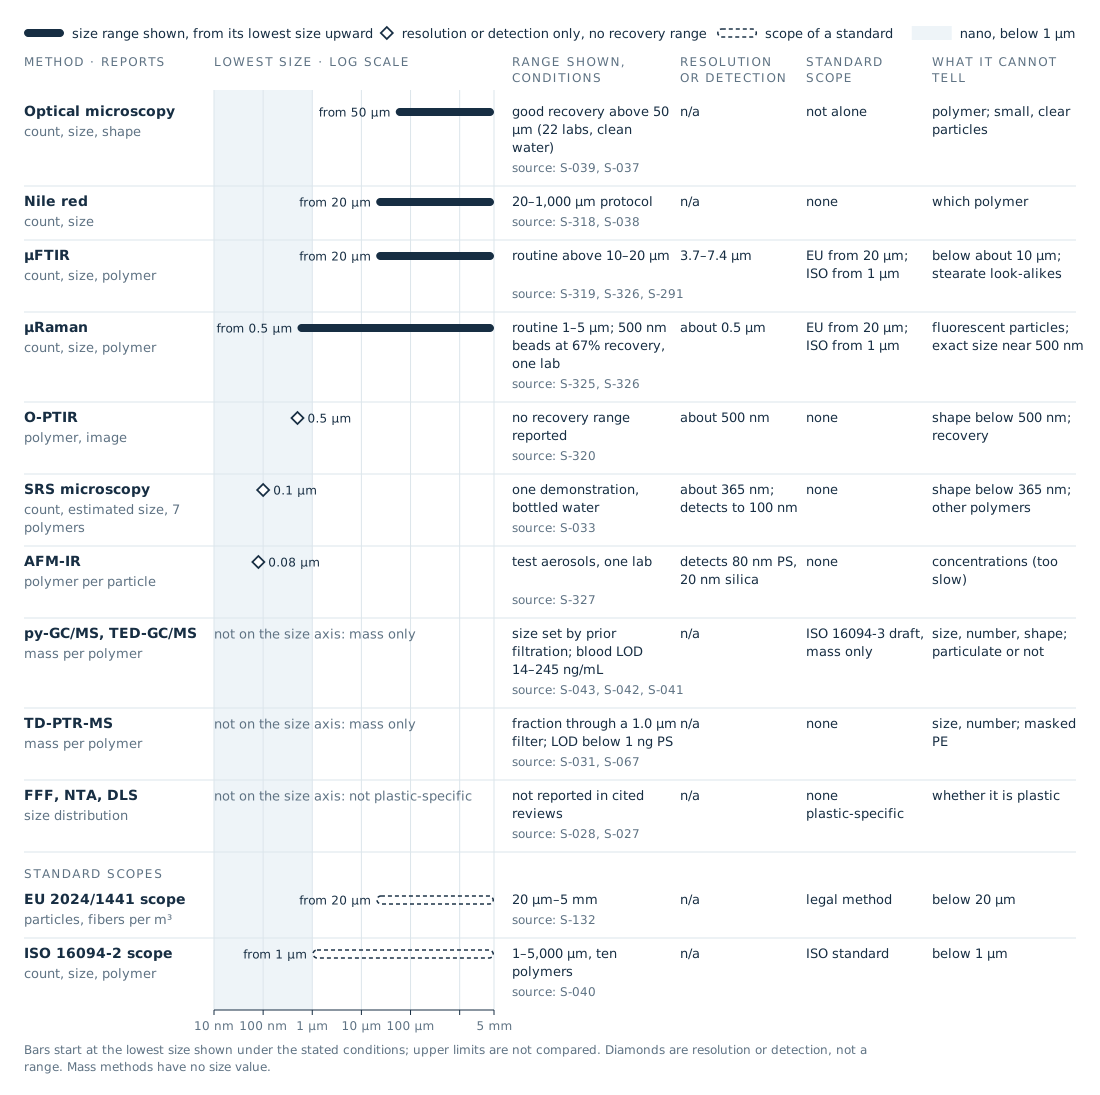
What each method can tell, and what it cannot Data graphic
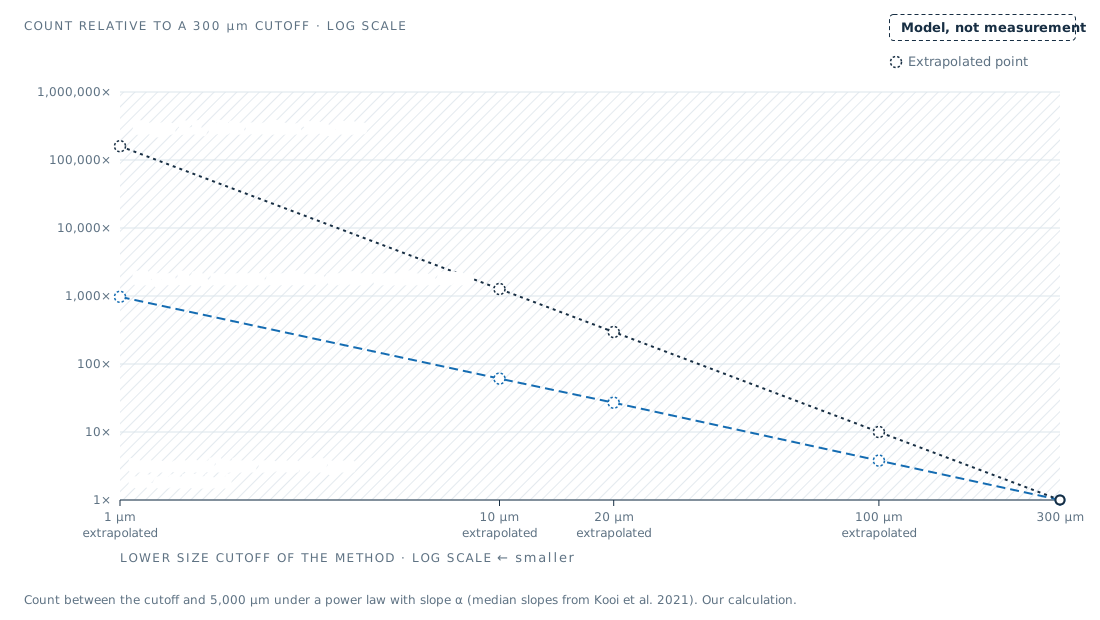
Same water, different cutoff: modeled count relative to a 300 µm cutoff Data graphic
Where plastic can enter a sample at the lab bench (illustration) Illustration · AI generated
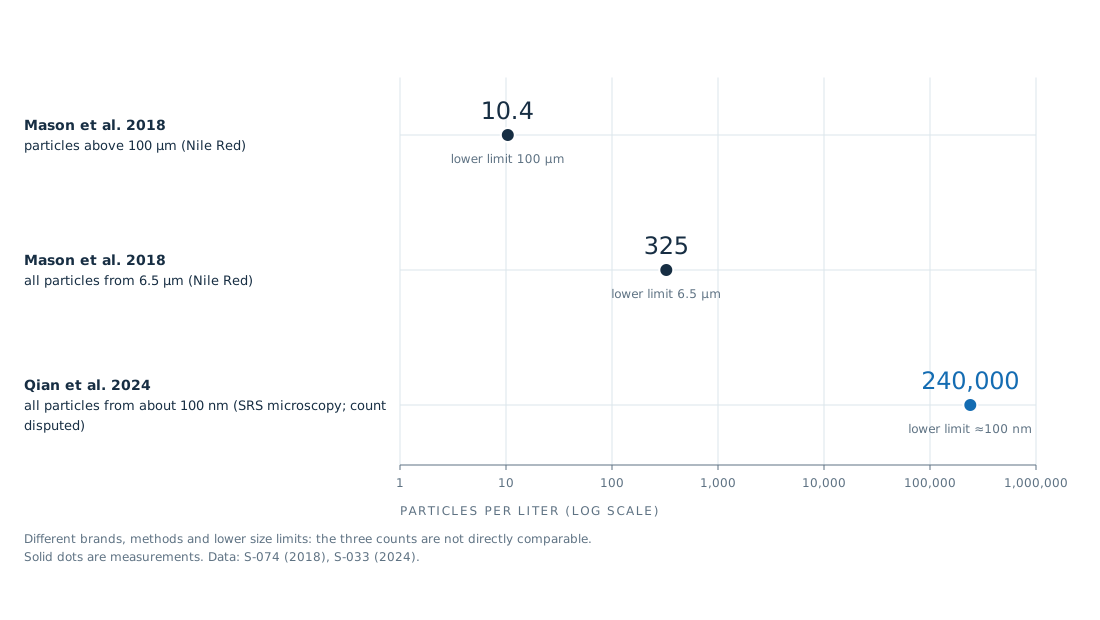
Bottled water: reported particles per liter and the smallest size each count includes Data graphic
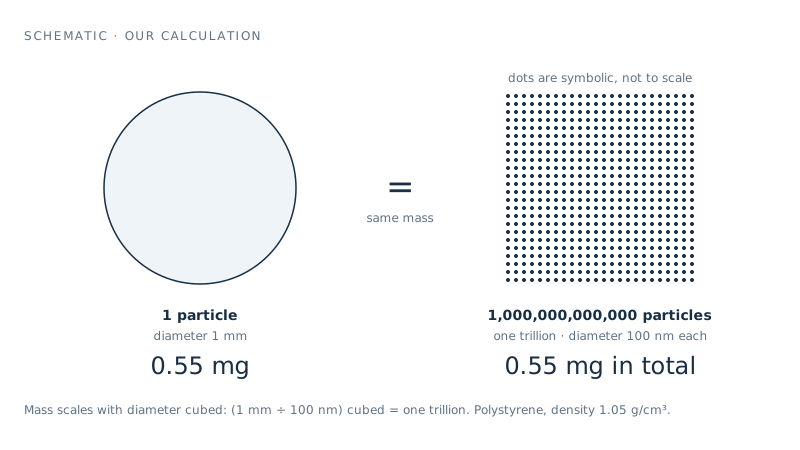
Same mass, different count: one 1 mm sphere versus 100 nm spheres Data graphic
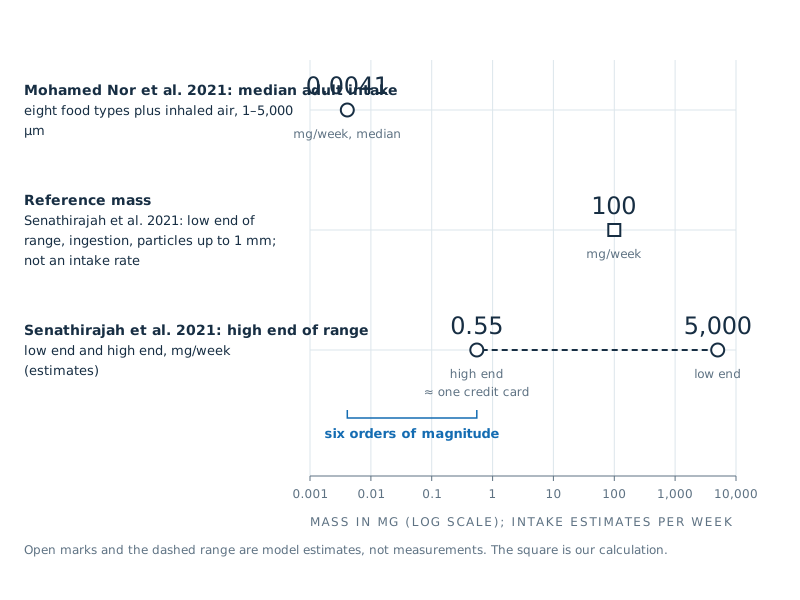
Mass equivalent of one week's modeled intake for adults (mg), log scale, with reference objects shown apart Data graphic
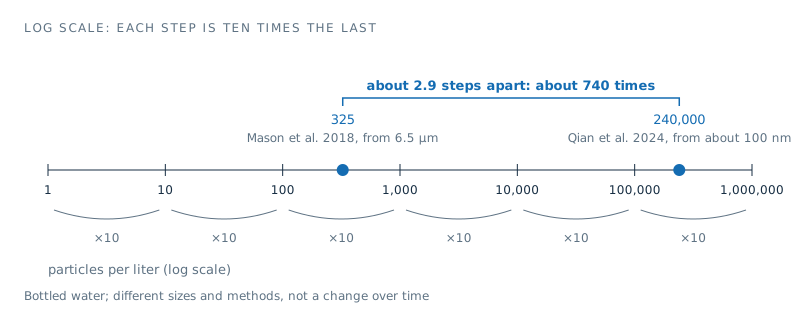
How to read a log scale Data graphic
How this site draws measurements and estimates Data graphic
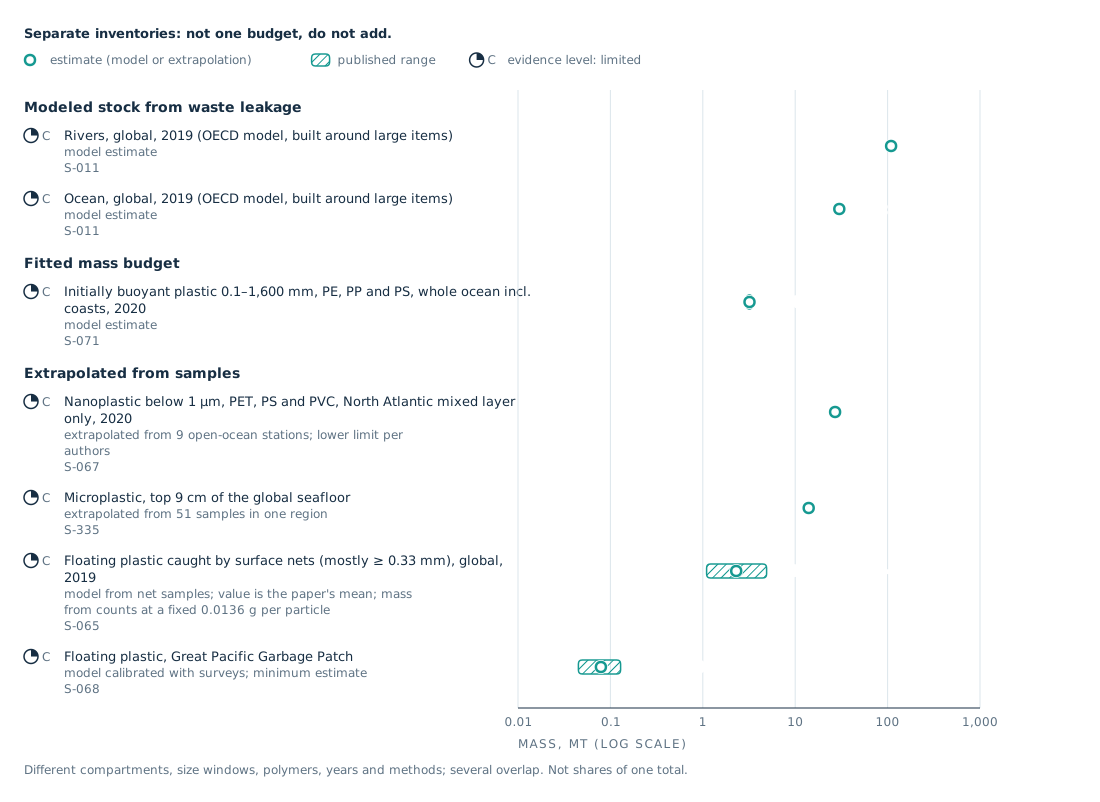
Separate published estimates of plastic mass in rivers and the ocean, not one budget Data graphic
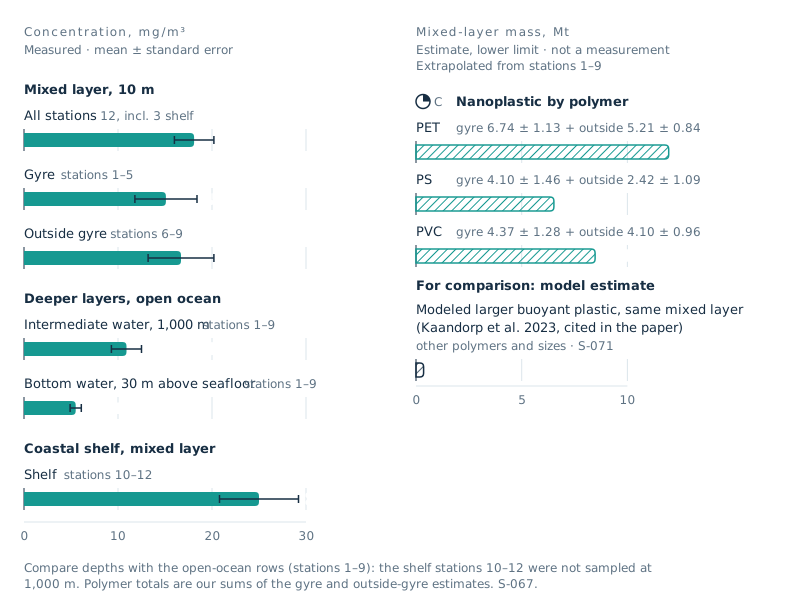
Nanoplastics in the North Atlantic, November 2020: concentration by depth and estimated mass by polymer Data graphic
Map of the 12 hydrocast stations along a transect crossing the North Atlantic (Figure 1) Real image
A plastic fragment sinking in marine snow (illustration) Illustration · AI generated
Nurdles - plastic "gravel" Real image
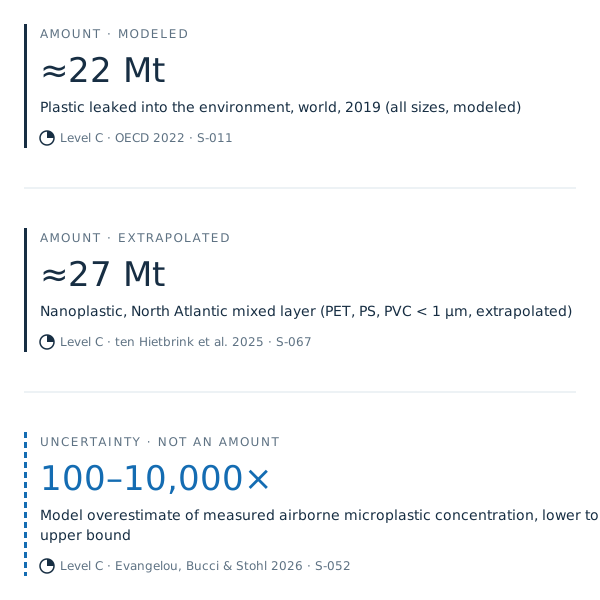
Three numbers at three scales Data graphic
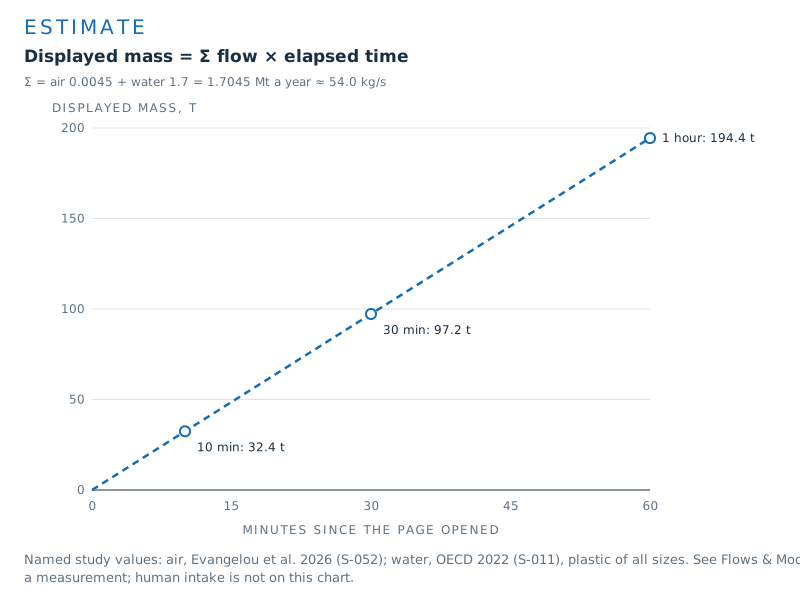
How the counters run: flow × elapsed time Data graphic
Sea spray drifting over a coastal soil bank (illustration) Illustration · AI generated

Lane legend: real image, data graphic, illustration Data graphic
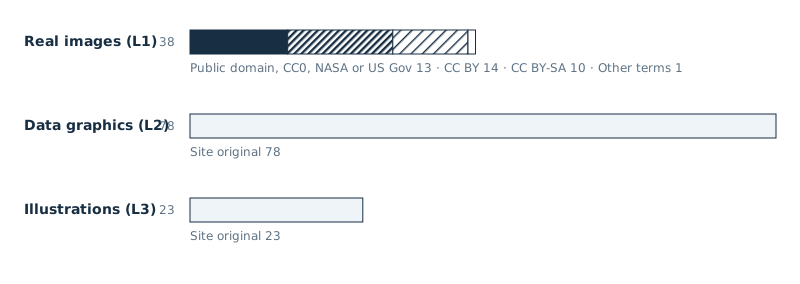
Images on this site by lane and license Data graphic
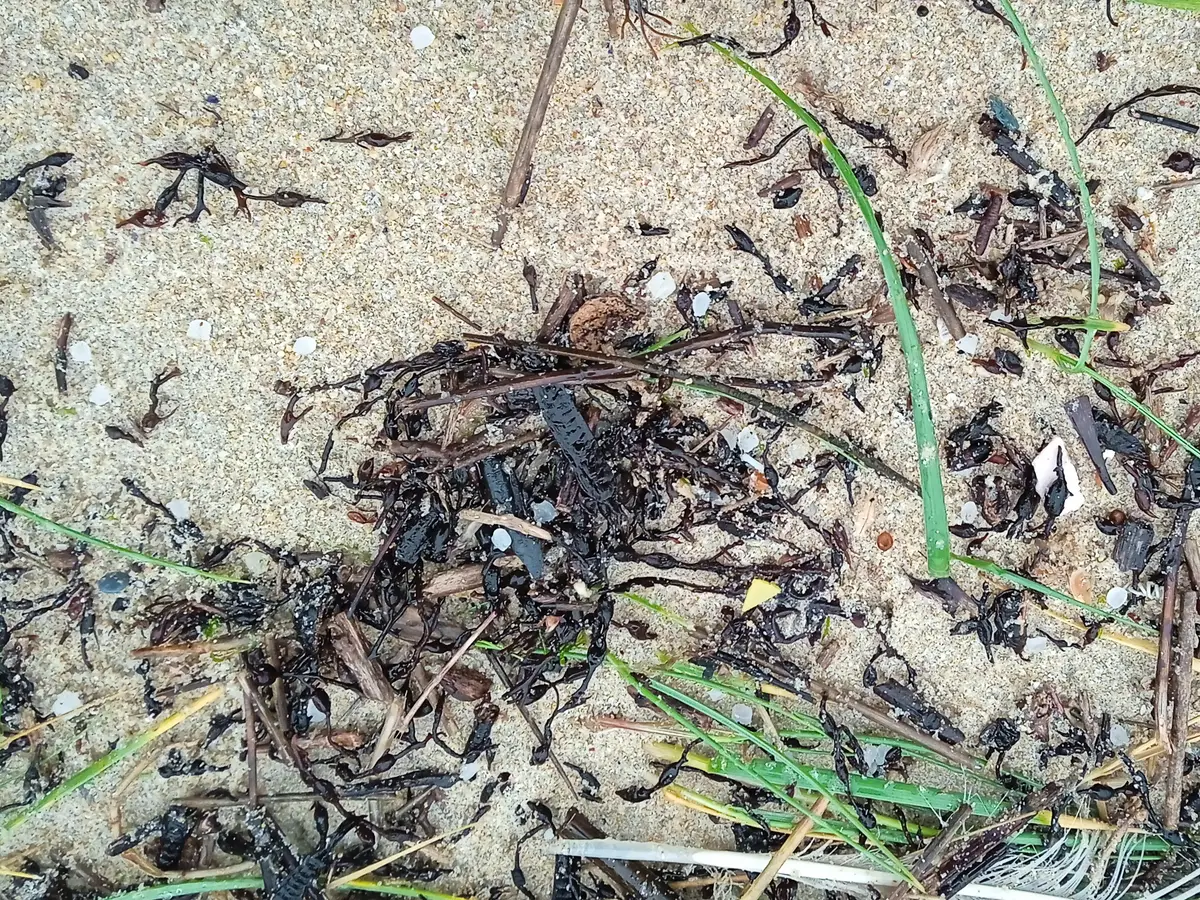
Plastic pellets on Ladeira beach, Corrubedo Real image
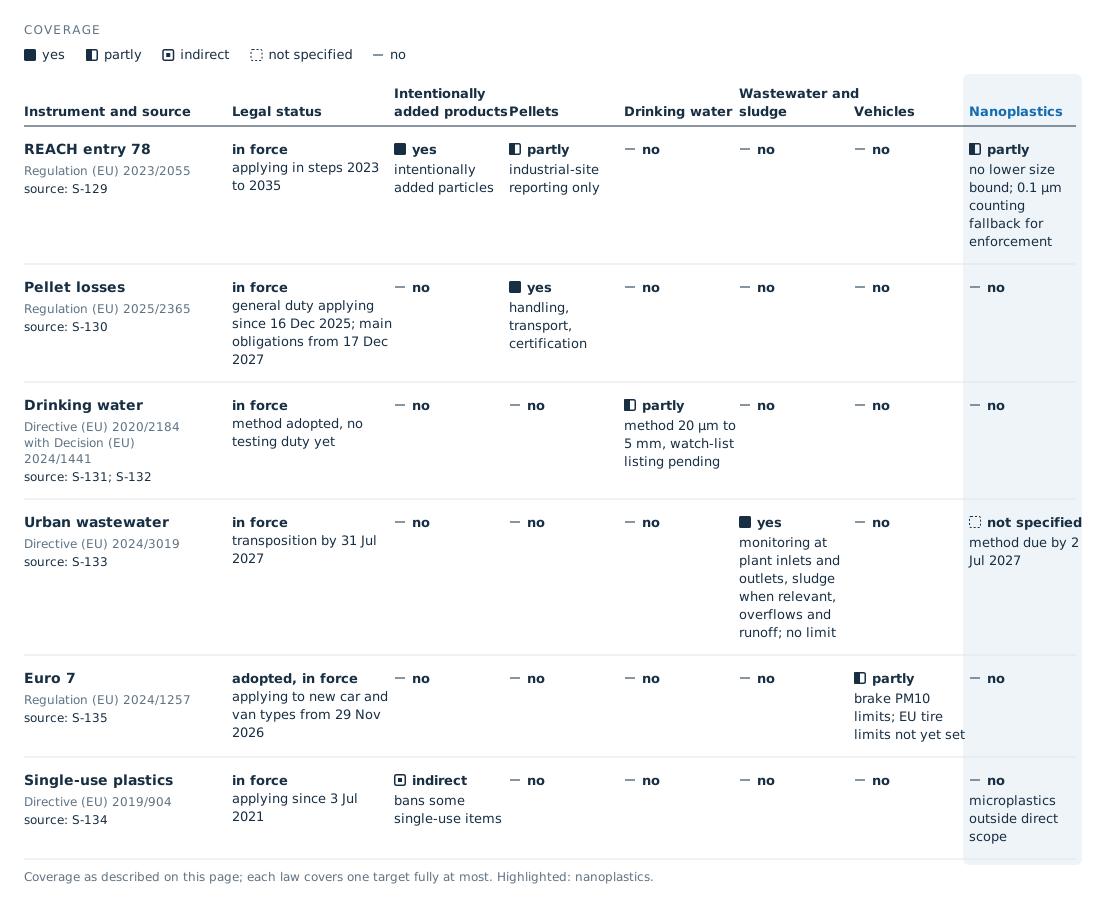
What each EU instrument covers Data graphic
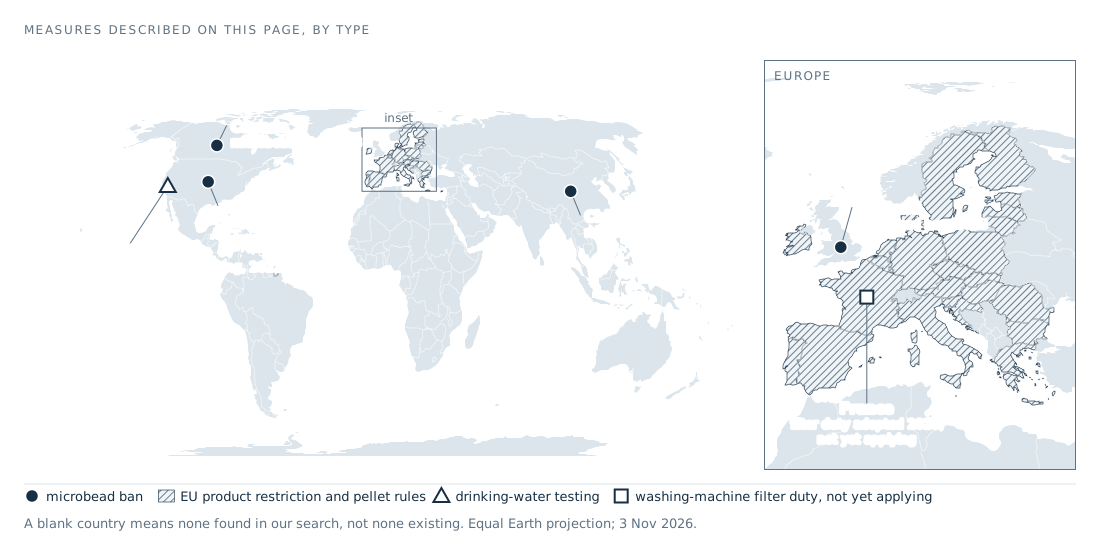
Where the measures on this page apply, by type Data graphic
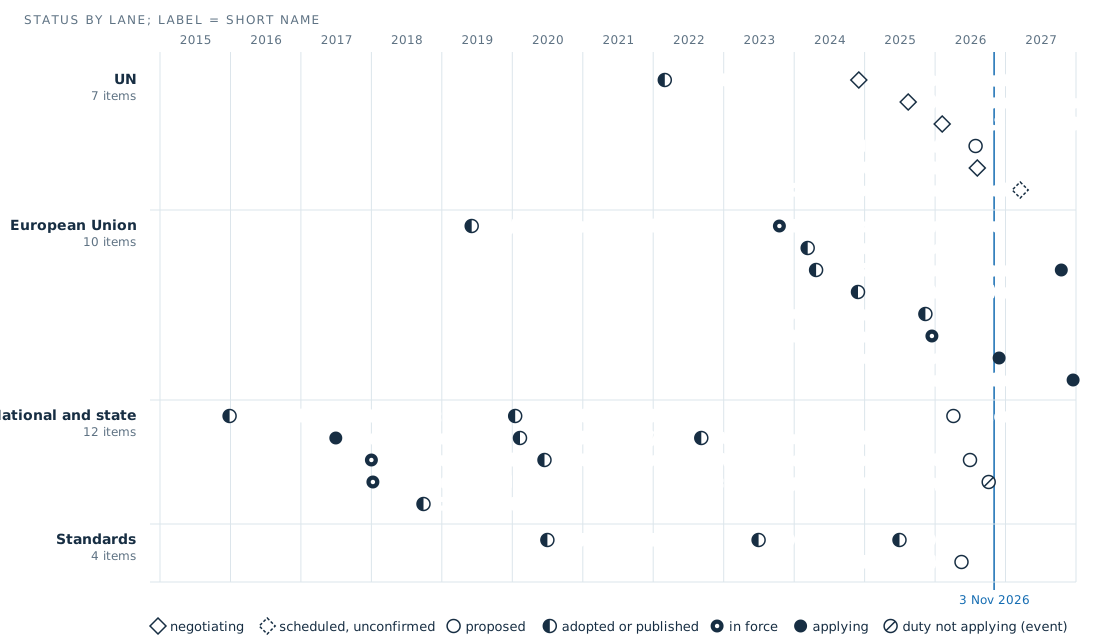
Rules and treaty sessions on micro- and nanoplastics, 2015 to 2027 Data graphic
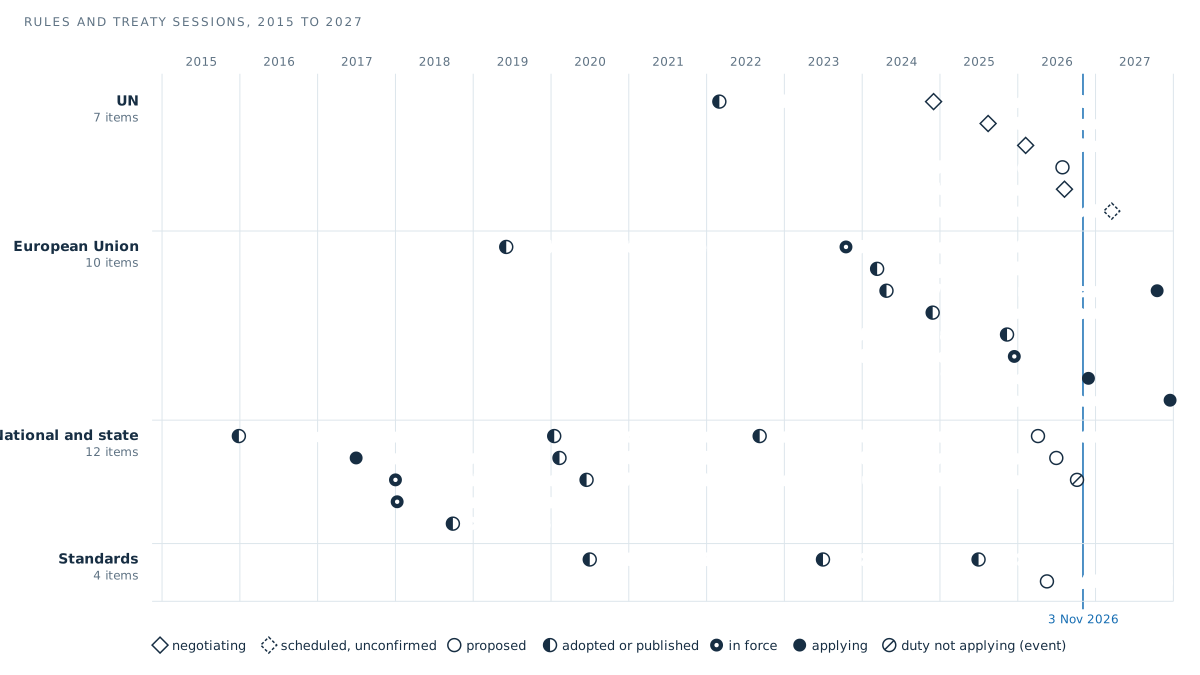
Rules and treaty sessions on micro- and nanoplastics, 2015 to 2027 Data graphic

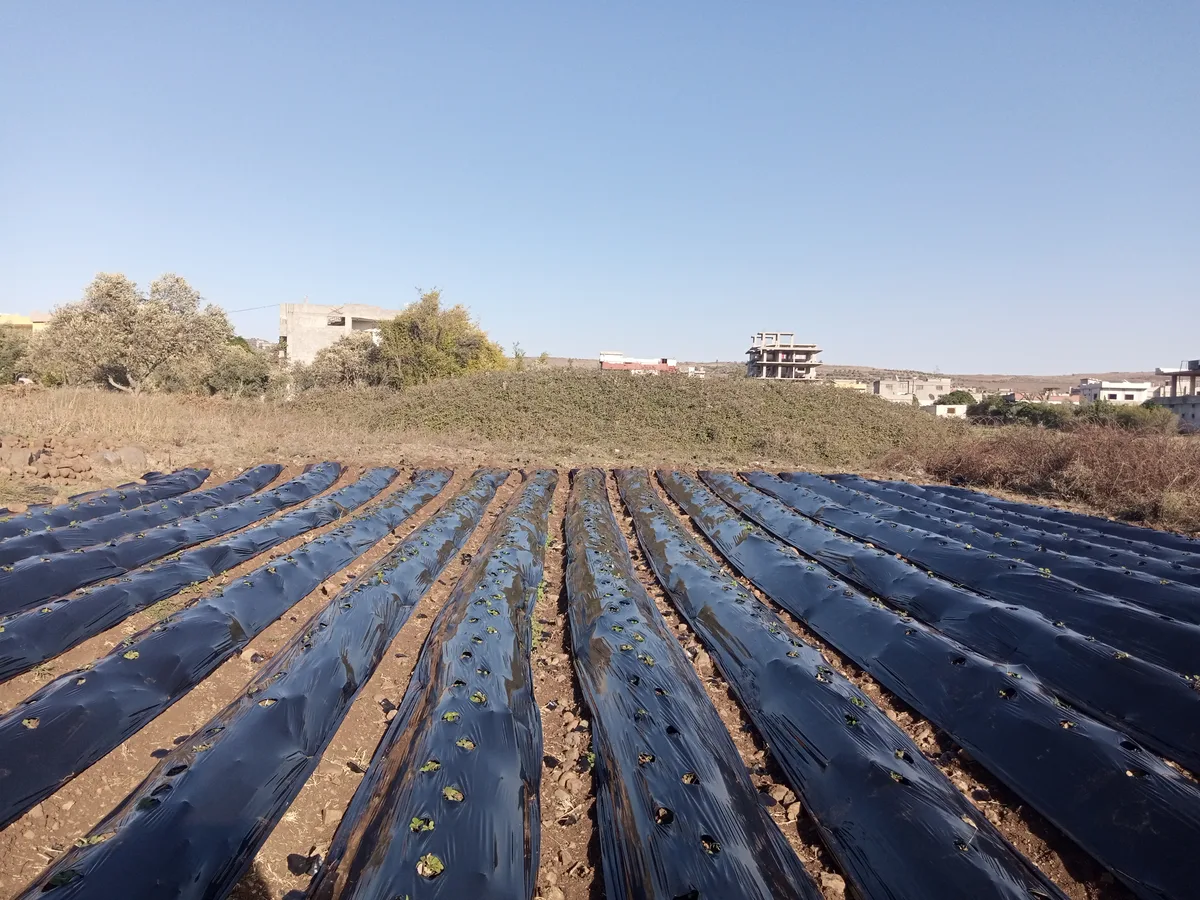
Strawberry field with black plastic mulching in Umm Haratayn al-Gharbiyah Real image
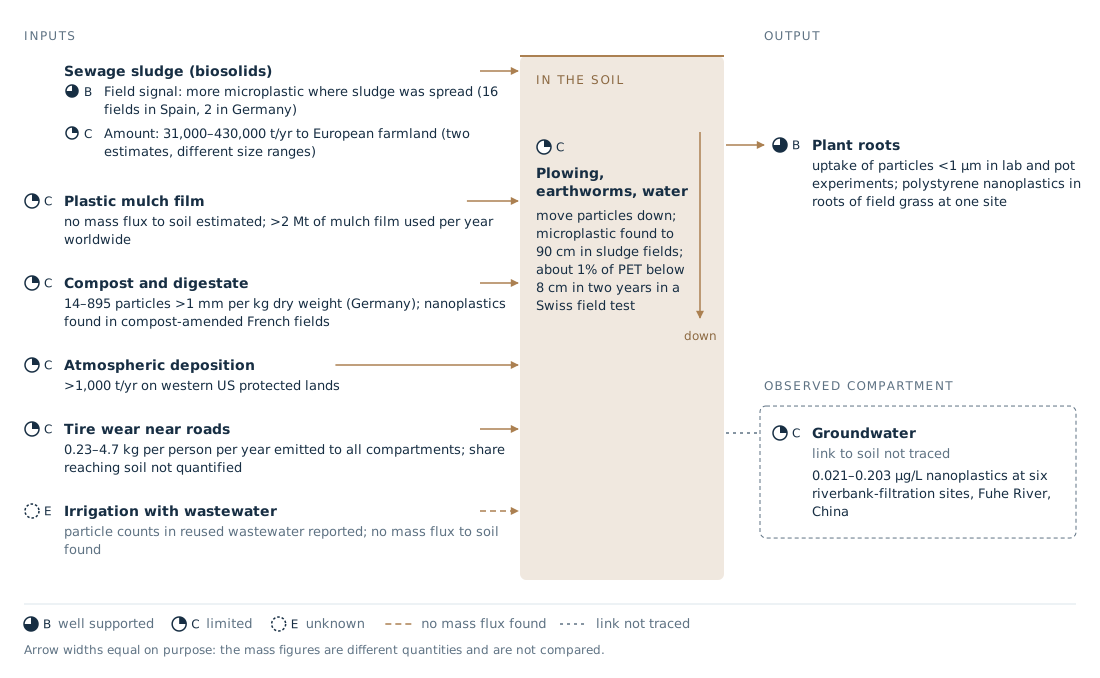
How plastic gets into soil, and what we know about each route Data graphic
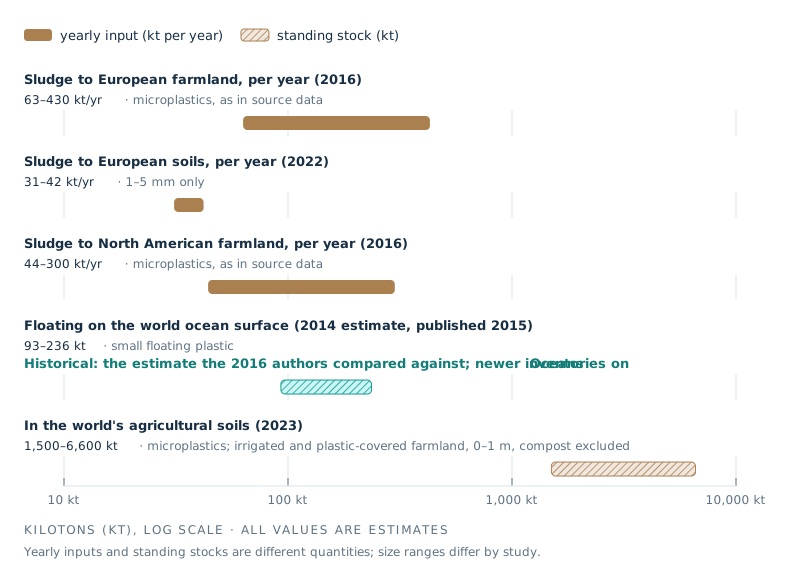
Estimates of microplastic going to soil, and the ocean surface for scale Data graphic
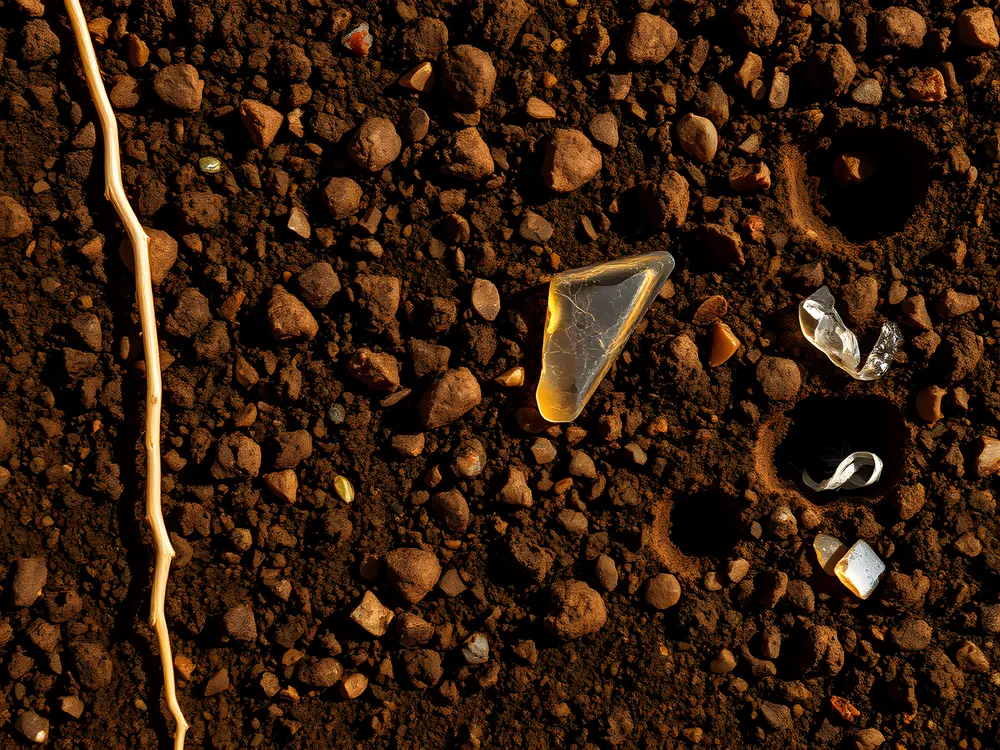
Plastic pieces among topsoil grains (illustration) Illustration · AI generated
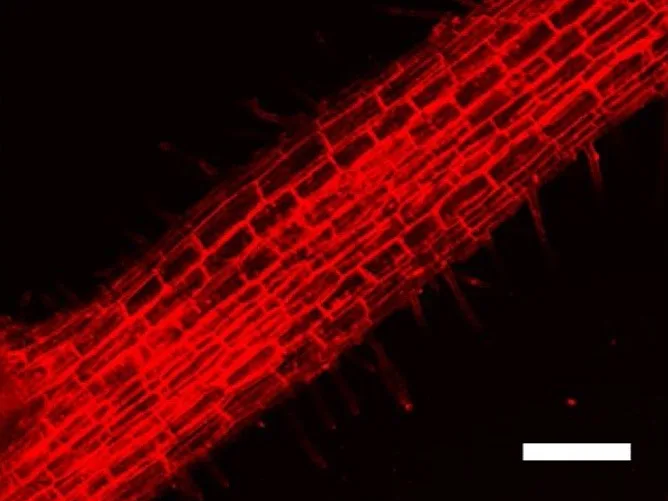
Nile-blue-labelled polystyrene beads (0.2 um) in a wheat root, confocal red channel, laboratory exposure (Li et al. 2020, MethodsX, Fig. 1K) Real image
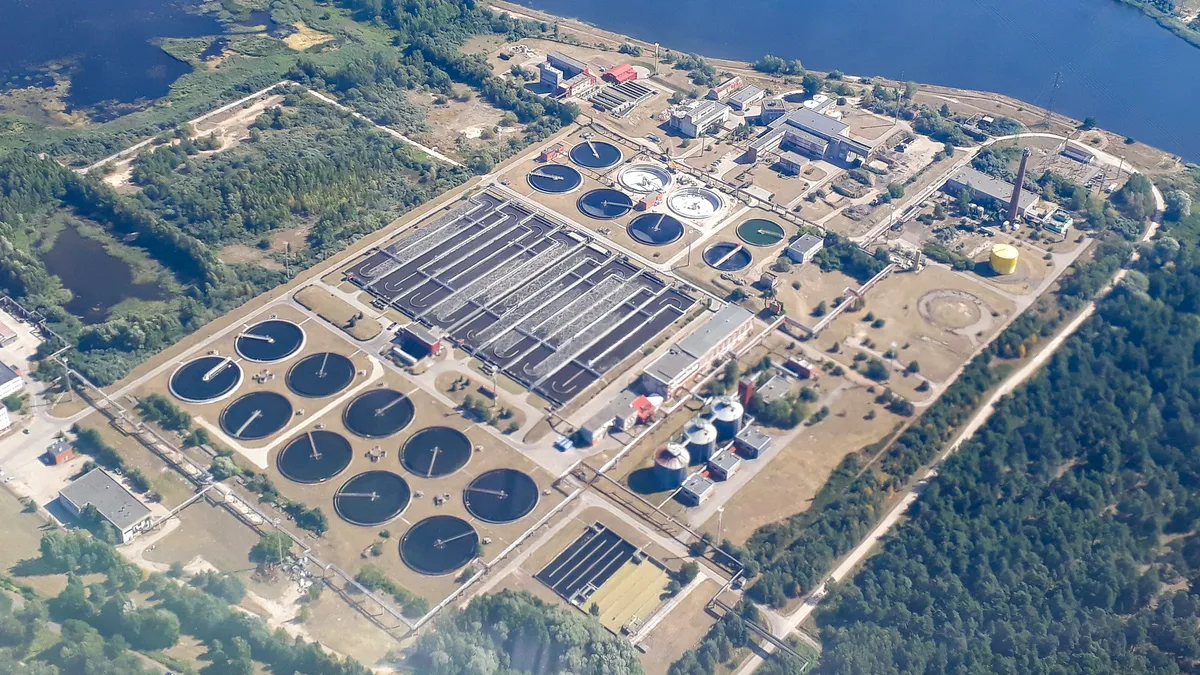
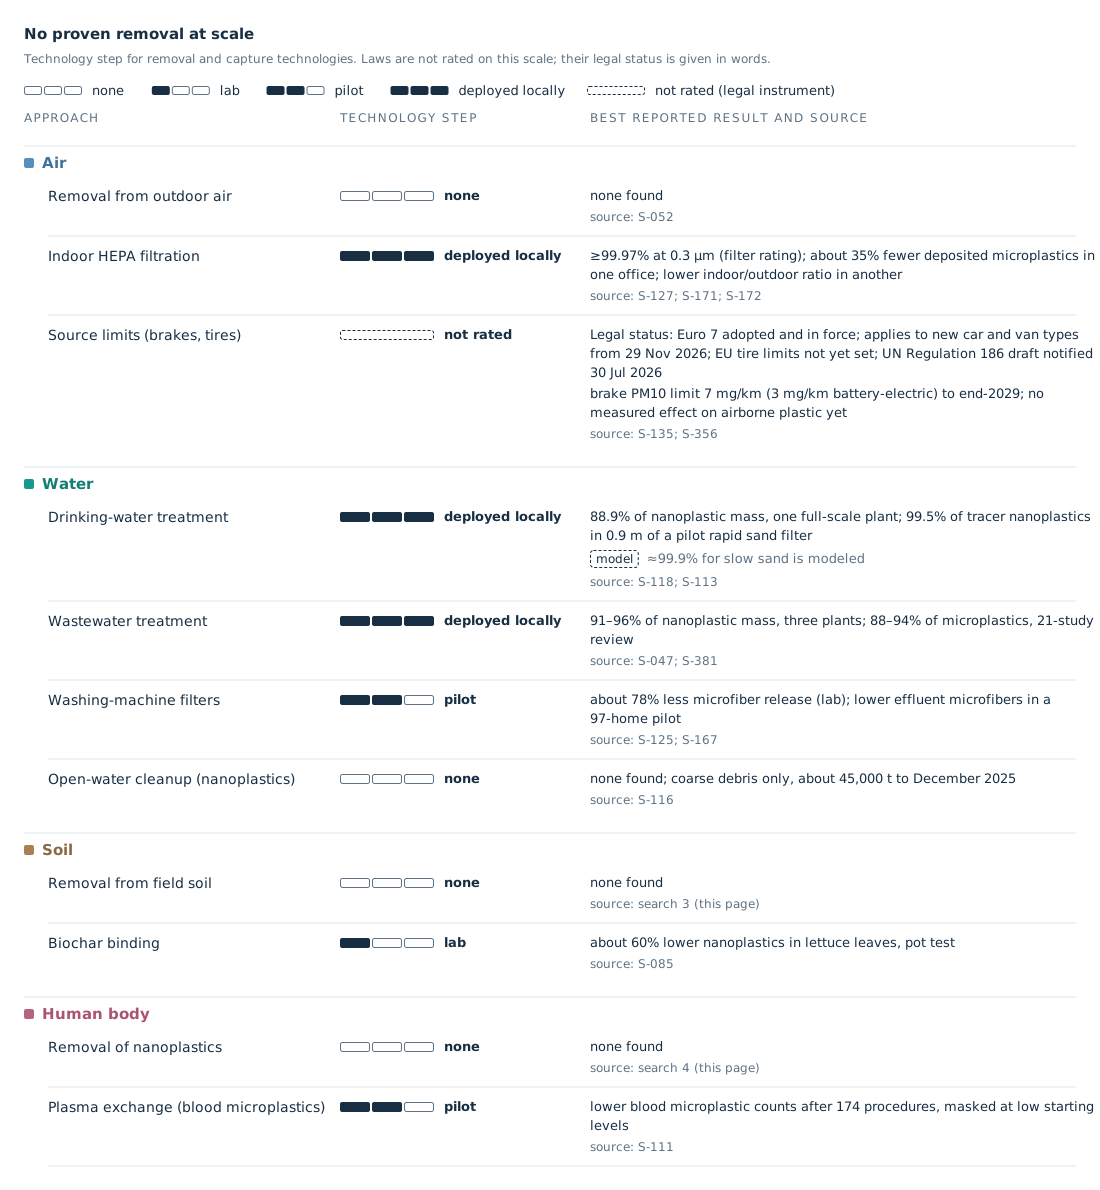
Solution status by system: how far each approach has got Data graphic
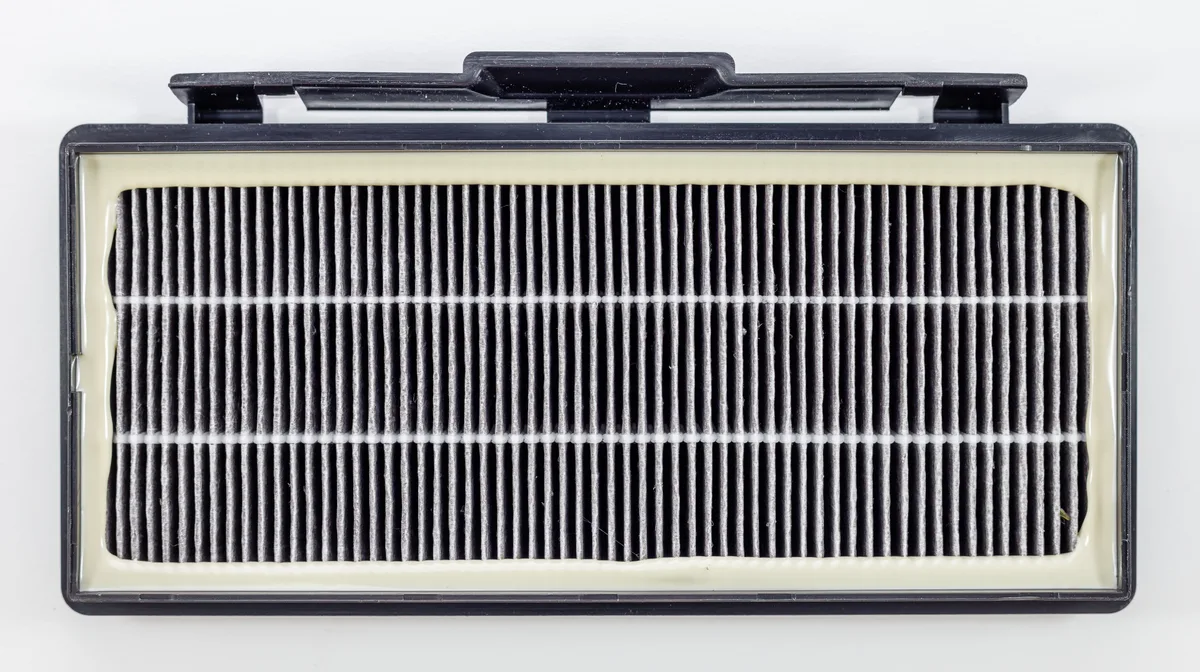
Particulates in a HEPA filter Real image
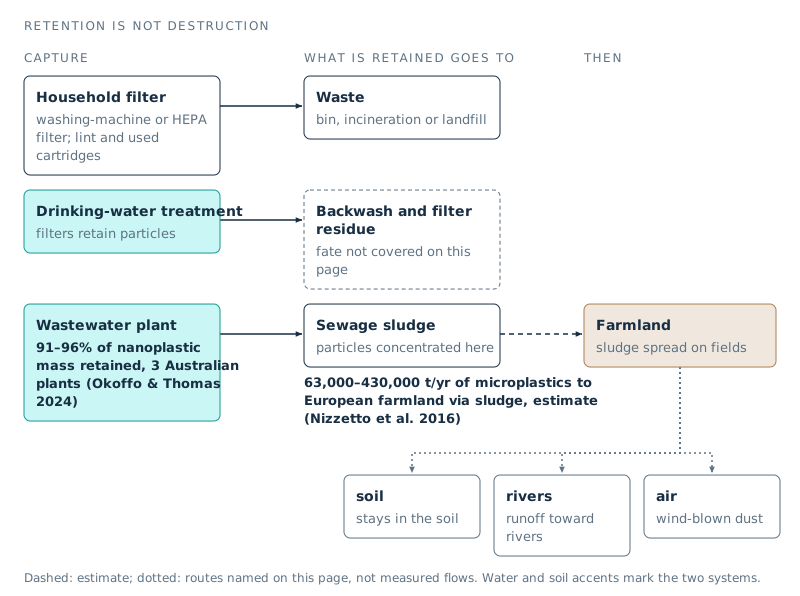
Where captured particles go Data graphic
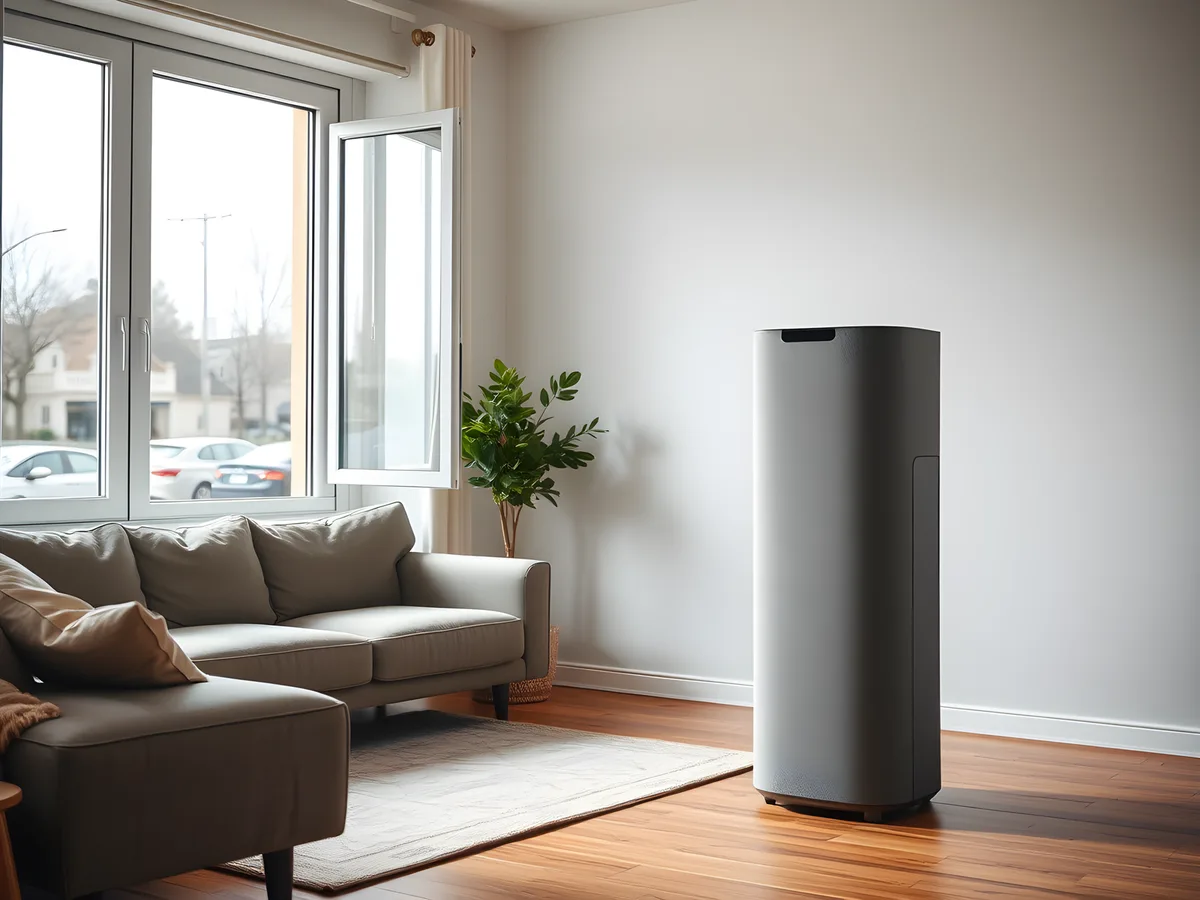
Living room with an air purifier and a window open onto a street (illustration) Illustration · AI generated
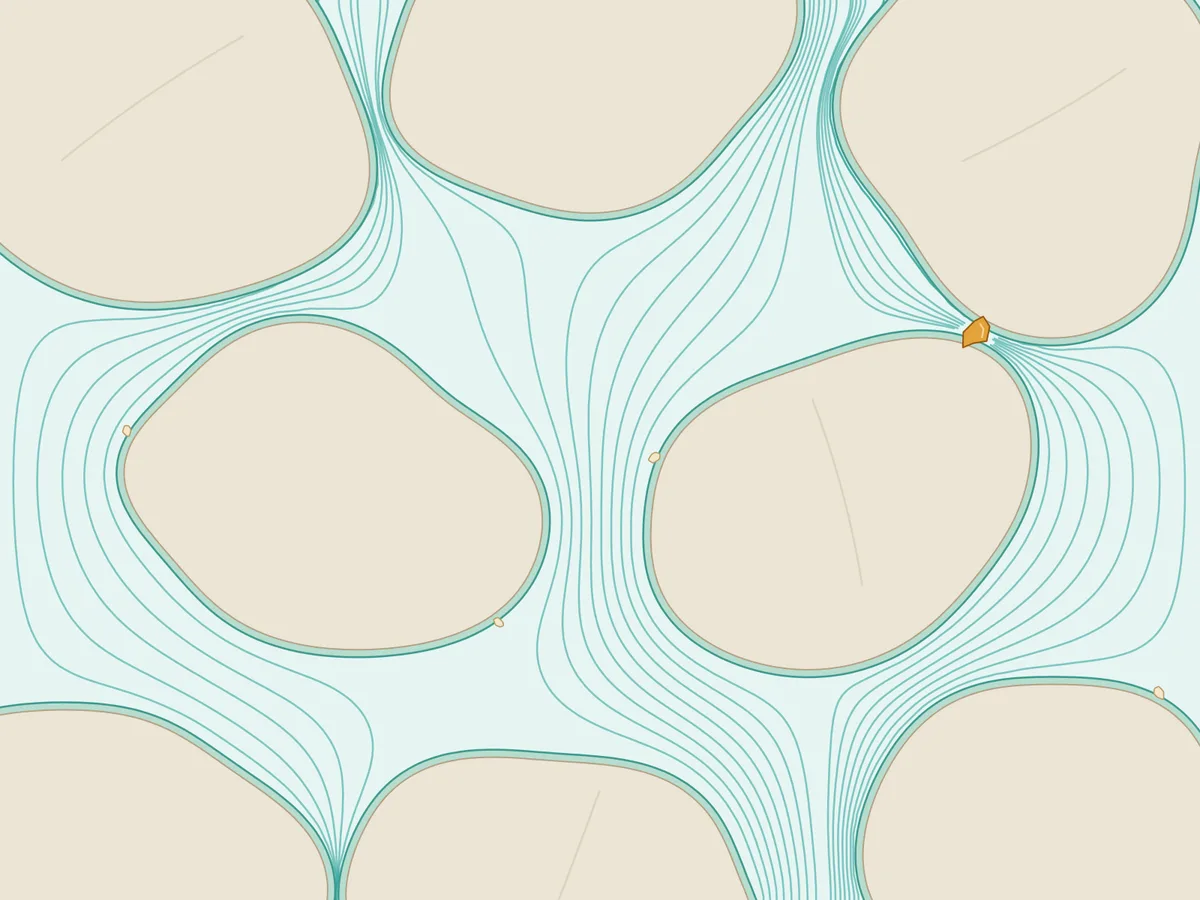
Inside a slow sand filter: biofilm-coated grains hold a small fragment Illustration
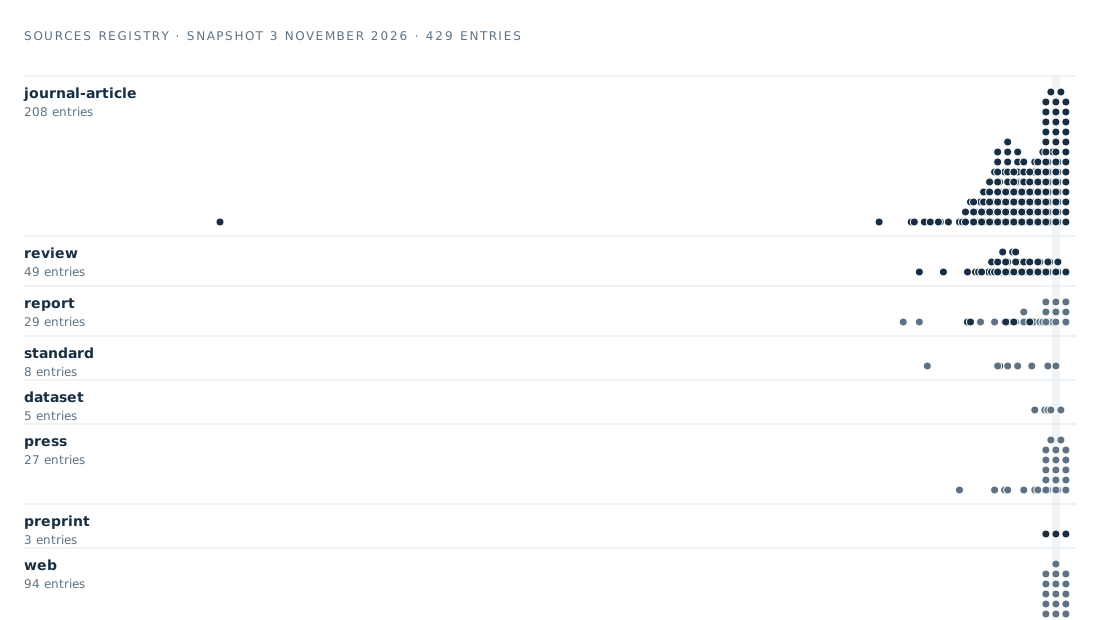
Every source in the registry, by type and year Data graphic
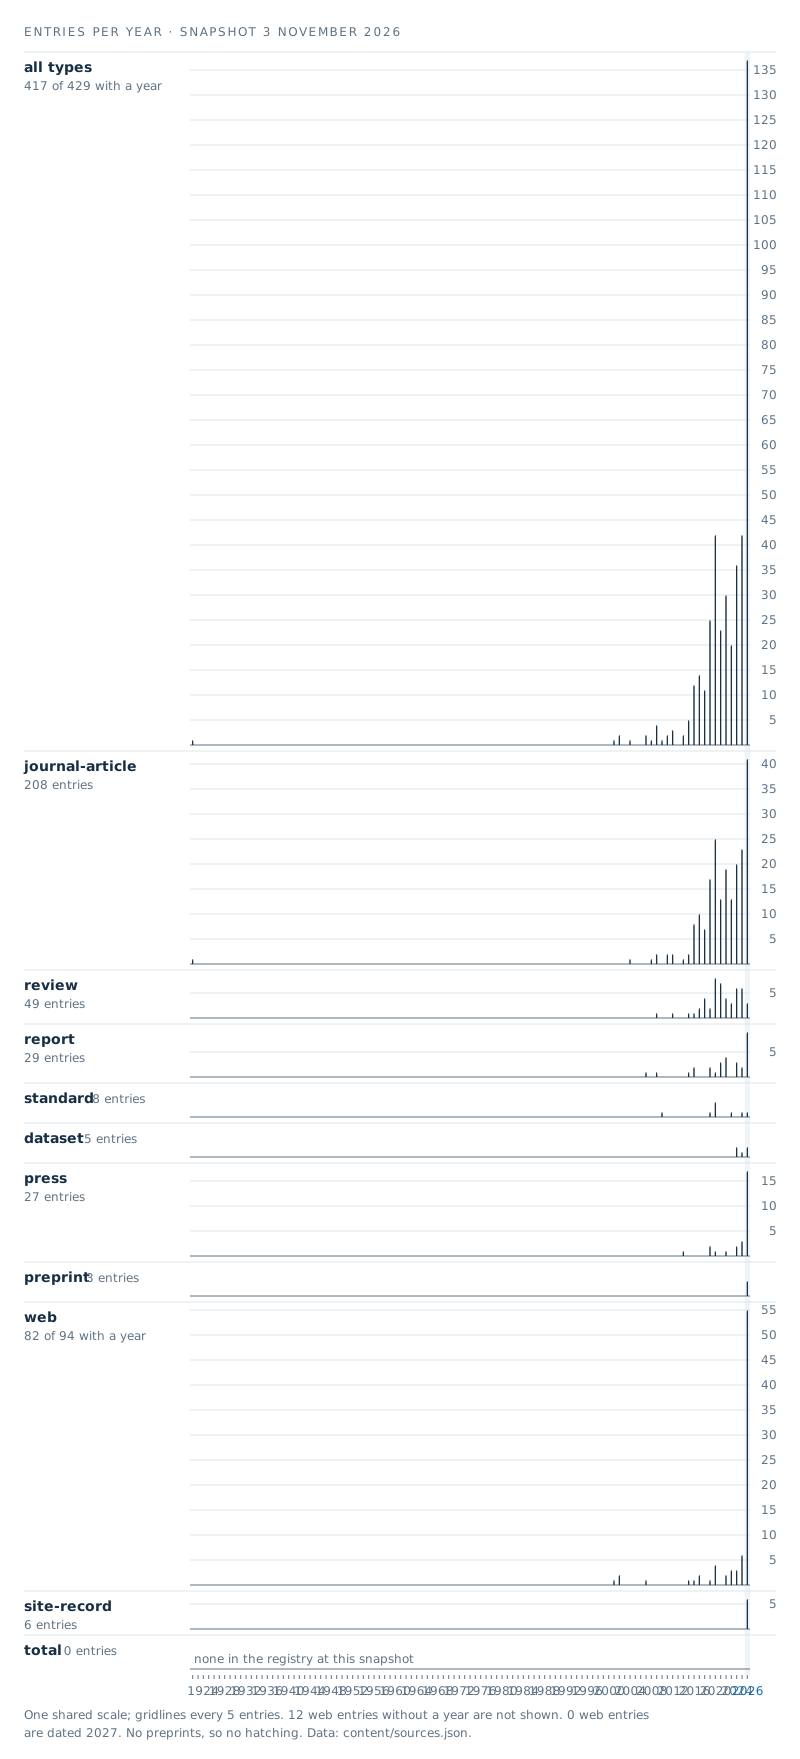
Sources by publication year and type Data graphic
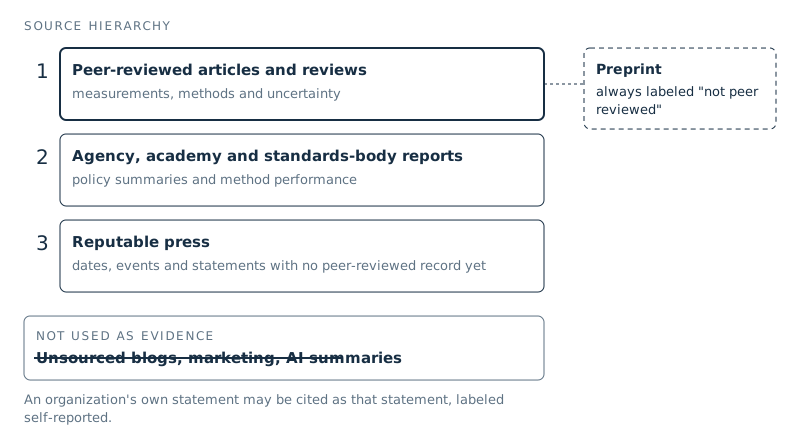
Source hierarchy used on this site Data graphic
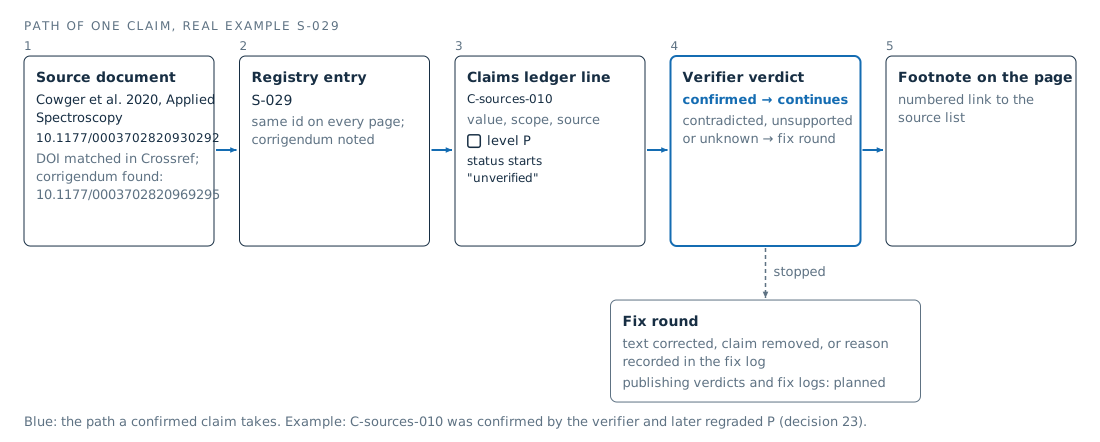
How one claim travels from source to footnote Data graphic
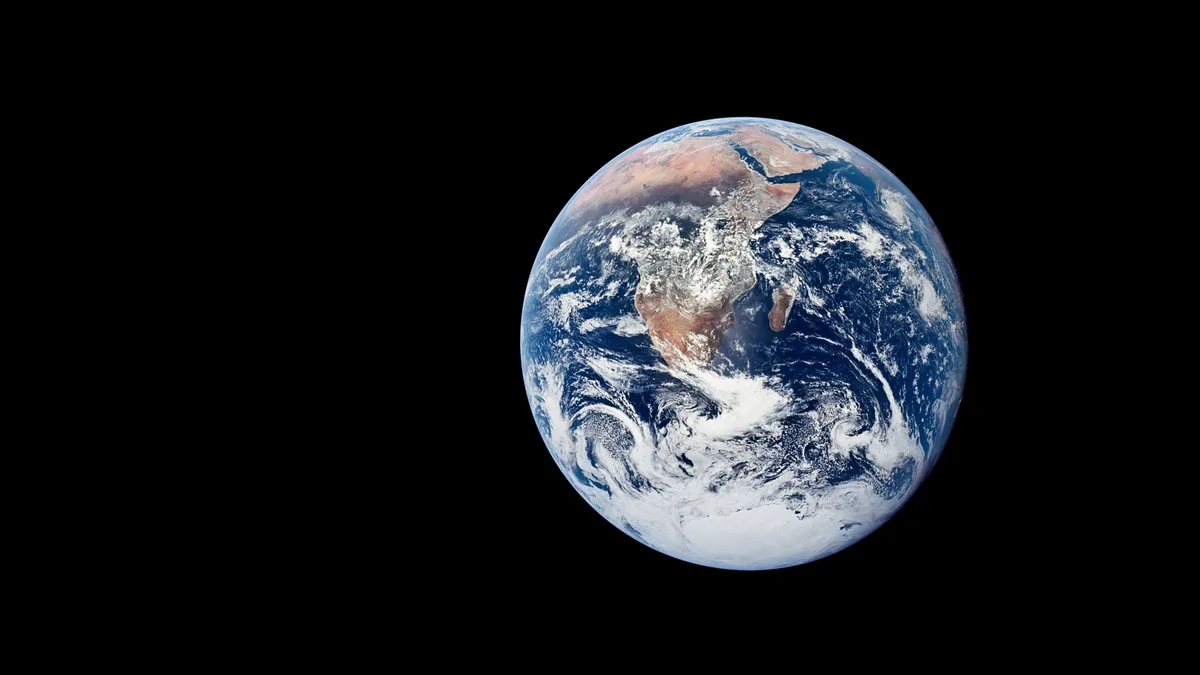
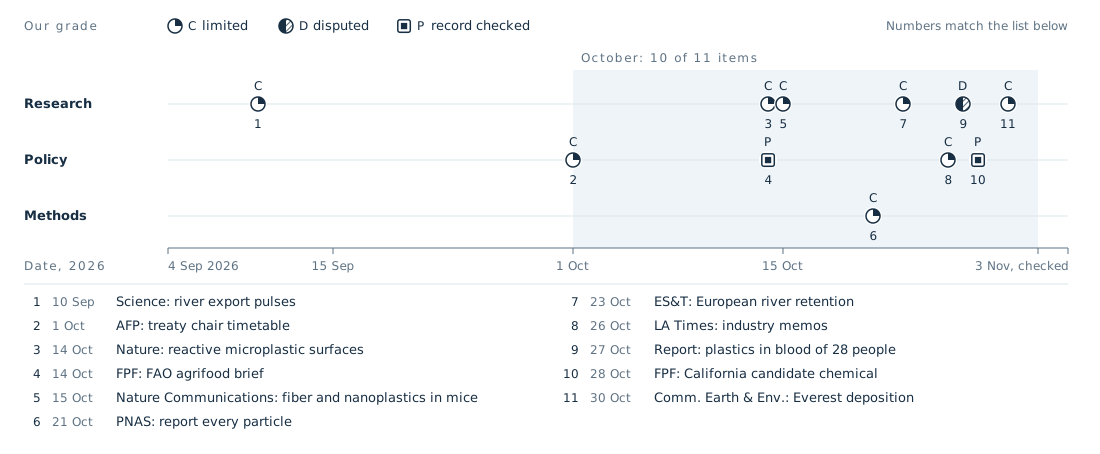
News items on a 60-day line, 4 September to 3 November 2026 Data graphic
News card template (example: Communications Earth & Environment, 30 Oct 2026) Data graphic
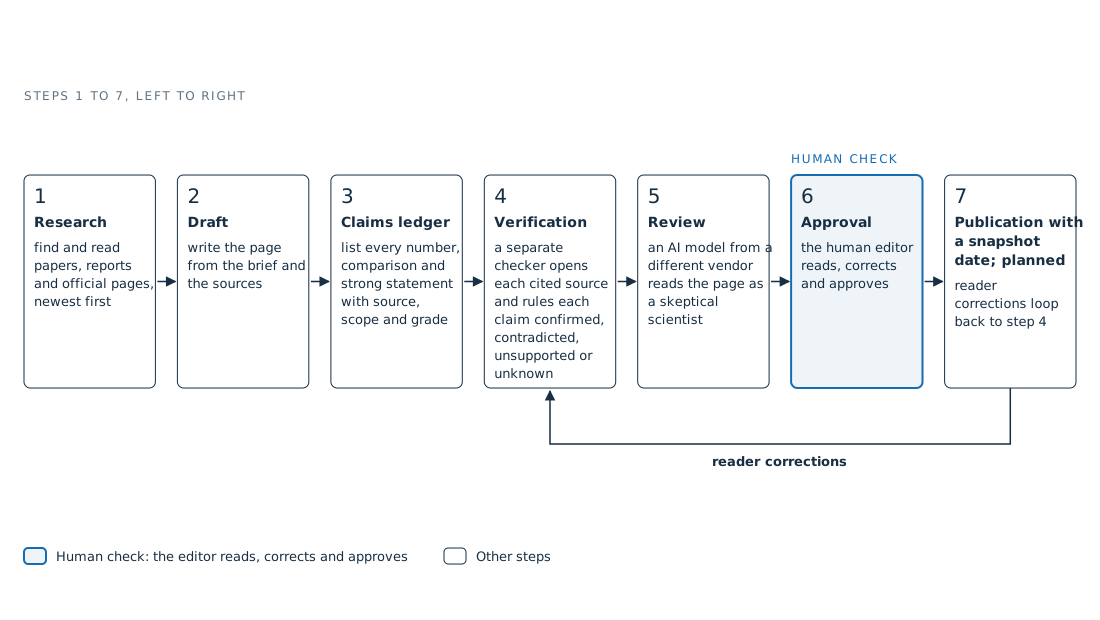
How a page is made Data graphic
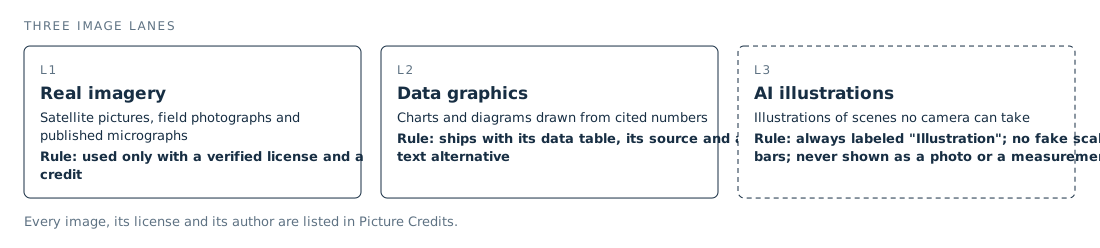
Three kinds of images on this site Data graphic
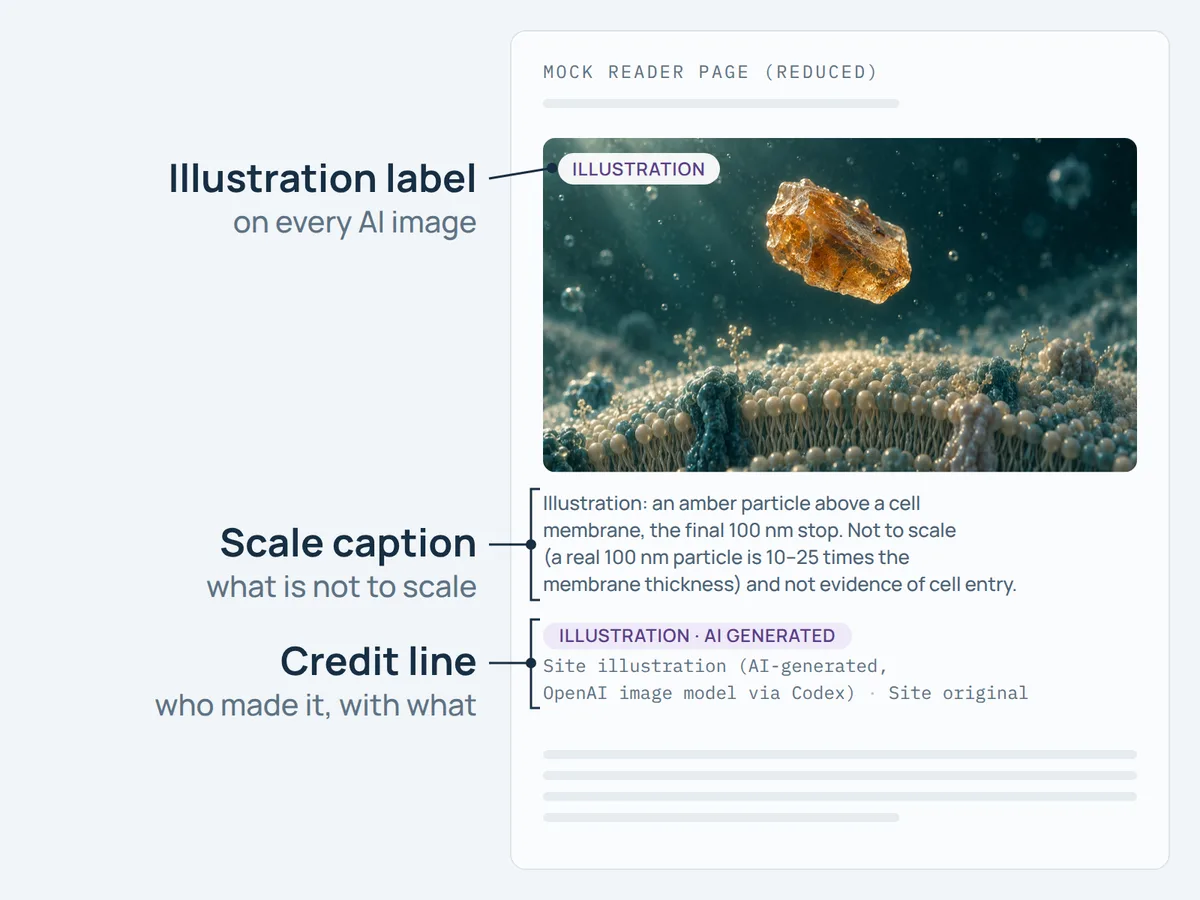
How an AI illustration appears on this site Illustration
Editorial categories of this site. A–E grade scientific findings, per claim, with a one-line rationale; D and E are not lower rungs of the A–C scale. P is not a grade: it marks facts checked against their primary record.
LAWS, TREATY TALKS AND STANDARDS
Laws on microplastics are narrow: microbeads, added particles, pellets, monitoring and vehicle emissions. None we reviewed sets a dedicated nanoplastic limit for air, water or soil. This page tracks the treaty talks, the main EU, national and state rules, and the standards, as of 3 November 2026.
Yes, some laws regulate microplastics, but each covers a narrow slice. They ban microbeads in cosmetics, restrict particles added to products on purpose, oblige pellet handlers to prevent spills, order utilities to test water and set brake-particle limits for new cars. None that we found sets a dedicated limit for nanoplastics in air, water or soil.
One legal text does name them. California's 2020 definition of microplastics in drinking water reaches down to 1 nm and lists "nanoplastics" (1 nm to under 100 nm) as a size class1. Its first testing phase reports source-water particles from 50 µm, or from the method's minimum size where that is smaller (20 µm by Raman spectroscopy)2.
The EU product restriction has no lower size bound, so it can reach added nanoparticles in principle3. The global treaty is still being negotiated.
Four kinds of rule reach micro- and nanoplastics. Product rules ban particles added on purpose, from national microbead bans to the broader EU restriction. Supply-chain rules target pre-production pellets (nurdles), which the EU pellet regulation calls the third largest source of microplastics released unintentionally in the Union4. Monitoring rules require measurement in drinking water and wastewater, without limits.
Vehicle rules set the first limits on brake particles and a framework for tire abrasion limits that the EU has not yet filled5. Textile fibers face one binding rule that we found, in France, not yet enforceable6. General plastic laws act only indirectly: an item never sold cannot fragment7. Sources and fixes are covered on Solutions by System and Solutions by Approach.
On 2 March 2022 the UN Environment Assembly adopted resolution 5/14, "End plastic pollution", "recognizing that plastic pollution includes microplastics"16. It asked UNEP to convene an Intergovernmental Negotiating Committee (INC) "with the ambition of completing its work by the end of 2024", on the full life cycle of plastic16.
Five sessions followed. The first three met in Punta del Este (28 November to 2 December 2022), Paris (29 May to 2 June 2023) and Nairobi (November 2023). The fourth and fifth met in Ottawa (23 to 29 April 2024) and Busan (25 November to 1 December 2024)20. Busan ended without a treaty.
A resumed session in Geneva (INC-5.2) adjourned on 15 August 2025 because no consensus was achieved20. After the chair resigned, a one-day procedural session on 7 February 2026 (INC-5.3) elected Ambassador Julio Cordano of Chile20,29. UNEP keeps the official record21; its pages block automated access, so these session records come from the Geneva Environment Network.
On 8 August 2026 the chair released an "Aid to Negotiations", "an informal reference document" that "does not constitute a negotiated or agreed text"27. Square brackets mark text still open. Article 1 brackets "human health" in the objective. Article 4 brackets two criteria for plastic products: chemicals of concern and intentionally added microplastics. Article 18(5) brackets a three-fourths majority vote as a last resort (level P)27.
Article 6, on releases and leakages, asks parties to prevent and reduce releases of plastics "including microplastics", in unbracketed but unagreed text. There is no article on primary plastic production; only a bracketed preamble line calls current production unsustainable. Article 27 leaves entry into force at the 50th, 60th or 97th ratification (level P)27.
Brackets show where text is not agreed, not who holds which view, so attributions here rest on press reports. AFP reported that a majority of countries want legally binding measures to curb plastic production. A smaller bloc of mostly oil-producing states, including Saudi Arabia, Kuwait and Russia, prefers a focus on waste management30.
On decision-making, AFP reported that some countries want every decision taken by consensus, while opponents argue that this lets a small minority block progress30. On chemicals, the brackets in Articles 1 and 4 show no agreement on health-based criteria27. We have not matched them to official national submissions and take no side.
Negotiating. Informal heads-of-delegation meetings took place in Nairobi (30 June to 3 July 2026) and Bangkok (27 to 30 September 2026)27,29. Cordano then said his "plan and expectation" was adoption at INC-5.4, if the agreed steps are followed30. UNEP's notice of 2 June 2026 places INC-5.4 within 13 to 24 March 2027, with duration, dates and venue still to be confirmed (level P)28.
The Aid says a second iteration will be prepared after Bangkok27. The Meridian Institute reports that it was planned for November 202629; we found no official notice of it.
UNEP's invitation of 16 October 2026 confirms a third informal heads-of-delegation meeting at the United Nations Office at Nairobi on 28 to 30 January 2027, after regional meetings on 25 to 27 January (level P)31. As of 3 November 2026, no further session had taken place and we found no published second iteration (searched the archived UNEP record, Geneva Environment Network, AFP and news indexes).
Commission Regulation (EU) 2023/2055 added entry 78 to Annex XVII of REACH, in force since 17 October 20233. It bans placing synthetic polymer microparticles on the market on their own, or in mixtures at 0.01% by weight or more where they are added for a sought-after characteristic.
The legal definition covers solid polymers in particles of 5 mm or less in all dimensions, or in fiber-like particles up to 15 mm long with a length-to-diameter ratio above 3. It excludes unmodified natural polymers, polymers proven degradable or soluble (above 2 g/L) under Appendices 15 and 16, and carbon-free polymers (level P)3.
The definition has no lower size limit. Only when the concentration cannot be determined by available analytical methods or documentation are particles counted from 0.1 µm (fibers from 0.3 µm long) to check the 0.01% limit (paragraph 3)3. That is an enforcement fallback, not a floor, so added nanoscale particles fall inside the definition in principle, though the word nanoplastic never appears. The scientific definition is on What Is Nanoplastic.
Uses without a transition, such as cosmetics with microbeads, were banned at once. Rinse-off cosmetics follow from 17 October 2027, detergents and many farm products from 2028, and leave-on cosmetics from 2029. Plant protection products and infill for synthetic sports pitches follow from 2031, and lip, nail and make-up products from 17 October 20353.
ECHA estimated that more than 42,000 metric tons (t) of intentionally added microplastics are released each year. It estimated that the restriction would avoid about 500,000 t over 20 years; both are agency estimates (level C)3.
Limitation
A restriction is not a ban on all microplastics. Entry 78 covers particles added on purpose. It does not cover tire wear, textile fibers or fragments of litter. Industrial-site uses, including pellets used as feedstock, are exempt; their users must give handling instructions and report estimated releases to ECHA every year3.
Regulation (EU) 2025/2365 was adopted on 12 November 2025 and entered into force on 16 December 2025. Some provisions applied that day: the general duty to avoid pellet losses and to contain and clean up any that occur (Article 3(1)), and the designation of national authorities (Article 16). Most obligations apply from 17 December 2027, and listed maritime provisions for shippers and vessels from 17 December 2028 (Article 26)4.
Operators handling 5 t of pellets or more a year need a risk management plan (Articles 1 and 5). Firms with sites handling at least 1,500 t a year must be certified: large firms by 17 December 2027, medium-sized by 17 December 2028, small by 17 December 2030 (Article 6). Member States may exempt permitted, regularly inspected sites from certification (Article 7), and EMAS-registered sites are exempt (Article 8)4.
Directive (EU) 2020/2184 required a method to measure microplastics "with a view to including them on the watch list" (Article 13(6))32. Delegated Decision (EU) 2024/1441 sets it: at least 1,000 liters filtered through 100 µm and 20 µm cut-offs, counting particles from 20 µm to 5 mm per cubic meter (level P)18. We found no act adding microplastics to the watch list (EU Publications Office search, 3 November 2026), so there is no EU-wide testing duty yet (level E).
Directive (EU) 2024/3019, adopted on 27 November 2024, entered into force on 1 January 2025. Member States must transpose its Articles 2 to 11 and 14 to 26, including the monitoring rules, by 31 July 2027 (Article 33)19. Article 21 sets three microplastic monitoring duties, with no limit (level P)19.
Article 21(3) requires monitoring of the presence of microplastics at plant inlets and outlets for agglomerations of 10,000 population equivalent (p.e.) and above. It adds sludge for agglomerations above 10,000 p.e. "when relevant", in particular when it is reused in agriculture. Article 21(2) adds storm water overflows and urban runoff from separate sewers in the agglomerations that need integrated management plans. Article 21(4) gives the Commission until 2 July 2027 to set the measurement methods19.
Regulation (EU) 2024/1257 (Euro 7) calls tire emissions "the largest source of microplastics released into the environment", an estimate5.
Until 31 December 2029 it caps brake particles (PM10) at 7 mg/km for most new cars and vans and 3 mg/km for pure battery-electric ones. Heavier N1 Class III vans get 11 mg/km, or 5 mg/km if battery-electric. From 2030 a table follows a review and is still empty; from 2035 the limit is 3 mg/km for all cars and vans (Annex I Tables 4, 5 and 8)5.
These limits count all brake particles, not plastic. Euro 7 is adopted and has been in force since 28 May 2024. It applies to new car and van types from 29 November 2026 and to all new cars and vans from 29 November 2027 (Article 21). On 3 November 2026 it was therefore not yet applying (level P)5.
Tire rules apply to new passenger-car (C1) tire types from 1 July 2028, but the limit table is still empty in the consolidated text of 2 September 2026 (level P)5. Euro 7 leaves the values to UN WP.29, with an EU fallback (Article 14)5.
WP.29 agreed a draft UN Regulation No. 186 on passenger-car tire abrasion at its session of 22 to 26 June 202633. The UN Secretary-General notified it on 30 July 2026. It counts as adopted unless more than one-fifth of the 1958 Agreement's parties object within six months, and then enters into force (level P)26. Its stages start in 2028, by secondary summaries; EU incorporation is a separate step, not reflected in the consolidated Euro 7 text of 2 September 202633,5.
Directive (EU) 2019/904 bans some single-use items from 3 July 2021 and says "microplastics do not fall directly within the scope"7.
What each EU instrument covers
| label | value | unit | source | products | pellets | drinking_water | wastewater | vehicles | nanoplastics |
|---|---|---|---|---|---|---|---|---|---|
| Regulation (EU) 2023/2055 (REACH entry 78) | in force; applying in steps 2023 to 2035 | S-129 | yes: intentionally added particles | partly: industrial-site reporting only | no | no | no | partly: no lower size bound; 0.1 µm counting fallback for enforcement | |
| Regulation (EU) 2025/2365 (pellet losses) | in force; general duty applying since 16 Dec 2025; main obligations from 17 Dec 2027 | S-130 | no | yes: handling, transport, certification | no | no | no | no | |
| Directive (EU) 2020/2184 with Decision (EU) 2024/1441 (drinking water) | in force; method adopted, no testing duty yet | S-131; S-132 | no | no | partly: method 20 µm to 5 mm, watch-list listing pending | no | no | no | |
| Directive (EU) 2024/3019 (urban wastewater) | in force; transposition by 31 Jul 2027 | S-133 | no | no | no | yes: monitoring at plant inlets and outlets, sludge when relevant, overflows and runoff; no limit | no | not specified: method due by 2 Jul 2027 | |
| Regulation (EU) 2024/1257 (Euro 7) | adopted, in force; applying to new car and van types from 29 Nov 2026 | S-135 | no | no | no | no | partly: brake PM10 limits; EU tire limits not yet set | no | |
| Directive (EU) 2019/904 (single-use plastics) | in force; applying since 3 Jul 2021 | S-134 | indirect: bans some single-use items | no | no | no | no | no: microplastics outside direct scope |
United States. The Microbead-Free Waters Act of 28 December 2015 banned manufacturing rinse-off cosmetics with plastic microbeads, including toothpaste, from 1 July 2017. Interstate sale was banned from 1 July 2018; for cosmetics that are also nonprescription drugs, each date came a year later8. A microbead is defined by purpose: a solid plastic particle under 5 mm "intended to be used to exfoliate or cleanse"8.
In April 2026 the EPA proposed listing microplastics as a group on its draft Contaminant Candidate List 6, which it calls "a first step"; a listing sets no limit23. Its proposed UCMR 6 monitoring rule leaves microplastics out despite a petition from seven governors, because "there is no validated EPA or consensus drinking water analytical method"25. Both are proposed.
California. SB 1422 (2018) led to a legal definition in 2020 and a testing handbook in 20221,2. Phase I tested source water from fall 2023 to fall 2025, reporting particles from 50 µm or the method minimum if smaller (20 µm by Raman spectroscopy). Phase II, treated water down to 5 µm, is planned for fall 2026 to fall 2028, dates "approximate, not binding"2. The state's page does not confirm that Phase II has started11.
England, Canada, China. England banned microbeads in rinse-off personal care products from 9 January 2018 (manufacture) and 19 June 2018 (supply)10. Canada banned them in toiletries from 1 January 2018 (manufacture and import) and 1 July 2018 (sale), a year later for natural health products and nonprescription drugs9. China set end-2020 for production and end-2022 for sale12.
France. Article 79 of the AGEC law of 10 February 2020, as amended in August 2021, requires new washing machines to carry a plastic microfiber filter, or another solution, from 1 January 202513.
The duty is adopted and in force but not applying: the implementing decree was still unpublished when the government answered parliament on 6 October 20266,34. It cited hard-to-check external devices, no European standard for filter performance and possible conflict with free movement of goods6.
Rules are enforceable only if labs measure the same thing; methods are on How We Measure It.
The EPA judges that no validated method yet exists for national drinking-water monitoring25.
Nanoplastics. No instrument we reviewed sets a dedicated nanoplastic limit for air, drinking water, wastewater or soil (level E; texts on this page and a Federal Register search, 3 November 2026). The one rule that reaches them is a product rule: the REACH 0.01% restriction has no lower size bound, with a 0.1 µm counting fallback3. That is not an ambient quality standard.
The EU drinking-water method starts at 20 µm, and California's first phase reports from 50 µm, or 20 µm where the Raman method is used18,2. The word "nanoplastic" appears in none of the seven EU texts listed (level P; full-text search, 3 November 2026).
Air, legacy stocks, people. In the jurisdictions reviewed (EU, US federal, California, England, Canada, France and China) we found no ambient air standard for micro- or nanoplastics. Euro 7 limits brake particles at the source, but it counts all brake dust and sets no air concentration. No text reviewed requires removing particles already in soils, sediments or the ocean, or measuring plastic in human blood or tissue (level E, same scope).
We list a rule only after reading its official text. Where an official site blocks automated access (UNEP, ISO, UNECE), we read an archived copy or an official listing and say so.
We plan to recheck the treaty process, EUR-Lex, the Federal Register and the French parliament after each INC session and at least monthly. News goes to This Week, sessions to Events & Conferences. Last check: 3 November 2026. Last change, same day: pellet application dates, Euro 7 classes and tire status, UN Regulation No. 186, and treaty text cited from the Aid itself.
No. It restricts synthetic polymer microparticles added to products on purpose, in steps from 2023 to 2035. Tire wear, textile fibers and litter fragments are outside it. (level P,3)
Editorial categories of this site. A–E grade scientific findings, per claim, with a one-line rationale; D and E are not lower rungs of the A–C scale. P is not a grade: it marks facts checked against their primary record.
PRIVACY STATEMENT
The site sets no cookies and runs no analytics or tracking. We handle reader emails and hosting logs. This statement explains browser settings, retention, providers and your rights.
Version 1.0 · 4 November 2026
This statement gives the information required by Article 13 of the EU General Data Protection Regulation (GDPR) (P)1.
The data controller is {{OWNER_NAME}}, based in Croatia, who owns and edits this site. You can reach the controller at {{CONTACT_EMAIL}}.
Apart from the server logs described below, reading this site gives us no personal data about you.
The home page remembers the display settings you choose (language, counter starting point, model inputs) in your browser's local storage. They stay on your device, are never sent to us, contain no personal data and can be deleted in your browser.
When you follow a link to a cited source, you leave this site, and that site's own privacy policy and cookies apply.
The site is hosted by {{HOSTING_PROVIDER}}. Its servers may record each request in an access log: your IP address, the date and time, the page or file requested, and your browser's user agent (which names your browser and operating system). The host processes these logs for {{HOSTING_LOG_PURPOSES}} and deletes them after {{HOSTING_LOG_RETENTION}}. {{HOSTING_PROCESSING_AND_TRANSFERS}} Its privacy policy is at {{HOSTING_PRIVACY_URL}}. For security and operation, the legal basis is our legitimate interest in a secure, working site, Article 6(1)(f) GDPR (P)1.
If you email {{CONTACT_EMAIL}}, we receive your name as you give it, your email address, the content of your message with any attachments, and its date. We use these data only for two purposes:
We do not sell your messages or use them for marketing. Provider processing and any other access are explained below; public name credits require your permission. Writing to us is voluntary; without an email address we cannot reply.
Our mailbox provider is {{EMAIL_PROVIDER}}; its privacy policy is at {{EMAIL_PRIVACY_URL}}. {{EMAIL_PROCESSING_AND_TRANSFERS}} {{CORRESPONDENCE_ACCESS_POLICY}}
We delete correspondence, including attachments, {{RETENTION_MONTHS}} months after the last message in the conversation. For a correction, we keep only a record of the date, the page, what was wrong, the fix and its supporting sources, without personal details. The original email and attachments follow the same {{RETENTION_MONTHS}}-month deletion period. A public name credit remains until consent is withdrawn.
Depending on the processing and the GDPR conditions, you can ask to:
To use these rights, write to {{CONTACT_EMAIL}}. We respond without undue delay, normally within one month. For complex or numerous requests, the GDPR allows up to two further months; we explain any extension within the first month (Article 12(3)) (P)1.
You also have the right to lodge a complaint with a supervisory authority (Article 77) (P)1. The authority for this site is the Croatian Personal Data Protection Agency (Agencija za zaštitu osobnih podataka, AZOP), which explains how to lodge a complaint (P)2. You may also complain to the authority of the EU or EEA country where you live or work, or where you think the infringement took place. The European Data Protection Board lists every national authority (P)3.
The site offers no services aimed at children. Reading the site involves the logs and browser settings described above; emails are handled as explained above.
This statement is dated. Each change gets a new version number and is listed below with its date.
Editorial categories of this site. A–E grade scientific findings, per claim, with a one-line rationale; D and E are not lower rungs of the A–C scale. P is not a grade: it marks facts checked against their primary record.
THE LEAST MEASURED SINK
Farmland receives plastic from sludge, mulch film, compost, roads and the air, and much of it stays in topsoil. Experiments show effects on soil and uptake by plants, mostly at doses far above field levels. The few field measurements of nanoplastics we found are from compost-amended French fields.
Soil receives plastic from sewage sludge, farm film, compost, roads and the air, and much of it stays where it lands. A 2016 estimate put the microplastic sludge carries each year to farmland at 63,000–430,000 metric tons (t) in Europe and 44,000–300,000 t in North America. Together, its authors noted, this exceeds the 93,000–236,000 t then estimated to float on the whole ocean surface1,2. This sets a yearly flow against a standing stock, both estimates; newer ocean figures are on Oceans. Effects on soil are known mostly from experiments at doses far above field levels, and field measurements of nanoplastics are only beginning.
63,000–430,000 t/yr
microplastic estimated to reach European farmland in sewage sludge
Europe, farmland receiving sewage sludge; rough extrapolation published 2016; microplastics1
estimate, not measurement; a 2022 estimate for 1–5 mm particles only gives 31,000–42,000 t/yr
CLimited1.5–6.6 Mt
first estimate of the microplastic stock in the world's farm soils
irrigated and plastic-covered farmland only, 0–1 m depth, compost excluded; median abundances from 442 sites in 43 articles, counts converted to mass with shape models; 20233
authors call it a first step; we found no comparable estimate for nanoplastics
CLimited12.5 Mt
plastic products used in plant and animal production in 2019
global; crops and livestock 10 Mt, fisheries and aquaculture 2.1 Mt, forestry 0.2 Mt; food packaging (37.3 Mt) excluded; FAO assessment4
single agency estimate compiled from industry and literature data
CLimited≈1,076 particles/kg
microplastic in Chinese soils after 24 years of continuous mulching
mulched fields in China, compared with ≈80 particles/kg after 5 years; polymers matched the film; 20205
CLimited123 µg/g
polystyrene nanoplastics in roots of a grass on a compost-amended field
Holcus lanatus, Loire floodplain, France, decades of compost amendment; shoots 32 µg/g, below the quantification limit; dry weight; matrix-matched py-GC/MS; polystyrene only; 20266
single site with a heavy plastic history, not a survey; topsoil 2.57 µg/g in the 200–1,000 nm fraction, about 28 times a reference plot
CLimitedFor the European Union, Horton and colleagues estimated that 473,000–910,000 t of plastic a year stays on land7. That is 4–23 times the estimated release to the ocean. It counts mismanaged waste of all sizes plus sludge microplastic, so it is not a measure of microplastic in soil (level C).
Sewage sludge. Wastewater plants concentrate microplastic in their sludge; in one primary settling tank, 96% of 1–5 mm particles ended up there8,9. Spread as fertilizer (biosolids), sludge carries them to fields. On 16 fields in eastern Spain, each application added about 700 microplastic particles per kg of soil9. On two German fields, plastic loads were still higher 34 years after the last application10. Independent field studies in two countries thus find the sludge signal (level B).
How much arrives each year is less certain. Estimates for Europe run from 31,000–42,000 t/yr, counting only 1–5 mm particles, to 63,000–430,000 t/yr8,1. Both are extrapolations, not measurements (level C).
Mulch film. Plant and animal production used 12.5 million metric tons (12.5 Mt) of plastic products in 2019; crops and livestock took 10 Mt, fisheries, aquaculture and forestry the rest. More than 2 Mt of mulch film is used each year worldwide, a 2018 industry figure4. In China, microplastic in mulched soils rose from about 80 to about 1,076 particles per kg after 5 and 24 years of continuous mulching5.
Compost and digestate. Fertilizer from biowaste plants in Germany held 14–895 plastic particles larger than 1 mm per kg dry weight; digestate from energy crops held almost none11.
Roads and air. Tire wear emits an estimated 0.23–4.7 kg per person per year to all compartments; how much reaches soil depends on road type and drainage12. In the western United States, more than 1,000 t of microplastic a year settles on protected lands from the air, and soils are also a source of resuspended particles13.
Irrigation. Wastewater used to water crops is a further route. A 2025 review compiles particle counts in wastewater reused on farms, but we found no estimate of the mass it delivers to soil14.
How plastic gets into soil, and what we know about each route
| label | value | unit | kind | level | source |
|---|---|---|---|---|---|
| sewage sludge (biosolids): field signal | more microplastic where sludge was spread (16 fields in Spain, 2 in Germany) | input | B | S-256, S-257 | |
| sewage sludge (biosolids): amount | 31,000–430,000 t/yr to European farmland (two estimates, different size ranges) | input | C | S-082, S-360 | |
| plastic mulch film | no mass flux to soil estimated; >2 Mt of mulch film used per year worldwide | input | C | S-083, S-363 | |
| compost and digestate | 14–895 particles >1 mm per kg dry weight (Germany); nanoplastics found in compost-amended French fields | input | C | S-362, S-377, S-266 | |
| atmospheric deposition | >1,000 t/yr on western US protected lands | input | C | S-049 | |
| tire wear near roads | 0.23–4.7 kg per person per year emitted to all compartments; share reaching soil not quantified | input | C | S-122 | |
| irrigation with wastewater | particle counts in reused wastewater reported; no mass flux to soil found | input | E | S-380 | |
| plowing, earthworms, water | move particles down; microplastic found to 90 cm in sludge fields; about 1% of PET below 8 cm in two years in a Swiss field test | internal | C | S-257, S-284, S-378 | |
| plant roots | uptake of particles <1 µm in lab and pot experiments; polystyrene nanoplastics in roots of field grass at one site | output | B | S-084, S-368, S-371, S-266 | |
| groundwater (observed compartment, link to soil not traced) | 0.021–0.203 µg/L nanoplastics at six riverbank-filtration sites, Fuhe River, China | observed | C | S-034 |
In a five-week garden experiment, de Souza Machado and colleagues mixed four microplastic types into a loamy sand at up to 2% of soil weight. The authors described this level as environmentally relevant. Bulk density, water holding capacity and the link between microbial activity and stable soil crumbs all changed, and the size of the change depended on the particle type22 (level C).
Earthworm tests used far more plastic. Lumbricus terrestris fed polyethylene (PE) particles below 150 µm in leaf litter died more often and grew more slowly at 28% plastic in the litter and above, but not at 7%23. The worms concentrated particles below 50 µm in their casts.
A screening of 106 datasets found effects mainly at 0.1–10% of soil dry weight and derived a provisional no-effect level of 520–655 mg/kg24. Most surveyed farm and garden soils held below about 13,000 particles and 4.5 mg of microplastic per kg25. A 2025 review draws the same contrast: test doses of up to 50% by volume against field levels typically below 0.1% by weight26. The studies cited here do not establish effects at field-typical concentrations (level C).
Limitation
Lab dose vs field dose. The 2% dose in the garden experiment is 20,000 mg/kg, at least 4,400 times the 4.5 mg/kg below which most surveyed farm soils fall (level P: our calculation from22 and25). Field values are often modeled from particle shape rather than weighed, and hotspots such as industrial sites run 100 to 10,000 times higher than common levels25. Nearly all of these numbers are for microplastics; field concentrations of nanoplastics are reported for very few soils.
IllustrationHydroponics and sand. Li and colleagues grew wheat and lettuce in treated wastewater and in sand or sandy soil. Fluorescent 0.2 µm polystyrene (PS) beads entered the roots through cracks where side roots emerge, then moved to the shoots18. Sun and colleagues found both positively and negatively charged PS nanoplastics accumulating in Arabidopsis; negatively charged ones reached the xylem, the plant's water pipes19.
With europium-doped 100 nm PS instead of dyes, lettuce kept most particles in its roots; leaf transfer was measurable only at the highest dose, 1,500 µg/L20. Several independent groups using different labels thus find root uptake in the laboratory (level B). Taylor and colleagues saw PS particles pile up on root caps of Arabidopsis and wheat without entry27. Particles, media and imaging differ, so this contrasts with the others rather than failing to replicate them.
Pots of soil. Rice and peanuts in soil with 250 mg/kg PS nanoplastics carried particles into their grains28. Pumpkins exposed to radiolabeled PS particles about 20 nm across (1 µg/L and 1 mg/L) carried them to the anthers. Pollen viability fell; the abstract does not say at which dose29 (level C). In a standardized test, tomatoes took 210 nm palladium-doped PS particles into roots and shoots within eight days, from artificial soil spiked at 400 and 4,000 mg/kg30.
Harvested crops. A 2024 study reported 101–463 mg/kg dry weight of PE "nanoplastics" in four vegetables by pyrolysis gas chromatography with mass spectrometry (py-GC/MS)31. Its abstract gives recoveries for standards only and does not say how particles below 1 µm were separated. We could not check crop origin or sample numbers. In blood, natural compounds can inflate this method's PE and PVC signals32. That calls for crop-specific checks; it does not show the crop values are wrong (level C).
Field soil. Ryzhenko and colleagues (2026) quantified PS nanoplastics on a Loire floodplain field in France amended with compost for decades. By matrix-matched py-GC/MS, the 200–1,000 nm fraction of the topsoil held 2.57 µg/g dry weight, about 28 times a reference plot. A grass growing there (Holcus lanatus) held 123 µg/g dry weight in roots and 32 µg/g in shoots, below the quantification limit6. It is one site and one polymer (level C).
Whether food crops from ordinary fields contain nanoplastics is not established; uptake in hydroponics is not plastic in our food.
Earthworms carried PE microbeads downward in a greenhouse test, small ones furthest16. In sand columns, 21 µm PE particles moved deepest, and each wet-dry cycle pushed them further. The authors' model projected an average of 5.24 m in 100 years across 347 Chinese cities, an estimate for microplastics in sand34.
A two-year field test points the other way. In 45 repacked loam columns set into a Swiss arable field, PET fragments (65–125 µm) and fibers (0.5–2 mm long) were mixed at 1% of weight into the top 2 cm. About 1% reached below 8 cm, and pore structure changed over time whether or not plastic was present17. Polymer, shape, soil and duration differ from the sand columns, so neither result describes soils in general (level C).
On the German sludge fields, microplastic was found down to 90 cm, at 0–56 particles per kg, with plowing as the main spreader10. In a French field amended with household-waste compost in 1990, nanoplastic able to move with soil water was estimated from strontium isotopes at about 0.25 µg/kg down to 55 cm. Polypropylene nanoplastics were identified in that soil water by py-GC/MS. The authors note this is the mobile fraction, not the total in soil15 (level C).
Nanoplastic mass has also been measured in groundwater. At six sites on the Fuhe River in China, Xu and colleagues found 0.021–0.203 µg/L in groundwater against 0.283–0.793 µg/L in surface water, and attributed the difference to filtration through riverbanks21. It is one study, and it does not trace the particles to soil (level C).
Soil is full of organic matter that interferes with plastic detection, so it must be digested first. That keeps samples small, usually below 100 g of dry soil, which limits how well they represent a field35. Methods are not standardized, and extraction can itself break particles apart35.
The first reported nanoplastic identification in soil needed size fractionation plus py-GC/MS36. Mass is often estimated from particle counts and shapes rather than weighed25. The instruments and their size limits are explained on How We Measure It.
The only global stock figure is 1.5–6.6 Mt of microplastic in agricultural soils. It rests on 442 sampling sites from 43 articles, covers only irrigated and plastic-covered farmland to 1 m depth, leaves out compost and converts counts to mass with shape models. Its authors call it a first step3 (level C). The two annual sludge estimates for Europe differ about tenfold at their upper ends and count different size ranges1,8 (level P: our comparison of the published ranges).
Estimates of microplastic going to soil, and the ocean surface for scale
| label | value | unit | high | kind | sizes | source |
|---|---|---|---|---|---|---|
| Sludge to European farmland, per year (2016) | 63 | kt | 430 | annual input | microplastics, as in source data | S-082 |
| Sludge to European soils, per year (2022) | 31 | kt | 42 | annual input | 1–5 mm only | S-360 |
| Sludge to North American farmland, per year (2016) | 44 | kt | 300 | annual input | microplastics, as in source data | S-082 |
| Floating on the world ocean surface (2014 estimate, published 2015) | 93 | kt | 236 | standing stock | small floating plastic | S-359 |
| In the world's agricultural soils (2023) | 1500 | kt | 6600 | standing stock | microplastics; irrigated and plastic-covered farmland, 0–1 m, compost excluded | S-361 |
For nanoplastics, field data now exist but cover very little ground. We found three studies, all by one French team on fields amended with household-waste compost36,15,6. They give a qualitative identification (2021), an isotope-based estimate of the mobile fraction (2024) and a py-GC/MS quantification of polystyrene (2026) (level C). We found no representative survey of nanoplastic mass or particle number across ordinary farm soils, and no regional or global estimate (level E).
Search of 3 November 2026: Europe PMC titles and abstracts, nanoplastic, soil, field and quantification terms, 2016–2026 (45 records screened); Crossref; the open web; the team's publications; our registry. We also found no field study of nanoplastic effects on soil life or yields (level E).
In laboratory and pot experiments with model polystyrene particles, yes, mostly into roots and less into shoots and grains. On one compost-amended field in France, a grass held polystyrene nanoplastics mainly in its roots. Whether food crops from ordinary fields contain nanoplastics is not established: one study reports high values with a method that still needs crop-specific checks. (level C,20,28,6,31) What this means for diet is on the Human Body page.
At test doses of about 0.1% to several percent of soil weight, microplastics change soil structure, water retention and earthworm survival. A two-year Swiss field test with PET at 1% found little change in pore structure. At the much lower concentrations common in surveyed fields, harm is not established by the studies we cite. (level C,22,24,25,17)
Plastic settling from the air is on Atmosphere; runoff to rivers and the sea is on Oceans. Crop uptake and diet are on Human Body. In one 2026 study, iron-doped biochar (3% of soil weight) cut nanoplastic in lettuce leaves by about 60%, from 0.90 to 0.36 mg/kg37; that is on Solutions by System. Rules for sludge and mulch film are on Policy & Regulation.
Editorial categories of this site. A–E grade scientific findings, per claim, with a one-line rationale; D and E are not lower rungs of the A–C scale. P is not a grade: it marks facts checked against their primary record.
WHAT WORKS, WHERE, AND HOW FAR
In the evidence we searched, none of the four systems (air, water, soil, human body) has a proven complete solution for micro- and nanoplastics. Filters and treatment plants retain many particles from the air or water passing through them, and what they retain still goes somewhere.
In the evidence we searched, no method removes micro- or nanoplastics from open air, open water, field soil or the human body at the scale of the whole system. That is why this site counts 0 of 4 complete solutions. What works is local and conditional: filters and treatment plants retain much of the plastic in the air or water that passes through them. Three Australian wastewater plants removed 91–96% of the nanoplastic mass they received (level C)1.
The open question is where retained plastic goes next. Plants concentrate it in sewage sludge2. A 2016 estimate put the microplastics spread on farmland with sludge in Europe and North America at 107,000–730,000 metric tons (t) a year. That is comparable to or larger than the 93,000–236,000 t then estimated to float at the ocean surface (estimates, level C)3.
We call a method a complete solution only if it meets four conditions. It works on dispersed particles at the scale of the whole system. It covers nanoplastics (below 1 µm), not only visible microplastics. It has been shown outside the laboratory. And it does not just move particles into another system. We found no method that meets all four for air, water, soil or the human body (level E; searches listed at the end of this page).
The home cards therefore say "no proven removal at scale" in words, not as a percentage; 0 of 4 counts the systems meeting all four conditions. The percentages below are local results, each from one device, plant or experiment under stated conditions.
Each system section gives the technology status (none, laboratory, pilot, deployed locally), the best result with its conditions, and why it falls short. Laws are not rated on this scale; their legal status is given separately.
P marks facts checked against a primary record, such as a legal text, a filter rating or our arithmetic. What is found in each system is on Evidence by System; the cross-system comparison is on Solutions by Approach.
≥99.97%
HEPA filter rating at the hardest particle size to catch
particles of 0.3 µm passing through the filter medium; theoretical rating, US EPA; larger and smaller particles are trapped more efficiently; not a room result4
a property of the filter, not of the air in a room or a city
PProvenance99.5%
model nanoplastics retained in the first 0.9 m of a pilot rapid sand filter
palladium-labeled core-shell model nanoplastics (about 164 nm), spiked into Lake Zurich water, 9-hour run, pilot plant at the Zurich Water Works; Pulido-Reyes et al. 20225
measured in a pilot; the often-quoted ≈99.9% for slow sand filtration is a model result, not a measurement
CLimited91–96%
nanoplastic mass removed in three wastewater plants
nine polymers, 0.01–1 µm, influent vs effluent, py-GC/MS; three municipal plants in Australia; Okoffo & Thomas 20241
retained mass moves to sludge; still about 0.7–24 kg of nanoplastics released per plant per year (estimate)
CLimited≈60%
lower nanoplastic concentration in lettuce leaves with iron-doped biochar
pot experiment, 3 wt% biochar in soil, palladium-doped nanoplastics, leaf concentration 0.90 → 0.36 mg/kg (mass basis and particle size not given in the abstract); Aly et al. 20266
binding in soil, not removal from soil
CLimitedLimitation
None of these numbers is a share of the environment cleaned. Ratings, tracer experiments and plant measurements use different particles, sizes and units (counts or mass), so they cannot be compared directly or added together.
We found no method that removes micro- or nanoplastics from outdoor air at any scale; laboratory chamber tests exist (level E; search 1 below). Even the size of the airborne load is unsettled. Evangelou and colleagues compared a global set of measurements with models and found the models overestimated median atmospheric microplastic concentrations by two to four orders of magnitude (level C)7.
Indoors, filtration works on the air that reaches the filter. The US EPA describes a HEPA filter as theoretically removing at least 99.97% of particles of 0.3 µm, the most penetrating size. Larger or smaller particles are trapped even more efficiently (level P)4. How much cleaner a room becomes depends on airflow, room volume, running time and what keeps shedding particles inside it.
Two office studies illustrate that gap, with different endpoints. In a small windowless office in Malaysia, deposited microplastic counts fell by about 35% on days an air purifier ran (level C)8. In an office in Taiwan, airborne indoor-to-outdoor microplastic ratios were lower with an air cleaner running, but higher when electric fans ran at the same time (level C)9.
Dewika and colleagues sampled deposited particles in a 28.9 m³ windowless university office in Petaling Jaya over eight weeks, 170 samples, with an air purifier switched on or off and vents open or closed. Microplastic counts fell by about 35% with the purifier running (1,274 to 826 with vents open).
Limits: a conference paper, one room, deposition rather than inhaled air, visual counting with hot-needle checks (particles tens of micrometers and larger), no nanoplastics, and a co-author from a purifier manufacturer. A 2026 office study measured airborne ratios instead and found that fans can cancel the effect9.
Read the study ↗Outdoors, the working lever is the source. Tire wear emissions are estimated at 0.23–4.7 kg per person per year, with a global average of 0.81 kg (estimate, level B)10. In size-fractionated street air in Leipzig, tire wear made up about 65% of the plastic mass in particles below 10 µm (level C)11.
The EU's Euro 7 regulation caps brake particles (PM10, all brake dust, not only plastic). Until the end of 2029 the limit is 7 mg/km for most new cars and vans and 3 mg/km for battery-electric ones; heavier N1 Class III vans have 11 mg/km, or 5 mg/km if battery-electric. From 2035 it is 3 mg/km for all (level P)12.
Euro 7 is adopted and in force and applies to new car and van types from 29 November 2026, so on 3 November 2026 it was not yet applying. Its tire abrasion table is still empty in the consolidated text of 2 September 2026 (level P)12.
A draft UN Regulation No. 186 on passenger-car tire abrasion, agreed at the June 2026 session of the UN vehicle forum WP.29, was notified on 30 July 2026. It counts as adopted unless more than one-fifth of the parties object within six months (level P)13,14. Details are on Policy & Regulation. Technology status: removal none; source limits not rated; no measured effect on airborne plastic yet.
IllustrationDrinking-water plants supply the strongest nanoscale results. Pulido-Reyes and colleagues at Eawag ran labeled model nanoplastics through laboratory filters and pilot filters at the Zurich Water Works (level C)5,15. Aged, biofilm-coated sand retained them best.
Pulido-Reyes and colleagues (Eawag, 2022) spiked Lake Zurich water with palladium-labeled core-shell model nanoplastics (about 164–215 nm) and passed it through ozonation, sand and activated carbon filters in laboratory columns and in pilot rapid sand and carbon filters. Ozone hardly changed transport. In the pilot, the sand filter retained 99.5% of the particles in its first 0.9 m during a 9-hour run; the carbon filter retained 10%.
A model of the full Zurich treatment train then gave 3.6-log removal (0.4 rapid sand, 0.2 carbon, 3.0 slow sand), so the ≈99.9% for slow sand filtration is modeled. Limits: tracer particles at high concentration rather than environmental nanoplastics, one water source, short runs, and no slow sand filter tested at pilot scale.
Read the study ↗Xu and colleagues (2024) measured plastic mass by py-GC/MS at each step of a full-scale drinking-water plant, in three size classes. Total polymer fell from 9.63 µg/L in raw water to 0.77 µg/L in treated water. Nanoplastics (0.01–1 µm) were only 3.2–5.3% of the polymer mass and were removed least well, at 88.9 ± 3.2%, against 92.9% for particles of 50–1,000 µm.
It matters because it measures real particles at full scale. Limits: one plant, a method open to matrix interference, and mass rather than particle counts.
Read the study ↗The two studies agree in direction: 99.5% of clean tracer particles in a pilot filter, about 89% of real nanoplastic mass at full scale. Regulatory monitoring of drinking water does not yet cover nanoplastics; the EU method starts at 20 µm (level P)17; see Policy & Regulation.
Wastewater plants retain most of the microplastics they receive. A review of 21 studies found average removal of about 88% in plants with secondary treatment and 94% with tertiary treatment, most of it in the preliminary and primary steps (level B)2. Membranes go further: a membrane bioreactor in Finland cut microplastics of 20 µm and larger from 6.9 to 0.005 particles per liter, a 99.9% reduction (level C)18.
Okoffo and Thomas (2024) measured the mass of nine polymers below 1 µm through three municipal wastewater plants in Australia by py-GC/MS. Total nanoplastic fell from 27.7, 18 and 9.1 µg/L in influent to 1, 1.4 and 0.8 µg/L in effluent, removal of about 96%, 92% and 91%. The plants still release an estimated 24, 2 and 0.7 kg of nanoplastics per year.
It is one of the first mass budgets of nanoplastics at full scale. Limits: three plants in one country, and py-GC/MS polymer identification that is debated for complex matrices.
Read the study ↗Capture can also start at the appliance. In laboratory tests of six devices, an external washing-machine filter reduced microfiber release to wastewater by about 78% (level C)19.
Erdle and colleagues (2021) installed washing-machine filters in 97 homes in Parry Sound, Ontario, about 10% of the households served by the town's wastewater plant. Microfibers in the treated final effluent fell significantly after installation. Filters caught an average of 6.4 g of lint per home per week, equivalent to 179,200–2,707,200 microfibers.
It is the first community-scale test of source capture. Limits: one small town, microfibers only, no nanoplastic measurement, and lint that still has to go to waste.
Read the study ↗France's filter obligation for new washing machines is covered on Policy & Regulation; household choices are on What You Can Do.
We found no method that removes dispersed nanoplastics from oceans, rivers, lakes or groundwater (level E; search 2 below). The largest cleanup operation, The Ocean Cleanup, reports more than 45 million kg (45,000 t) of trash removed from rivers and the ocean by December 2025. Over 25 million kg of it came in 2025 (self-reported, level C)21.
The OECD estimated about 30 million metric tons (30 Mt) of plastic in the ocean in 2019 (estimate, level C)22. Even if every kilogram had come from the sea, the cleanup total would be about 0.15% of that stock (our calculation from21 and22, level P). Much of the catch comes from rivers, so this is an upper bound, not a cleanup efficiency.
Those nets and river barriers catch floating coarse items; a nanoparticle passes straight through. Nanoplastics are a separate stock: one cruise extrapolated about 27 Mt in the mixed layer of the temperate to subtropical North Atlantic alone (estimate, level C)23. That figure is not comparable to the cleanup or OECD totals, which count different sizes and places.
IllustrationWe found no method that removes dispersed micro- or nanoplastics from field soil. The studies we found test oxidation, washing or binding in the laboratory and in pots (level E; search 3 below). Once particles are mixed into the plow layer, there is no flow to filter.
Prevention therefore carries the load. Sewage sludge is a documented route: Nizzetto and colleagues estimated 63,000–430,000 t of microplastics a year reaching European farmland this way (estimate, level C)24,3. The FAO estimated about 12.5 million t of plastic products used each year in plant and animal production, with mulch films a main source of plastic left in soil (estimate, level C)25. Rules on sludge are on Policy & Regulation, and what is found in soil is on Soil.
The tested remediation is binding: amendments that hold particles in place and keep them out of crops.
Aly and colleagues (2026) grew lettuce in soil with palladium-doped nanoplastics and confirmed that particles entered roots and moved to leaves. Adding 3 wt% pine-sawdust biochar or iron-doped biochar lowered leaf nanoplastic concentrations; the iron-doped form cut them by about 60%, from 0.90 to 0.36 mg/kg, and eased metabolic stress.
It is the clearest recent result for crop protection. Limits: a pot experiment with model particles, one crop and one soil, and the nanoplastics stay in the soil. The abstract gives neither the mass basis nor the particle size; the full text is paywalled.
Read the study ↗Technology status: binding at laboratory (pot) scale; removal none.
We found no procedure shown to remove nanoplastics from the human body (level E; search 4 below). The evidence so far concerns microplastics counted in blood before and after filtering plasma outside the body.
Weinstein and colleagues (2026) measured circulating microplastics in 114 patients before and after 174 one-plasma-volume therapeutic plasma exchanges. Counts fell after treatment, but at low starting levels the reduction was hidden by particles leaching back into the blood from the plastic tubing set.
It is the first report of lower blood microplastics after a procedure. Limits: before-and-after measurements only, blood counts only, an assay for micrometer-sized particles with no nanoplastic data, and authors who work for a company offering the procedure.
Read the study ↗A preliminary 2026 report from Dresden describes double-filtration plasmapheresis in small groups. According to a news summary, polyethylene measured by py-GC/MS fell in all four patients tested, while polystyrene rose in one. A Nile Red count of nanoscale particles fell by about 70% in four patients, without statistical significance (level C)27,28. We could not read the full text.
Nile Red also stains fatty material that is not plastic. A 2025 method study found py-GC/MS unsuitable for polyethylene in blood because lipids create interfering signals (level C)29.
A registered pilot trial of double-filtration plasmapheresis (NCT07658443) plans 20 participants and lists micro- and nanoplastic counts as a primary outcome. The registry gives 12 June 2026 as the actual start date (sponsor-reported) and 1 August 2026 as the estimated primary completion. No results were posted when we checked on 3 November 2026 (level P)30. What the particles may do in the body is on Human Body.
Limitation
A lower count in a blood sample after one session is not removal from organs, not a lasting change and not evidence of health benefit. A trial registration is a plan, not a result.
Solution status by system: how far each approach has got
| label | value | unit | system | best_result | source | legal_status |
|---|---|---|---|---|---|---|
| Air · removal from outdoor air | 0 | technology step (0 none, 1 lab, 2 pilot, 3 deployed locally) | air | none found | S-052 | |
| Air · indoor HEPA filtration | 3 | technology step | air | ≥99.97% at 0.3 µm (filter rating); about 35% fewer deposited microplastics in one office; lower indoor/outdoor ratio in another | S-127; S-171; S-172 | |
| Air · source limits (brakes, tires) | not rated (legal instrument) | air | brake PM10 limit 7 mg/km (3 mg/km battery-electric) to end-2029; no measured effect on airborne plastic yet | S-135; S-356 | Euro 7 adopted and in force; applies to new car and van types from 29 Nov 2026; EU tire limits not yet set; UN Regulation 186 draft notified 30 Jul 2026 | |
| Water · drinking-water treatment | 3 | technology step | water | 88.9% of nanoplastic mass, one full-scale plant; 99.5% of tracer nanoplastics in 0.9 m of a pilot rapid sand filter (≈99.9% for slow sand is modeled) | S-118; S-113 | |
| Water · wastewater treatment | 3 | technology step | water | 91–96% of nanoplastic mass, three plants; 88–94% of microplastics, 21-study review | S-047; S-381 | |
| Water · washing-machine filters | 2 | technology step | water | about 78% less microfiber release (lab); lower effluent microfibers in a 97-home pilot | S-125; S-167 | |
| Water · open-water cleanup (nanoplastics) | 0 | technology step | water | none found; coarse debris only, about 45,000 t to December 2025 | S-116 | |
| Soil · removal from field soil | 0 | technology step | soil | none found | search 3 (this page) | |
| Soil · biochar binding | 1 | technology step | soil | about 60% lower nanoplastics in lettuce leaves, pot test | S-085 | |
| Human · removal of nanoplastics | 0 | technology step | human | none found | search 4 (this page) | |
| Human · plasma exchange (blood microplastics) | 2 | technology step | human | lower blood microplastic counts after 174 procedures, masked at low starting levels | S-111 |
Every working method on this page moves particles; none destroys them. A HEPA filter holds what it catches until the cartridge is replaced and thrown away. A washing-machine filter turns microfibers into lint for the bin. A wastewater plant concentrates microplastics and nanoplastics in sludge, and where sludge is spread on fields, success for water becomes input for soil24,3.
The 2024 recast of the EU Urban Wastewater Treatment Directive adds monitoring of microplastics at the inlets and outlets of larger plants and in sludge when relevant (level P)31. Monitoring is not removal.
We found no treatment plant that destroys nanoplastics as part of routine operation (level E; sources on this page and search 2). This is why we report retention as a local result and never as a share of a system cleaned. Degradation approaches are compared on Solutions by Approach.
We list a method when a peer-reviewed study, a public agency or the operator reports a result with its conditions; operator figures are marked as self-reported. This page and the four home cards are updated together from the same sources. The 0 of 4 count changes only when a method meets all four conditions in the first section. Errors can be reported through Corrections & Contact.
The absence findings rest on the sources on this page and four Europe PMC title-and-abstract searches (2016–2026, run 3 November 2026), each combining "microplastic*" or "nanoplastic*" with removal or remediation terms. Search 1, outdoor or ambient air: 39 records, no field removal method. Search 2, nanoplastics in open water, in situ or field: 2 records, no removal method.
Search 3, soil with field-scale terms: 3 records, none removing particles. Search 4, apheresis, plasma exchange or hemoperfusion: 1 record (Weinstein 2026). Engineering databases were not searched, so each result means "not found in this search".
Editorial categories of this site. A–E grade scientific findings, per claim, with a one-line rationale; D and E are not lower rungs of the A–C scale. P is not a grade: it marks facts checked against their primary record.
WHERE EVERY NUMBER COMES FROM
Every factual claim on this site points to a numbered source, and every source sits in one registry. This page explains how sources are ranked, how we searched, how DOIs and correction notices are checked, which steps are still planned, and where the process falls short.
Every factual claim on this site points to a numbered source, and every source sits in one registry. We rank sources by how they were checked, confirm that each DOI resolves to the paper we meant, and look for corrections and retractions. It matters: in one case study of articles retracted in 2014, the vast majority of later citations were positive despite clear retraction notices (level C)1. This page shows what the process does, what is planned and what it misses.
Peer-reviewed research articles and reviews are the first tier. They carry the measurements, the methods and the uncertainty that a claim needs. A review is weighed by its methods, not its label. A systematic review with a documented search and inclusion rules counts for more than a narrative or critical review, and any review counts only for the question it examined.
Reports from public agencies, scientific academies and standards bodies form the second tier. They often summarize evidence for policy, as the European academies' SAPEA review did in 20192, or document method performance, as the JRC/BAM interlaboratory study did for PET in water3.
Reputable press is the third tier. We use it for dates, events and statements that have no peer-reviewed record yet. When a paper reports the same result, we cite the paper.
Preprints are always labeled as preprints. bioRxiv states that its articles are posted without peer review, editing or typesetting, after only basic screening4. EarthArXiv, a server for the earth sciences, says it does not evaluate the scientific quality of submissions5.
Marketing material, product claims, unsourced blogs and AI-generated summaries are never cited as evidence that something is true or works. When an organization's own statement is itself the fact being reported, such as a nonprofit's removal totals, we cite it as that organization's statement and label it self-reported. An AI tool may help us find a paper; it is never the thing we cite.
This is a curated review, not a systematic review. The search covers the literature from 2004, the year Thompson and colleagues reported in Science that microscopic plastic fragments and fibers are widespread in the oceans6, to the snapshot date of 4 November 2026. Work from 2024 to 2026 was searched first, and older landmark papers were added where later work still depends on them.
The tools were general web search, publisher and journal pages, agency and standards-body websites, and the Crossref metadata service7. Each page was researched separately, in English, against a written brief. The sources found for single pages were merged into the shared registry on 4 November 20268.
Exact search queries were not logged for every page, so the selection cannot be repeated query by query9. A dated search record for each page is planned.
For the shared registry, every item dated 2025 or 2026 was reconfirmed by web search or Crossref on 3 November 2026. Recent records change most often: early-view papers get page numbers, and preprints get published or withdrawn.
Checking happens in four steps. The first three apply to each source, the fourth to each claim.
Every contradicted, unsupported or unknown verdict then goes to a fix round. There the text is corrected, the claim is removed, or the reason for keeping it is recorded in the page's fix log. Publishing the verdicts and fix logs is planned.
Method
The Crossref record is not a guarantee. Crossref itself says that its correction marker does not prove a publisher has reported every update10, and the Retraction Watch data are less complete for corrections than for retractions12. A clean check means no notice was found, not that none exists.
Footnotes appear as numbers that link to the source list at the foot of the page. Each entry there gives the full reference with a DOI or stable link, and preprints carry the tag "Preprint · not peer reviewed".
In the site's files, each source has a registry id, such as S-029, that stands for the same document on every page. Sources found for one page carried temporary ids starting with N until the merge of 4 November 2026; the pages now cite registry ids only.
Behind each page sits a claims ledger. Every number, comparison or strong statement is meant to have a line there, with its value, scope, source, year and, once checked, the verifier's verdict. Sentences found without a line get one in the fix round, or are removed.
Key scientific findings carry an evidence level from A to E. Records that are checked rather than weighed, such as a publication date, a DOI's registration agency or a quoted guideline, carry the category P: provenance checked against the primary record. The rubric is on Evidence levels; for the numbers themselves, see How to read the numbers.
Who paid for a study does not decide whether it is right. It can decide which questions were asked and how results were framed, so we note it when it is material to a claim.
When authors are affiliated with an organization whose work they evaluate, our rule is to say so next to the number. The 2018 estimate of plastic in the Great Pacific Garbage Patch by Lebreton and colleagues is an example. Fourteen of its 16 authors, including the first, list The Ocean Cleanup as an affiliation; the acknowledgments thank its donors for helping fund the research; the paper declares no competing interests14.
Figures that an organization reports about its own results, such as The Ocean Cleanup's annual removal totals, are labeled self-reported15. Where a finding is publicly challenged, both sides are cited, as with the 2025 exchange over plastics in human brain tissue16,17. We do not make allegations about funding or motives that no published source supports.
All sources live in one registry file that the site is built from8. It currently holds 429 entries. Each entry records type, authors, year, publisher, DOI or URL, open-access status where known, the systems and topics it covers, and whether its DOI was verified through Crossref.
The registry is published as a download, sources.json, copied from the registry file at each build; the copy in this release dates from 4 November 20268. The claims ledgers and their verifier verdicts are not yet public; a download is planned. Until it exists, the claim-level record readers can see is the footnote on each page.
The two graphics below show the shared registry, the same file the footnotes come from, as it stood on 4 November 2026, after the merge. The entry count above and the data table under each graphic are computed from the registry at each build; redrawing the graphics automatically at each release is planned.
Shared registry by source type, as of 4 November 2026
| label | value | unit | crossref_verified_doi |
|---|---|---|---|
| journal-article | 208 | entries | 207 |
| review | 49 | entries | 49 |
| report | 29 | entries | 6 |
| standard | 8 | entries | 1 |
| dataset | 5 | entries | 0 |
| press | 27 | entries | 0 |
| preprint | 3 | entries | 3 |
| web | 94 | entries | 1 |
| site-record | 6 | entries | 0 |
| total | 429 | entries | 267 |
Shared registry by publication year, as of 4 November 2026
| label | value | unit | journal_article | web | report | review | standard | press | dataset | preprint | site_record |
|---|---|---|---|---|---|---|---|---|---|---|---|
| 1922 | 1 | entries | 1 | ||||||||
| 2001 | 1 | entries | 1 | ||||||||
| 2002 | 2 | entries | 2 | ||||||||
| 2004 | 1 | entries | 1 | ||||||||
| 2007 | 2 | entries | 1 | 1 | |||||||
| 2008 | 1 | entries | 1 | ||||||||
| 2009 | 4 | entries | 2 | 1 | 1 | ||||||
| 2010 | 1 | entries | 1 | ||||||||
| 2011 | 2 | entries | 2 | ||||||||
| 2012 | 3 | entries | 2 | 1 | |||||||
| 2014 | 2 | entries | 1 | 1 | |||||||
| 2015 | 5 | entries | 2 | 1 | 1 | 1 | |||||
| 2016 | 12 | entries | 8 | 1 | 2 | 1 | |||||
| 2017 | 14 | entries | 10 | 2 | 2 | ||||||
| 2018 | 11 | entries | 7 | 4 | |||||||
| 2019 | 25 | entries | 17 | 1 | 2 | 2 | 1 | 2 | |||
| 2020 | 42 | entries | 25 | 4 | 1 | 8 | 3 | 1 | |||
| 2021 | 23 | entries | 13 | 3 | 7 | ||||||
| 2022 | 30 | entries | 19 | 2 | 4 | 4 | 1 | ||||
| 2023 | 20 | entries | 13 | 3 | 3 | 1 | |||||
| 2024 | 36 | entries | 20 | 3 | 3 | 6 | 2 | 2 | |||
| 2025 | 42 | entries | 23 | 6 | 2 | 6 | 1 | 3 | 1 | ||
| 2026 | 137 | entries | 41 | 55 | 9 | 3 | 1 | 17 | 2 | 3 | 6 |
| no year recorded | 12 | entries | 12 |
The search was run in English. Studies published only in Chinese, Japanese, Korean, Spanish or other languages are underrepresented, and we have not measured by how much.
Some papers sit behind paywalls. Where only the abstract was available to us, the claim rests on the abstract, and the verifier records that.
Indexes lag behind publication. Papers from the weeks before 4 November 2026 may be missing, and Crossref records for very recent articles sometimes lack corrections that the publisher has already posted.
AI-assisted search finds what is well linked and well cited. It can miss small journals, conference proceedings and data repositories. Several official websites also block automated checks, so their pages were confirmed through secondary listings rather than fetched directly.
If you find an error or a missing study, Corrections & contact explains how to report it. The process that produces these pages is described on How we work, and the model behind the home counters on Flows & model.
Editorial categories of this site. A–E grade scientific findings, per claim, with a one-line rationale; D and E are not lower rungs of the A–C scale. P is not a grade: it marks facts checked against their primary record.
LAST 60 DAYS · CHECKED 3 NOV 2026
Eleven dated news items on micro- and nanoplastics from 4 September to 3 November 2026, each with its source, a short summary and our grade. River export models, Everest deposition, reactive microplastic surfaces, a California listing and the treaty timetable lead this edition.
This page lists 11 news items on micro- and nanoplastics published between 4 September and 3 November 2026, last checked on 3 November 2026. We included new peer-reviewed papers, documented policy steps and one widely shared report, and opened every linked page or its full record. Each item gives the publication date at the outlet, a two-sentence summary, why it matters and our grade.
Grades A to E apply to scientific findings; P marks facts checked against an official record. Press-only items are graded no higher than C.
Two river models in the window differ in emphasis. A European model estimates that about 0.6% of the plastic emitted in its 2015 model year reached river mouths (level C)1,2. A global model reports that rivers deliver more microplastic to the sea than most earlier estimates (level C)3.
Estimate
Both river figures are model estimates, not measurements. The European model gives about 16,900 metric tons (16.9 kt) of microplastic exported from river outlets per year for 2015, and Phys.org reports the global model's 2022 total as about 263,000 metric tons. They cover different regions, years, endpoints and methods and should not be compared directly.
Items run newest first. Research items link the primary paper; the advocacy report links its publisher.
Deposition samplers at two sites, run from February 2024 to January 2025, collected 64.0 microplastic particles per square meter per day at Qomolangma Station and 23.0 at Everest Base Camp, identified by micro-Raman spectroscopy between 1 and 200 µm. Nanoplastics (below 1 µm, py-GC/MS, five months only) included PE, PET, PVC and PP, and upscaling gives an estimated 56.4 metric tons of microplastic a year above 4,000 m on the Tibetan Plateau.
Why it matters: It is a rare twelve-month deposition record from a remote high-altitude region, but nanoplastics were measured in five months only and the plateau-wide mass, which assumes a density of 1.0 g/cm³, extrapolates from two sites.4
Small Change Fund and partner groups report that py-GC/MS detected plastic polymers in blood from 27 of 28 selected public figures in Canada and the US, with eight polymer types found overall. A second assay counted Nile red-stained particles in plasma from 24 participants by flow cytometry, which does not identify each particle's polymer; the report gives these counts per microliter in its text but per milliliter in one figure, so we do not repeat them.
Why it matters: It will be widely quoted, but participants were selected rather than sampled, the report says its results cannot diagnose disease, and py-GC/MS results for PE and PVC in blood are disputed: Rauert et al. (2025) found that lipids can produce false signals, while the report says lipids were removed with cyclohexane before analysis.5,6,7,8
Stibora and colleagues modeled plastic retention and export in 8,671 European river systems for 2015 and estimate that, of 3.55 million metric tons of plastic emitted to the environment, about 0.6% (about 20,000 metric tons) reached river mouths. That includes about 16.9 kt of microplastic (1 µm to 5 mm) exported from river outlets, against 159 kt of microplastic retained in rivers, with most plastic staying on land.
Why it matters: It treats land and riverbeds as long-term stores rather than pipes to the sea; all values are model estimates with wide ranges, and we quote the all-plastic share from the authors' university release because the abstract's per-class shares (0.1% and 0.5%) do not reconcile with its masses.1,2
Yu and colleagues gave male BALB/c nude mice (six exposed per diet group) daily oral doses of 1 µg per gram of body weight of UV-aged polystyrene nanoplastics, about 284 nm across and dual fluorescence-labeled. Estimated gut retention of the particles' fluorescence 24 hours after a dose was about two and seven times lower on 15% and 50% cellulose diets than on 5% standard feed, and over 28 days the high-fiber diet was associated with less intestinal damage and less signal in organs.
Why it matters: It is one of few tested ways to lower nanoplastic retention in the gut, but every measure was a fluorescence signal from model particles rather than an independent count of plastic in tissue, in male mice at the tested dose, not in people.9
Qian, Min and colleagues at Columbia University and UC Berkeley report that commodity microplastics spontaneously generate reactive oxygen species at the plastic–water interface, more strongly for more hydrophobic surfaces. Ab initio calculations attribute this to easier hydroxide oxidation at those interfaces, and the authors link the chemistry to protein aggregation and cell damage.
Why it matters: It challenges the assumption that plastics are chemically inert in water, but it is a laboratory result that has not been shown in living tissue or in people.10,11
Qin and colleagues built a global daily model of river microplastic export, trained on 1,386 measurements according to Phys.org; 96% of the export originates in the Global South, over half from Southeast and East Asia. About 70% of global river discharge shows 'pulse enrichment', where heavy rain raises concentrations instead of diluting them; Phys.org reports the 2022 total as about 263,000 metric tons.
Why it matters: It makes rainfall extremes central to ocean inputs; Roberto Rosal (University of Alcalá) noted that the mass total depends on converting particle counts to mass with an assumed size distribution.3,12,13
One item reports a legal step, one an agency synthesis, one the treaty timetable and one an investigation of industry records. For the full regulatory picture, see Policy & Regulation.
From 1 October 2026, California's toxic substances agency (DTSC) lists microplastics as a Safer Consumer Products candidate chemical; the state's Notice Register records the rule as filed with the Secretary of State on 18 June 2026. Food Packaging Forum reports that the listing covers plastic particles under 5 mm with no lower size limit, restricts no product by itself and lets the agency name Priority Products in separate rulemaking, none of which has been proposed.
Why it matters: It opens a legal route to product-level rules in California, but which products are covered, and when, is not yet set.14,15,16
Susanne Rust reports on industry documents showing that company scientists discussed Gerhard Volkheimer's 1974 work, in which swallowed PVC particles crossed the gut lining of animals into blood, lymph and organs. A 1975 Union Carbide letter complained the paper was often cited as a 'horror story' and countered it with a 1947 industry-sponsored study; the American Chemistry Council disputes that industry stayed silent.
Why it matters: It is historical journalism, not new science, but it adds documented context to current debates on food-contact plastics.17
A Food and Agriculture Organization brief by Yates and colleagues, published on 21 September 2026, traces how plastics and micro- and nanoplastics move through soils, animals, food and people. It states that the health and food-safety implications of current dietary exposure remain uncertain, and it cites a global estimate of 13.4 million metric tons of agricultural plastics used a year from a 2025 FAO working paper, without a reference year.
Why it matters: It brings a UN food agency into the issue with a One Health framing and recommends monitoring particles and chemicals in food systems across the plastic life cycle.18,19
After informal heads-of-delegation talks in Bangkok on 27–30 September 2026, chair Julio Cordano told AFP he expects the plastics treaty could be adopted at INC-5.4 in March. Contested parts of his non-binding 'aid to negotiations' text, including a production cap and health references, remain bracketed; he plans a new version in November and informal talks in January.
Why it matters: It sets the timetable: the November text is the next document to show which contested measures remain before formal talks in March 2027, whose exact dates UNEP has not yet confirmed.20,21
Crossref lists a retraction notice (Heliyon, October 2026)22, an editorial expression of concern (Archives of Microbiology, 24 September 2026)23 and more than a dozen corrections for micro- and nanoplastic papers registered inside the window (our search of Crossref update records, 3 November 2026). We could not open the two notices, so their reasons are not established and they are not listed as items. Findings grouped by evidence level are in Evidence by Status.
Zhao and 12 co-authors sorted 1,431 marine microplastic studies from 2004 to 2026: 72% binned sizes, 13% gave only a range, 13% gave none and 2% reported raw sizes. They propose making raw per-particle size reporting, at minimum the longest dimension, a requirement, with raw data deposited so size distributions can be rebuilt and compared.
Why it matters: Size controls how particles move and where they end up, so binned or missing size data limit comparisons across studies and any extension of counts toward smaller sizes.24
News items on a 60-day line, 4 September to 3 November 2026
| label | value | unit | date | section | level |
|---|---|---|---|---|---|
| Science: river export pulses | 6 | days after 4 Sep 2026 | 2026-09-10 | research | C |
| AFP: treaty chair timetable | 27 | days after 4 Sep 2026 | 2026-10-01 | policy | C |
| Nature: reactive microplastic surfaces | 40 | days after 4 Sep 2026 | 2026-10-14 | research | C |
| FPF: FAO agrifood brief | 40 | days after 4 Sep 2026 | 2026-10-14 | policy | P |
| Nature Communications: fiber and nanoplastics in mice | 41 | days after 4 Sep 2026 | 2026-10-15 | research | C |
| PNAS: report every particle | 47 | days after 4 Sep 2026 | 2026-10-21 | methods | C |
| ES&T: European river retention | 49 | days after 4 Sep 2026 | 2026-10-23 | research | C |
| LA Times: industry memos | 52 | days after 4 Sep 2026 | 2026-10-26 | policy | C |
| Report: plastics in blood of 28 people | 53 | days after 4 Sep 2026 | 2026-10-27 | research | D |
| FPF: California candidate chemical | 54 | days after 4 Sep 2026 | 2026-10-28 | policy | P |
| Comm. Earth & Env.: Everest deposition | 56 | days after 4 Sep 2026 | 2026-10-30 | research | C |
We left out items dated outside the window even when they circulated inside it. These include the first report of nanoplastics in Antarctic soils (Scientific Reports, 4 July 2026)25 and a Scientific Reports retraction of a 2025 FTIR microplastic study (2 September 2026)26. A nanoplastic biosensor had a press release on 8 September, but its paper was registered in May27. We also left out press releases whose papers we could not open, and coverage that repeats a listed item.
Some expected items had not appeared by 3 November 2026. The US EPA page still shows its sixth Contaminant Candidate List, whose April draft added microplastics as a priority group, as in progress28,29. The chair's next treaty text was due in November.
The MICRO 2026 conference site (Cádiz) showed no outcome statement, only a book of abstracts marked "coming soon"30. We found no first indicator report from the Lancet Countdown on health and plastics on its program page or in Crossref31.
Older studies behind these items sit in Landmark Studies. Meetings ahead, including the next treaty meetings, are in Events & Conferences. Findings sorted by level A to E are in Evidence by Status.
News card: outlet, date, section and evidence level of each item, generated from the news list. No press photos.
Editorial categories of this site. A–E grade scientific findings, per claim, with a one-line rationale; D and E are not lower rungs of the A–C scale. P is not a grade: it marks facts checked against their primary record.
PROCESS, PEOPLE AND LIMITS
This site is an independent science observatory on micro- and nanoplastics, written with AI agents and approved by one human editor. Here we describe who is responsible, how each page is drafted and checked, how images are made and labeled, and what the site cannot do.
This site is an independent observatory of the published evidence on micro- and nanoplastics in air, water, soil and the human body. It collects measurements, estimates and open questions, grades each key finding and links every claim to the document it comes from. It is not a research institute, runs no laboratory of its own, does not campaign and gives no medical advice.
One example of how literal we try to be: the rotating globe shows no single day. In NASA's Blue Marble composite, released in 2002, the land surface is built from satellite observations made from June to September 2001. The clouds combine two days of visible-light imagery with a third day of infrared imagery over the poles (P)1.
The site is owned and edited by {{OWNER_NAME}}, based in Croatia. The owner decides what is published, approves every page before it goes live and answers for its content. There is no editorial board and no staff of human writers; the drafting is done by AI agents working under the owner's briefs and rules. If you find an error or want to ask about a source, write to {{CONTACT_EMAIL}}; the procedure is on Corrections & Contact.
Every page starts as a written brief, drafted by an AI coordinating agent within rules set by the editor: the reader question it answers, its sections, the facts it must check and the topics it must leave to other pages. From there each page passes the same seven steps (P)2.
How a page is made
| label | value | unit |
|---|---|---|
| 1 Research: find and read papers, reports and official pages, newest first | 1 | step |
| 2 Draft: write the page from the brief and the sources | 2 | step |
| 3 Claims ledger: list every number, comparison and strong statement with source, scope and grade | 3 | step |
| 4 Verification: a separate checker opens each cited source and rules each claim confirmed, contradicted, unsupported or unknown | 4 | step |
| 5 Review: an AI model from a different vendor reads the page as a skeptical scientist | 5 | step |
| 6 Approval: the human editor reads, corrects and approves | 6 | step |
| 7 Publication with a snapshot date; planned: reader corrections loop back to step 4 | 7 | step |
The claims ledger is the core of the method. Each claim is a separate record with its value, its scope (where, when, which particle sizes, which method), the source and a grade with a one-line reason. Scientific findings get an evidence level from A to E. Bibliographic facts, official metadata, legal texts, our own arithmetic and statements about this site get P, meaning checked against the primary record (P)2.
Every verdict other than confirmed goes to a fixer: contradicted, unsupported and unknown alike. The fixer corrects the text or writes down why it stands, citing the source. The verification record names the page the checker actually read, so an abstract-only or archived copy is visible; we plan to publish these records with each page (P)2.
The reviewer in step 5 runs on a model from a different company. We do this to get a second, differently produced critique, not because it guarantees independence: both systems can make the same mistake, and we have not measured how often they do. The review looks for overclaiming, missing landmark studies, wrong grades and captions that promise more than an image shows. Its findings go to the editor, who decides what changes.
How we choose and rank sources is explained in Methods & Sources; what the letters A to E and P mean is in Evidence Levels.
We use AI agents for four jobs: searching the literature, drafting text, checking cited sources against claims, and generating illustrations. We say this plainly because it shapes how the site should be read.
AI is never a source on this site. A sentence written by a model counts for nothing until it traces to a cited paper, report, standard or official page that a reader can open. Where we could not find such a document, the page says "not established" and grades the point E.
Responsibility does not move to the software. The Committee on Publication Ethics (COPE) states that AI tools cannot be authors of a paper because they cannot take responsibility for it, and that authors must disclose how they used them. Its position was first issued in February 2023; the current version is dated 20 August 2024 (P)3. We apply the same principle to this site: the human editor is accountable for every published word, and this page is our disclosure.
The site does not publish interviews, quotes from people we have not cited, invented case stories or composite "typical" patients. News items are real, dated reports chosen by the editor.
Every image belongs to one of three lanes, and each lane has its own truth rule.
L1 is real imagery: satellite pictures, field photographs and published micrographs, used only with a verified license and a credit. L2 is data graphics, drawn from cited numbers, each shipped with its data table, its source and a text alternative. L3 is AI illustration. It is always captioned "Illustration", never imitates a microscope image with a fake scale bar and is never presented as a photo or a measurement.
The home page shows both ends of this rule. The rotating Earth is the NASA Blue Marble composite, built largely from observations by the MODIS instrument on the Terra satellite (P)1. The four microworlds are animated AI illustrations, generated with OpenAI's gpt-image model through Codex on 14 October 2026 at the owner's request, with particles enlarged for visibility; their prompts and file lineage are recorded on Picture Credits (P). They are not sample recordings or images of anyone's tissue.
IllustrationEvery image, its license and its author are listed in Picture Credits.
Evidence pages are a dated snapshot, not a live feed. Each carries the date of its last literature review (4 November 2026) and does not update itself; a new study appears only after it has passed the same checks. News is curated by hand from real, dated reports.
The live counters on the home page are estimates, not measurements. Not every input is a micro- and nanoplastic figure: in model v7, applied on 4 November 2026, every water option, from the OECD default to river estimates, covers plastic of all sizes (P)4,5. Flows & Model lists where each input comes from and gives each model version a date.
{{FUNDING_STATEMENT}}
The site carries no advertising and no sponsored content. No funder, company or advocacy group has a say in what is published. If that ever changes, this section will say so before the first such page appears.
Limitation
This is a small project with one human editor, so coverage is uneven and some topics wait longer for updates. The site is written in English first; translations follow later. AI agents can misread a paper or attach a number to the wrong scope, and our checks reduce that risk without removing it. Evidence on nanoplastics is young and moves fast, so a page can be out of date before its next snapshot. If you find a mistake, tell us through Corrections & Contact. We plan to keep a public corrections log there; no corrections have been recorded yet.
Editorial categories of this site. A–E grade scientific findings, per claim, with a one-line rationale; D and E are not lower rungs of the A–C scale. P is not a grade: it marks facts checked against their primary record.